
The GLD conundrum - and opportunity

Key points:
- After a historic rally that peaked in January 2026, the gold ETF ticker GLD plunged over 28%
- Recent price action may have formed a "bear trap", i.e., it broke below support for one day and then quickly reversed higher (at least for the moment)
- At the same time, extreme bearish trader sentiment for gold ETF traders is flashing a contrarian favorable signal
- As long as price holds above recent support, a speculative bullish argument can be made; but any trader planning to play the long side of gold must clearly understand the risks and be prepared to cut a loss
Gold price action is at a decision point
One conundrum of looking at price charts can be stated as follows:
Jay's Trading Maxim #56: You can see whatever you want to see in a bar chart.
One person will look at the SPDR Gold Trust (GLD) chart and note that the price is now below a declining 200-day moving average, and make the (reasonable) assertion that gold is now in an established downtrend.
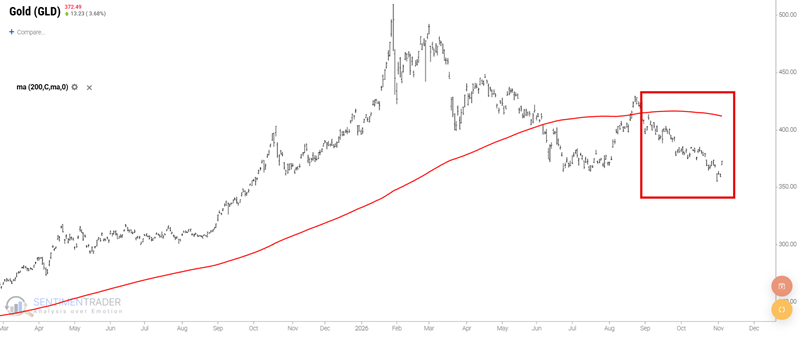
Another person will look at the same chart and note a potential support level in the $360-$365 range. The same person might also make the (reasonable) assertion that GLD just experienced a "bear trap" - where price