
The flight to safety in Utility stocks reversed, triggering a buy signal for the S&P 500

Key points:
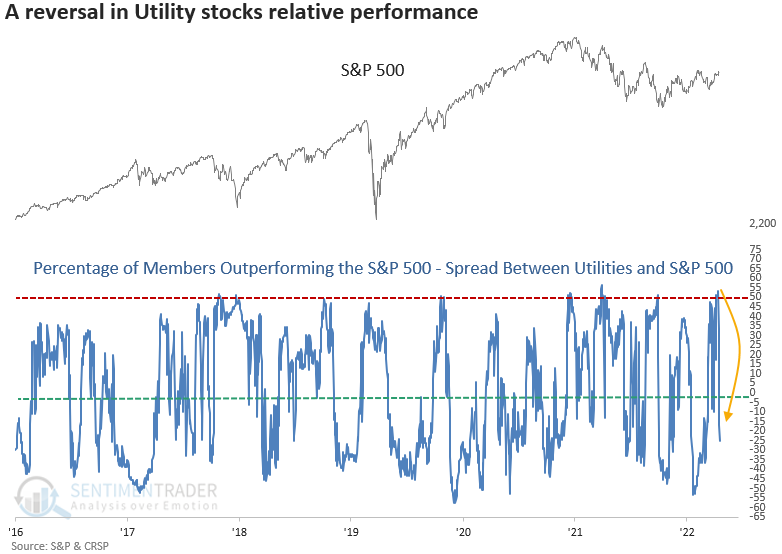
- Outperformance by defensive utility stocks surged and subsequently collapsed
- After similar reversals, the S&P 500 showed solid medium and long-term results
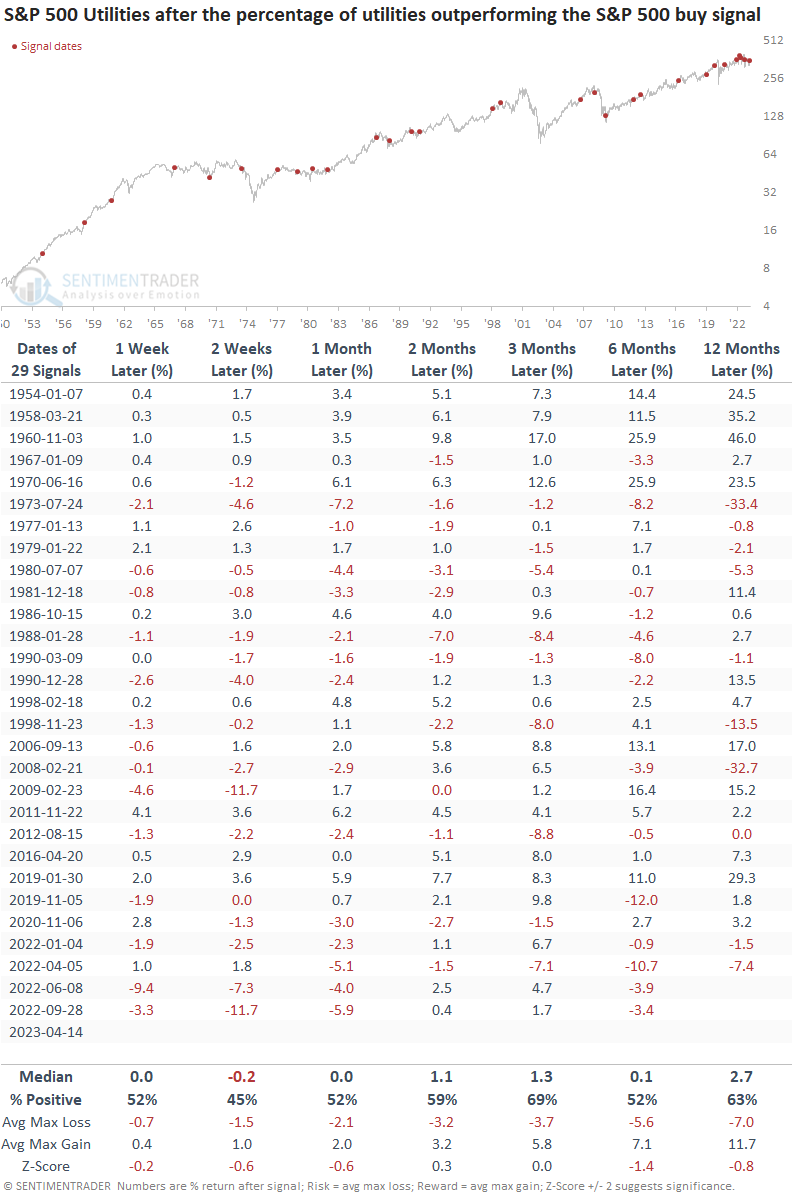
- The Utility sector struggled on an absolute and relative basis across all time frames
Utility stocks can be used to identify a reversal in market sentiment
During periods of market stress, utilities are one of the go-to sectors for investors as they seek a more defensive portfolio allocation to minimize drawdowns. When the fear subsides, market participants flee the relative safety of utilities for sectors with a more offensive tilt.
To capture this historical relationship, I created a trading signal that measures the spread between the percentage of S&P 500 Utility sector members outperforming the S&P 500 Index and the percentage of S&P 500 members outperforming the S&P 500 Index. Relative performance is calculated by comparing each member to the S&P 500 Index over a rolling 1-month period.
Last week, 90% of S&P 500 Utility sector members outperformed the S&P 500 Index over a rolling 1-month period. At the same time, fewer than 37% of S&P 500 members outperformed the Index, creating a spread of over 53% between the two series.
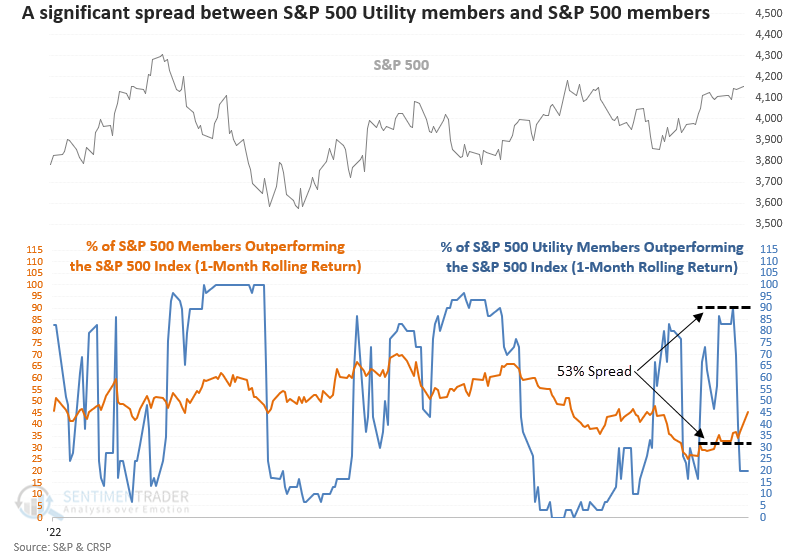
The trading signal identifies when the spread between S&P 500 Utility sector members and S&P 500 members increases above 48% and then declines below 0%, which occurred last Friday.
Similar reversals preceded solid results
The utilities spread signal generated an alert 29 other times over the last 70 years. After the others, the S&P 500 struggled over the next few weeks, which is unsurprising given a market in transition. Once the bottoming process is complete, the results look excellent on a medium and long-term basis.
Recent signals struggled, resembling the 1970s when the Federal Reserve was fighting high inflation.
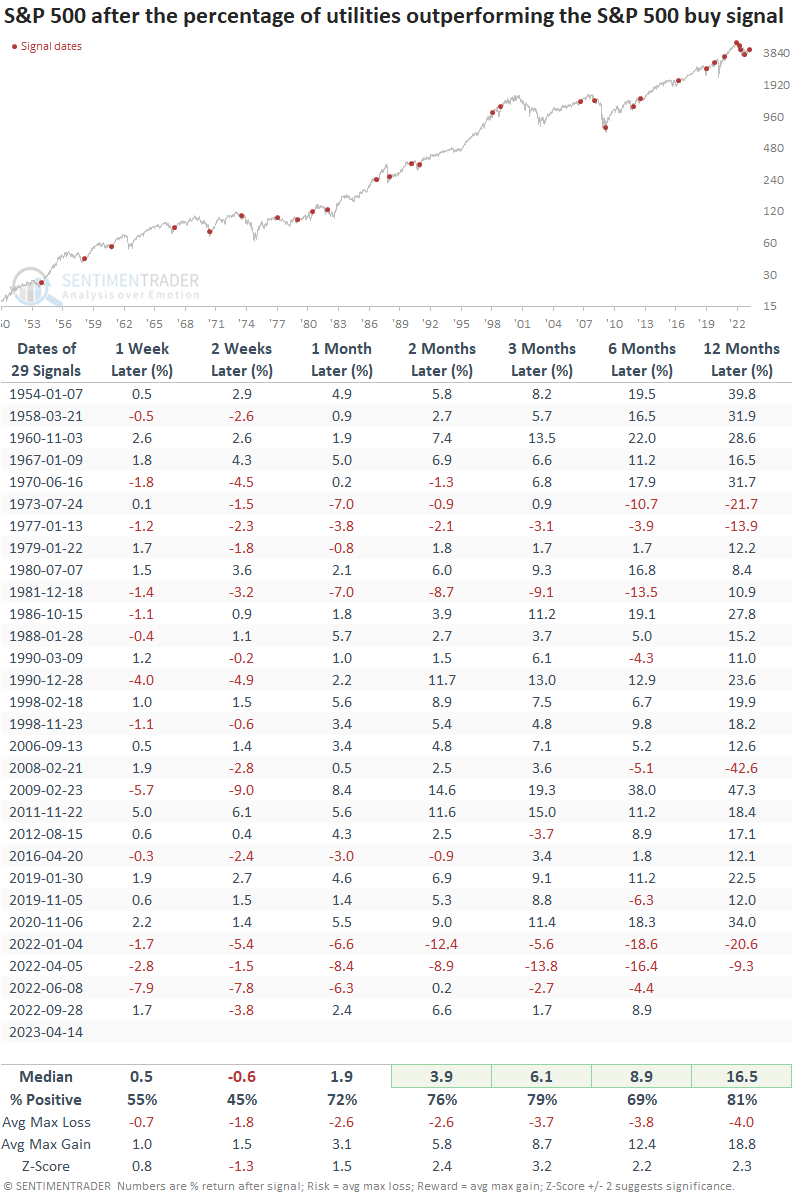
I see nothing that gets me excited about owning Utility stocks over any time frame. And if the signal turns out to be another whipsaw like the ones in 2022, the flight to safety trade worked on a relative basis, but one still lost money in most cases.
What the research tells us...
Investors recently flocked to the relative safety of Utility stocks, with over 90% of sector members outperforming the S&P 500 Index over a rolling 1-month period. At the same time, they abandoned most other stocks in the Large-Cap Index, creating a significant performance difference between the two groups. The flight to safety did not last long as the spread reversed downward, triggering a bullish buy signal for the broad market. After similar alerts, the S&P 500 showed excellent medium and long-term results, and the Utility sector struggled.