
The first S&P 500 new all-time high in more than a year

Key points
- The S&P 500 just closed at a new all-time high
- It was 512 trading days since the last all-time high
- Historically, new highs at least a year apart have typically seen the market follow through to the upside
A new all-time high for SPX - finally
As the chart below shows, the S&P 500 Index closed at an all-time high of 4,796.56 on 2022-01-03. It then went 512 trading days without making a new all-time high. That streak ended on 2024-01-19 at the far right when the S&P closed at 4,839.81.
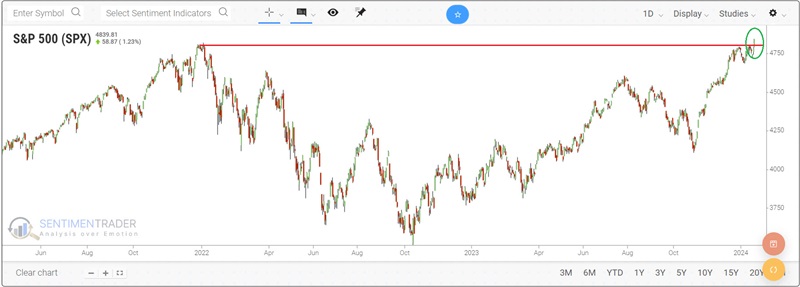
Is this the start of something big? Or is this a head fake to draw in more investors before the rug gets pulled out from under the market? Let's see what history suggests.
The first new all-time high in at least a year
The chart below shows how many trading days the S&P 500 has gone without making a new all-time high.
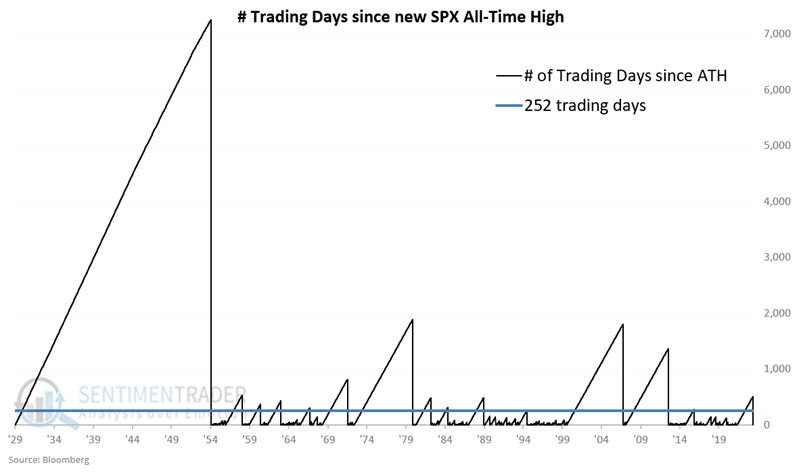
For our test, we will look at previous times when the number in the chart above exceeded 252 (roughly the number of trading days in a calendar year) and then dropped to 0 (i.e., a new all-time high was hit after a year or more of no new all-time highs).
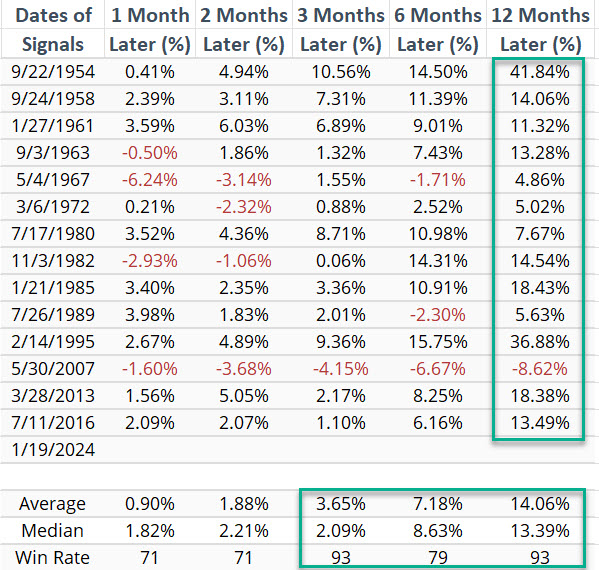
The table below displays the dates and subsequent S&P 500 performance following the 14 previous instances.
The chart below displays the hypothetical growth of $1 invested in the S&P 500 for one year after the dates shown in the table above.
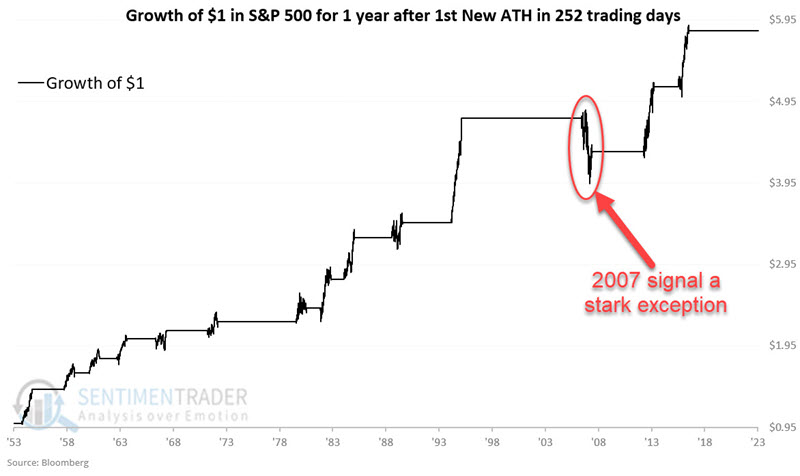
What the research tells us…
The S&P 500 just hit a new all-time high for the first time in over one year. Does this guarantee the market will head higher in the year ahead? No indicator ever ensures anything. Also, the May 2007 signal - which was followed by nominal new highs before the onset of one of the worst bear market declines of all time reminds us that despite a 93% Win Rate, nothing is ever certain. Nevertheless, the information above falls solidly on the favorable side of the weight of the evidence ledger and dovetails nicely with a host of other recent favorable indicator signals.