Products
SentimenTrader Trading Tools
‍
Backtest Engine
My Trading Toolkit
Correlation Analysis
Seasonality
Market Prediction
Indicators & Data API
‍
Proprietary Indicators & Charts
Market Data API
Strategies & Scanner
‍
50+ Trading Strategies
Smart Stock Scanner
Smart Option Scanner
Research Reports
‍
Research Solutions
Reports Library
Free Resources
Simple Backtest Calculator
Simple Seasonality Calculator
The Kelly Criterion Calculator
Sentiment Geo Map
Public Research Reports
Education
Sentiment Indicators
Technical Indicators
Pricing
Company
About
In the News
Testimonials
Client Success Stories
Contact
Log inLoginSign up
< BACK TO ALL REPORTS

The first Fed rate cut

Jason Goepfert
2024-09-17
The Fed is on track to cut rates for the first time after a long hiking cycle. Over the past 50 years, the first cut preceded mixed returns for stocks in general, with relatively better returns for defensive stocks like staples, utilities, and value. The dollar tended to struggle at first.

Key points:

  • The Federal Reserve is on track to change its interest rate trajectory after a long hiking cycle
  • Stocks showed mixed returns after nine other "first cuts"
  • Defensive sectors like staples and utilities tended to perform relatively well, as did value stocks

A new regime

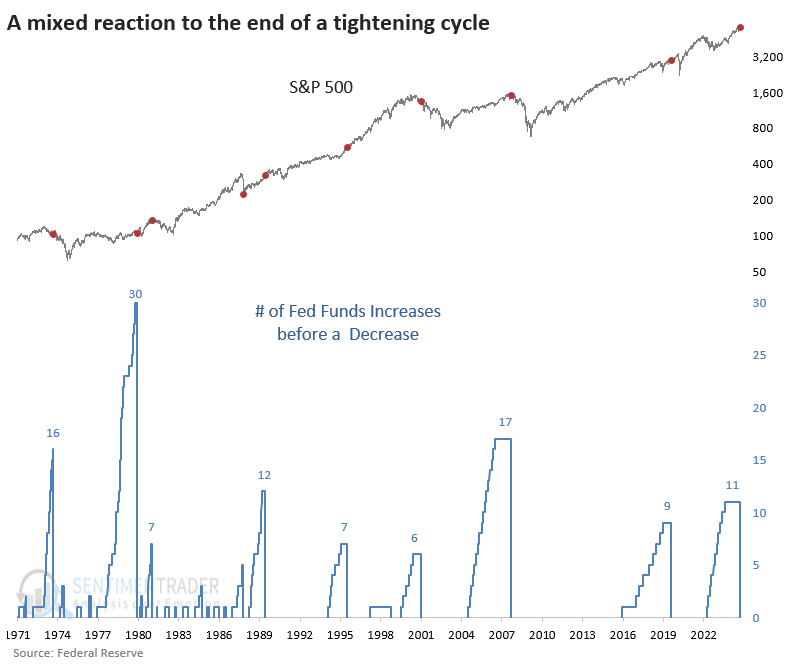
After the longest hiking cycle in a decade and a half, the Federal Open Market Committee is expected to reduce its Fed Funds target rate this week. It would mark the end of the 2nd-longest tightening cycle in 35 years.

Much ink has been spilled on the implications, and we won't wade into potential macroeconomic repercussions. We're also not going to participate in the delusion that we can know whether this cut will precede an economic recession, which can dramatically impact forward returns.

All we can know is what we know right now; the rest is conjecture. There is a place for that, and this ain't that place.

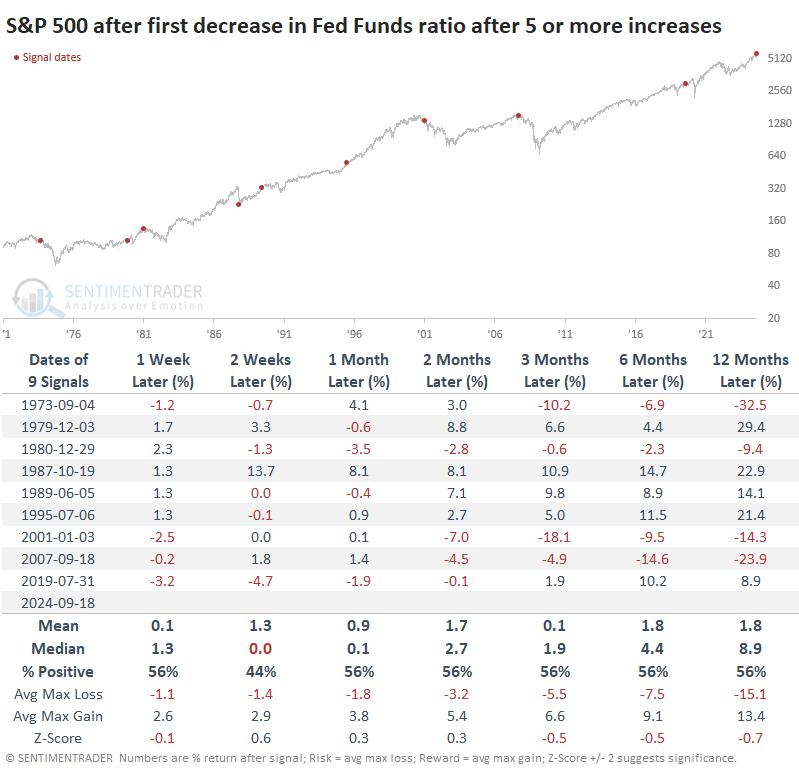
Assuming the Fed follows through on its promise, the implications for stocks are mixed. The last three cuts after a hiking cycle all preceded devastating bear markets. Before that, there was no real pattern. There was no discernable difference in returns based on how far the S&P 500 was from a multi-year high at the time of the first cut.

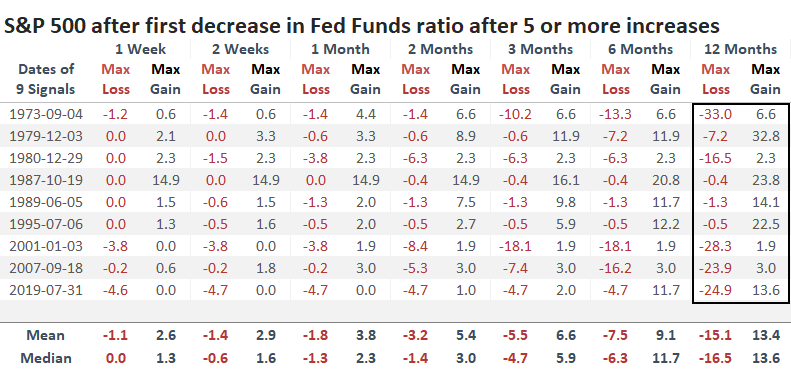
The table of maximum risk and reward across time frames shows a pretty binary result. Over the next year, stocks either enjoyed decent gains with low risk or limited gains with high risk. There wasn't any middle ground. A decent heuristic was watching the next two weeks - if risk exceeded reward, then it was a strong suggestion that the following year would be tough.

Bad for the dollar, good for value

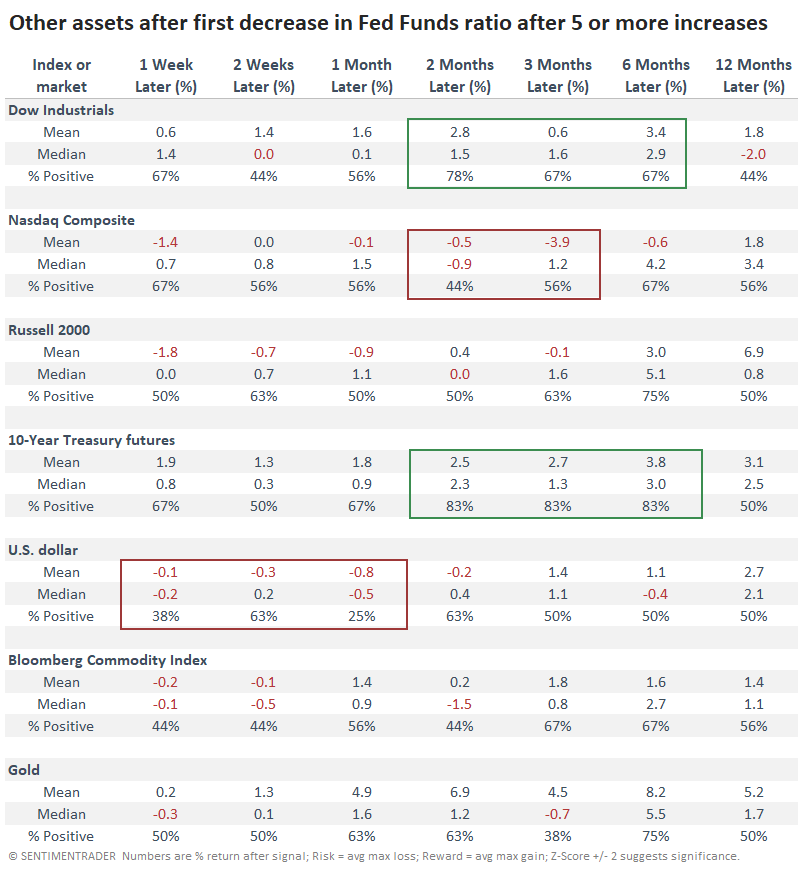
It was a mixed picture among other indices and assets, even among time frames. Generally, the Dow Industrials held up better than the S&P or, especially, the Nasdaq Composite and Russell 2000. The dollar tended to suffer in the immediate aftermath of the cut, but that didn't help gold or commodities too much. 10-year Treasury futures did well over the medium-term (suggesting yields declined).

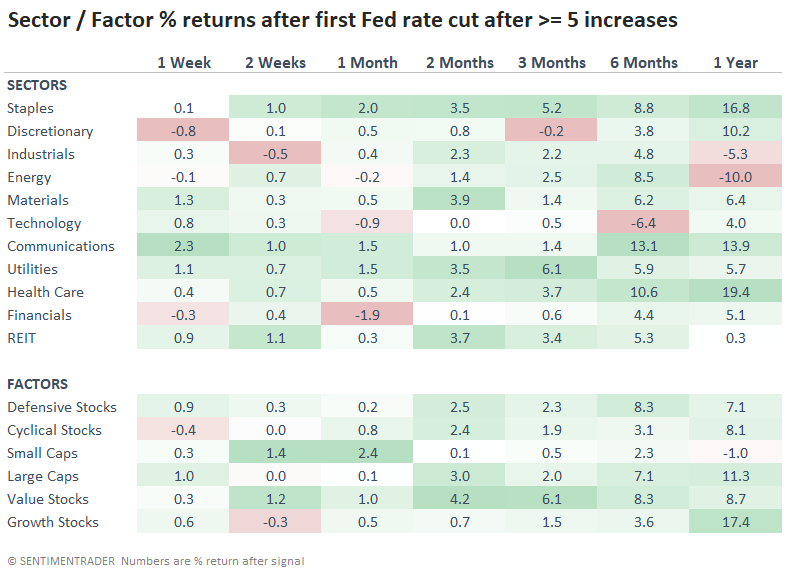
Among sectors and factors, the next three months showed a dramatic difference in the median return between staples (+5.2%) and discretionary stocks (-0.2%). Utilities and health care also enjoyed robust returns, with a definite tilt toward value (+6.1%) over growth (+1.5%). However, much of that edge either eased or reversed over longer time frames.

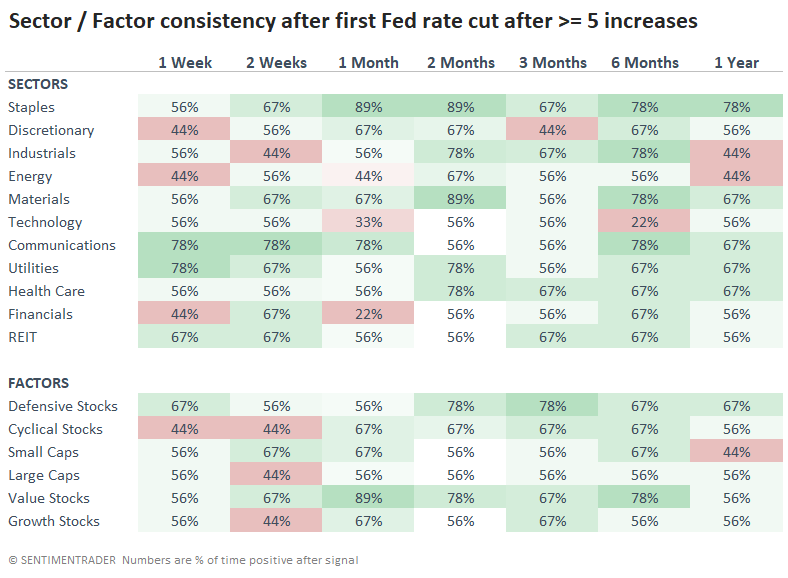
The win rates among sectors and factors showed a tilt toward defensive and value factors and sectors. Over the following three months, staples rose 67% of the time versus a 44% win rate for discretionary. 

What the research tells us...

Opinions aside, the imminent cut in the Fed Funds rate has been a crap shoot for investors. There was no consistent pattern in forward returns after significant hiking cycles. The last few have been major warning signs, while most of the others were not at all. They were more consistently negative for the dollar (for a while), tech stocks (ironically enough), while being good for Treasury notes and bonds, value stocks, and defensive sectors.

PRODUCTS
SentimenTrader
Trading Tools
Indicators & Data API
‍
Strategies & Scanner
‍
Research Reports
FREE
RESOUrCES
Simple Backtest
Calculator
Simple Seasonality
Calculator
The Kelly Criterion
Calculator
Sentiment Geo Map
‍
Public Research Reports
‍
Education
Sentiment Indicators
‍
Technical Indicators
‍
Pricing
Bundle pricing
‍
FAQ
‍
Announcements
‍
COMPANY
‍
About
‍
In the News
‍
Testimonials
‍
Client Success Stories
CONTACT
‍
General Inquiries
‍
Media Inquiries
‍
Financial Professionals Inquiries
‍
© 2026 Sundial Capital Research Inc. All rights reserved.
Setsail Marketing
TermsPrivacyAffiliate Program
Risk Disclosure: The information and tools provided are for research and analytical purposes only and are not intended as investment advice. Market analysis involves uncertainty, and outcomes may differ from expectations. Users should conduct their own due diligence and consider their individual circumstances before making any financial decisions. Past performance is not necessarily indicative of future results.

Hypothetical Performance Disclosure: Hypothetical performance results have many inherent limitations, some of which are described below. No representation is being made that any account will or is likely to achieve profits or losses similar to those shown; in fact, there are frequently sharp differences between hypothetical performance results and the actual results subsequently achieved by any particular trading program. One of the limitations of hypothetical performance results is that they are generally prepared with the benefit of hindsight. In addition, hypothetical trading does not involve financial risk, and no hypothetical trading record can completely account for the impact of financial risk of actual trading. for example, the ability to withstand losses or to adhere to a particular trading program in spite of trading losses are material points which can also adversely affect actual trading results. There are numerous other factors related to the markets in general or to the implementation of any specific trading program which cannot be fully accounted for in the preparation of hypothetical performance results and all which can adversely affect trading results.

Testimonial Disclosure: Testimonials appearing on this website may not be representative of other clients or customers and is not a guarantee of future performance or success.