
The Financials Sector is at a Crossroads

Key points
- Financial stocks have been in an uptrend for almost two years
- At the same time, the sector is essentially unchanged over the last eight months and flirting again with its long-term moving average
- On the favorable side, the Copper/Gold Ratio remains a little-known favorable influence, and breadth may be signaling that a potential opportunity is forming
The primary trend for Financial remains favorable - for now
The good news is that using basic trend-following methods, the Financials sector remains in an established uptrend. The chart below shows that the SPDR Financials Sector ETF (XLF) remains above its 200-day moving average. Except for a brief period during the April 2025 Tariff Tantrum, XLF has traded above its 200-day average since November 2023.
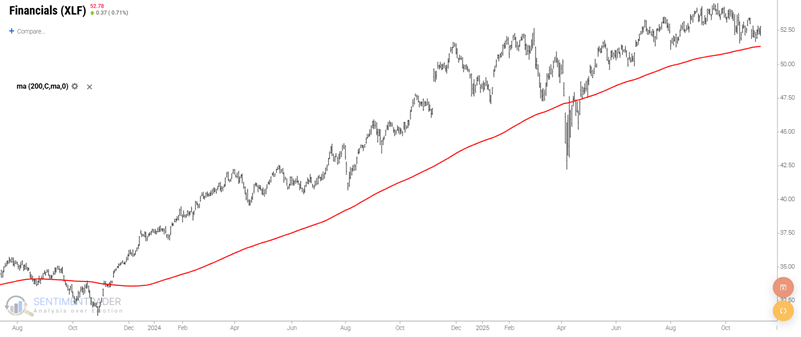
The bad news is that no trend lasts forever, and some argue that the advance in financials is getting a little long in the tooth. Another troubling sign is that financials have made no new ground since March. Luckily, several indicators suggest that financial stocks could reassert themselves in the year ahead. As long as the Financial Sector SPDR Fund ETF (XLF) holds above its 200-day moving average, investors and traders should give this sector the benefit of the doubt.
The Copper/Gold Ratio remains low
Some may question any relationship between the status of the Copper/Gold Ratio and the Financial sector. Still, financial sector returns following low Copper/Gold Ratio readings have been extremely robust. The chart below displays all dates when the Copper/Gold Ratio was below 0.20, with XLF as the index in the top clip.
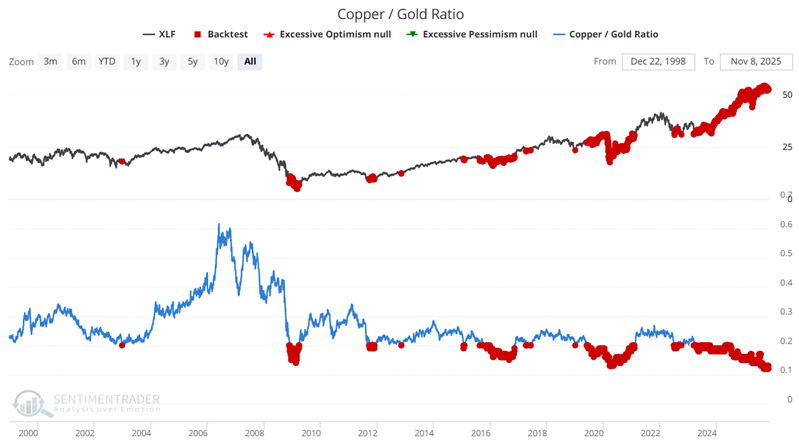
This should not be considered a standalone trading model for financial stocks. Still, except for some choppy action in 2016 and the 2020 Covid-related selloff, gains in the Financials sector following low Copper/Gold Ratio readings have been notable. A 1-year Median Return in excess of 27% suggests giving the bullish case the benefit of the doubt.
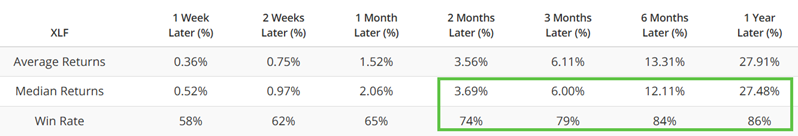
The Copper/Gold Ratio remains extremely low at 0.124. While there are no guarantees, an 86% 1-year win rate suggests the potential for higher prices in the year ahead for financial stocks.
Financials sector breadth may already be washed out
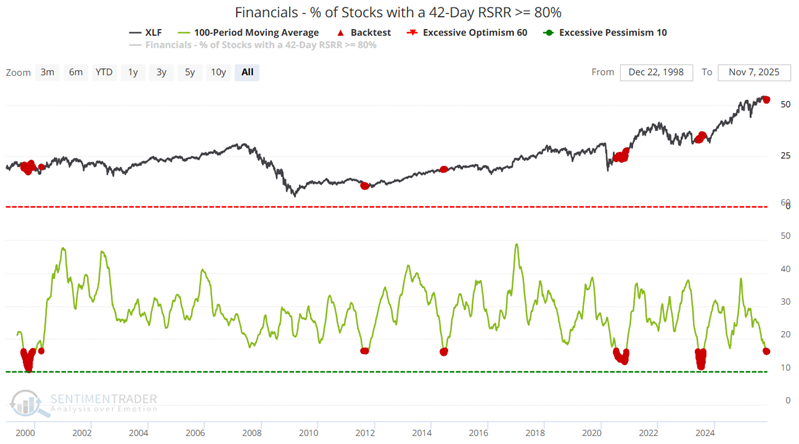
The Financials - % of Stocks with a 42-Day RSRR >= 80% indicator is a breadth figure that measures the participation among stocks within the S&P 500 Financials sector index. Specifically, this indicator shows the percentage of stocks in the Financials index whose 42-day Relative Strength Ratio (RSR) Rank is currently at or above 80%. The RSR measures a stock's performance relative to the S&P 500, and the Rank indicates where the current RSR value falls within its historical range over the lookback period.
It can be helpful to monitor extremes in the breadth figures. When many components of an index exhibit strong or weak relative performance, we can often observe a counter-trend move in the index in the days, weeks, or months following the extreme reading.
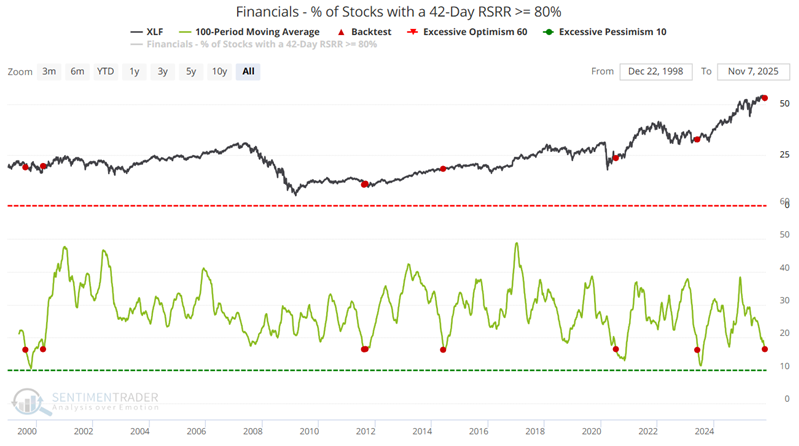
This indicator can be used in different ways. For the tests below, we will use a 100-day moving average of the Financials - % of Stocks with a 42-day RSRR of 80% or greater indicator. For the first test, the chart below highlights all days when the 100-day average is below 16.5 (this implies that financial stocks have been underperforming the broader market over the last several months). The moving average has been below 16.5 every day since October 28th.
The table below summarizes XLF performance following all highlighted dates, including overlaps.
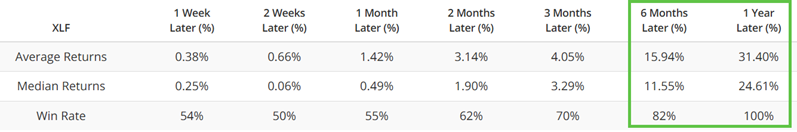
It is important to emphasize that the 100% 1-Year Win Rate and 24.6% 1-Year Median Return do not guarantee higher financial stock prices between now and November of next year. However, they do suggest favoring the bullish case until a solid reason is given not to.
While we do not recommend using this indicator as a standalone trading model for financial stocks, it can be instructive to examine what would have happened if we did.
The first drop into washed-out territory
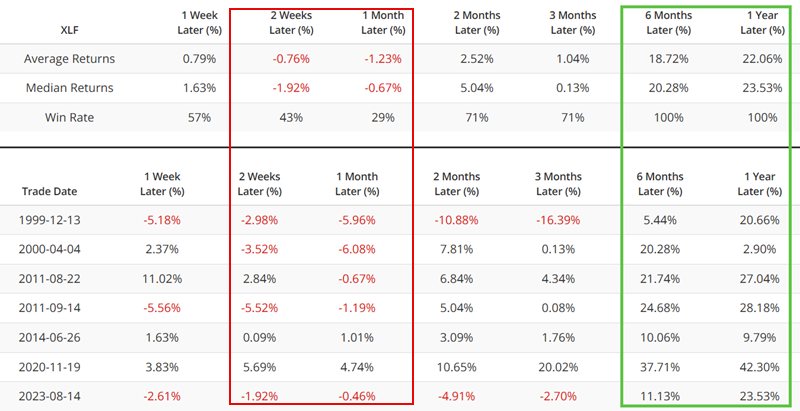
One approach is to examine XLF performance after the indicator above first dropped below 16.5. The chart below only highlights dates when the 100-day moving average dropped from above 16.5 to below 16.5. The most recent signal occurred on October 28th.
The table below summarizes the subsequent performance of XLF.
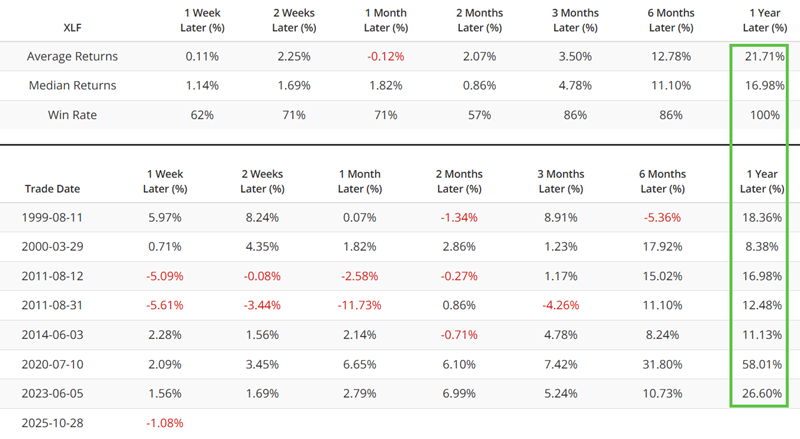
The risk associated with this hypothetical approach is that of being "too early." This could occur in the event of an extreme bear market in financial stocks, where the sector experiences a waterfall-type decline.
The first rise out of washed-out territory
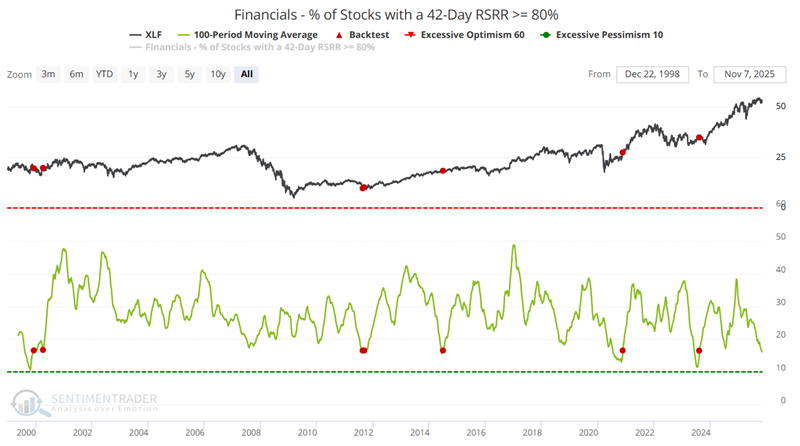
Now let's consider the idea of waiting (most likely, impatiently) for the 100-day average to rise back above 16.5 before generating a signal. The chart below only highlights dates when the 100-day moving average crossed above 16.5 after dipping below that level for at least one day. With the 100-day average presently at 16.21, the next signal will occur whenever it crosses back above 16.5.
The table below summarizes the subsequent performance of XLF. Note that weakness in the first month after a signal has been common. However, the six- and twelve-month results are compelling.
Subsequent 6-month and 1-year results are compelling. With the moving average currently 16,5, it is unclear how long it will take before it crosses back above 16.5. The results shown above suggest it might be worth looking out for, by running this test and clicking "Save to Favorites."
What the research tells us…
Financial stocks have been in an uptrend for almost two years, but have lost upside momentum over the last eight months. The open question at the moment is whether financials will reassert themselves to the upside or if a break below the 200-day moving average is imminent. As always, we cannot predict. However, as long as price action does hold up, the current oversold nature of financial sector breadth, combined with a favorable Copper/Gold Ratio, suggests giving the favorable case the benefit of the doubt.