
The fear gauge triggered a buy signal for stocks

Key points:
- A swing trading system based on the CBOE Volatility Index (VIX) triggered a new buy signal
- Comparable reversals in volatility produced excellent returns when the S&P 500 was above its 200-day moving average
- Cyclical-oriented sectors outperformed, and the QQQ confirmed the bullish outlook with solid returns
Expected volatility reversed to the downside, suggesting fear is subsiding
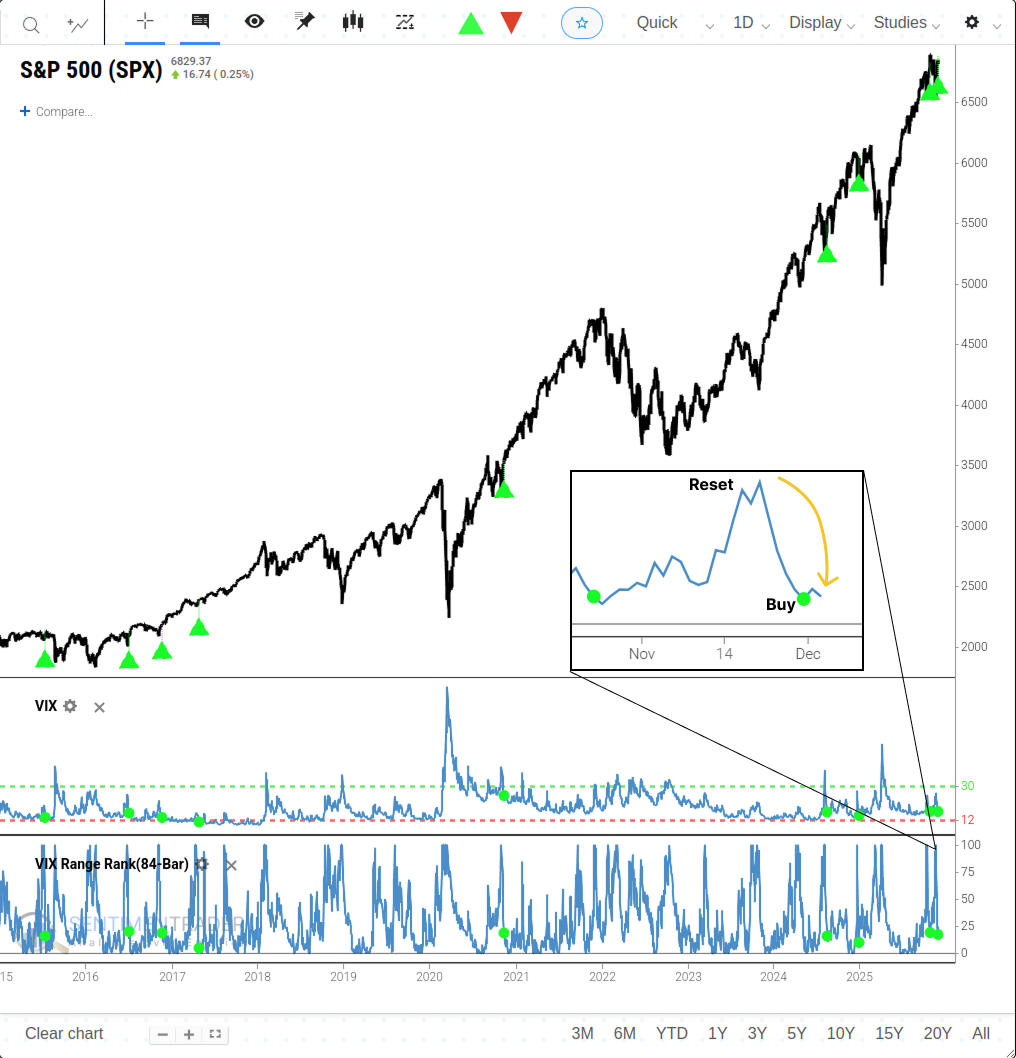
The CBOE calculates a volatility index for the S&P 500, commonly known as the VIX or fear gauge. It measures market expectations of near-term volatility (1 month) conveyed by index option prices. The VIX rises when investors are uncertain or fearful about a market's direction. Conversely, when apprehension subsides, volatility reverts lower.
Following a significant surge in the VIX, a swing trading system triggered a new alert when the volatility index's 84-day range rank reversed lower after rising to the top end of its range. For related backtest, click here.
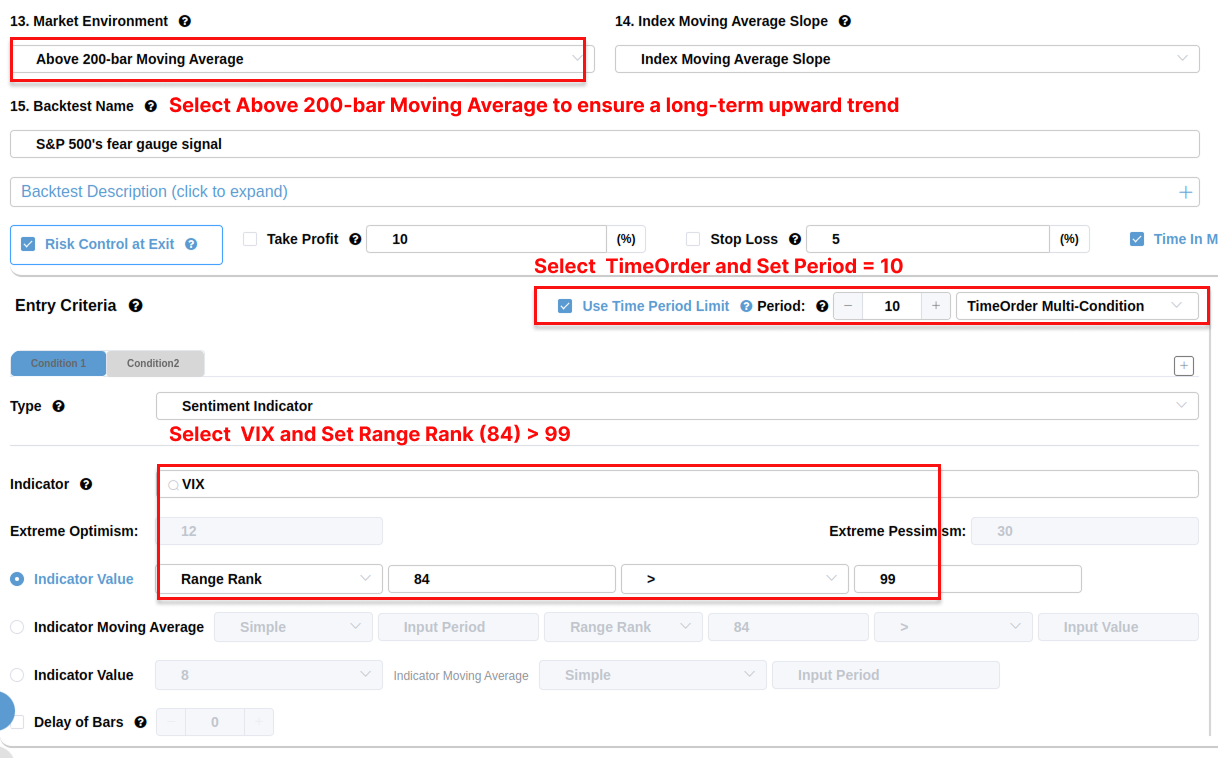
For users unfamiliar with BacktestEdge, you can also follow these steps to create the corresponding backtest. For more ways to use Backtestedge, click here.
Similar reversals in expected volatility preceded a bullish outlook for stocks
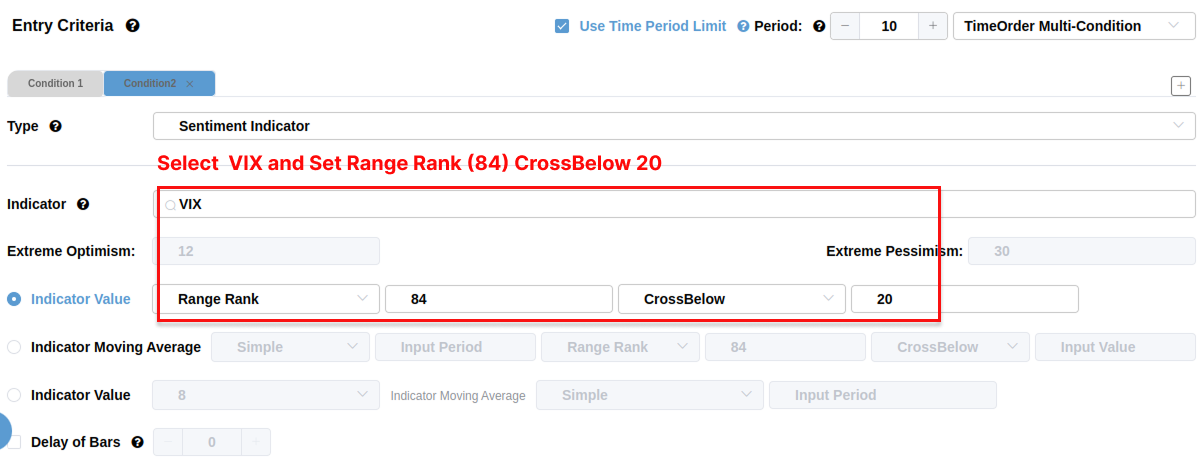
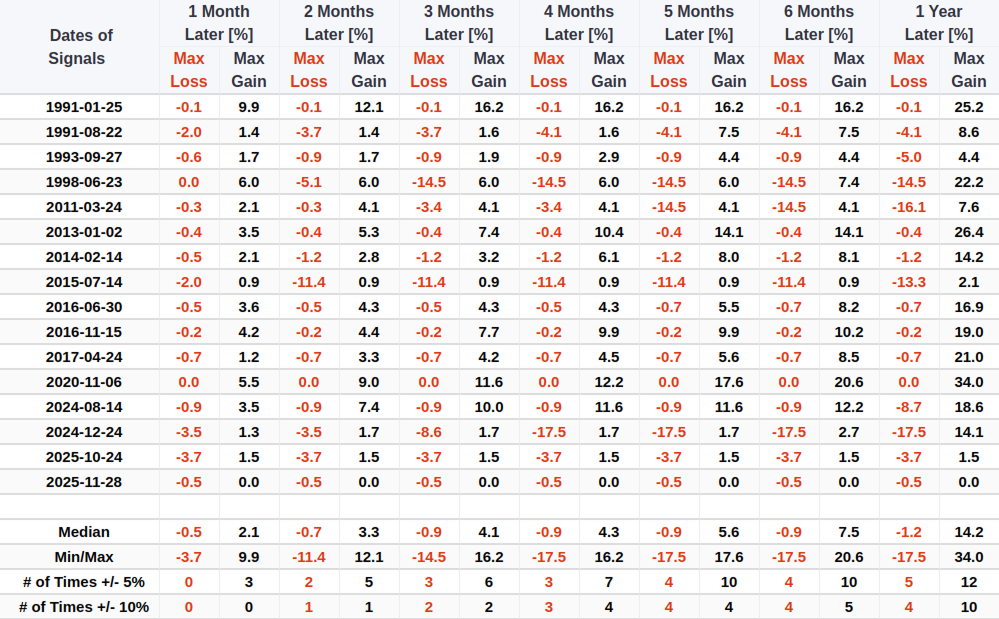
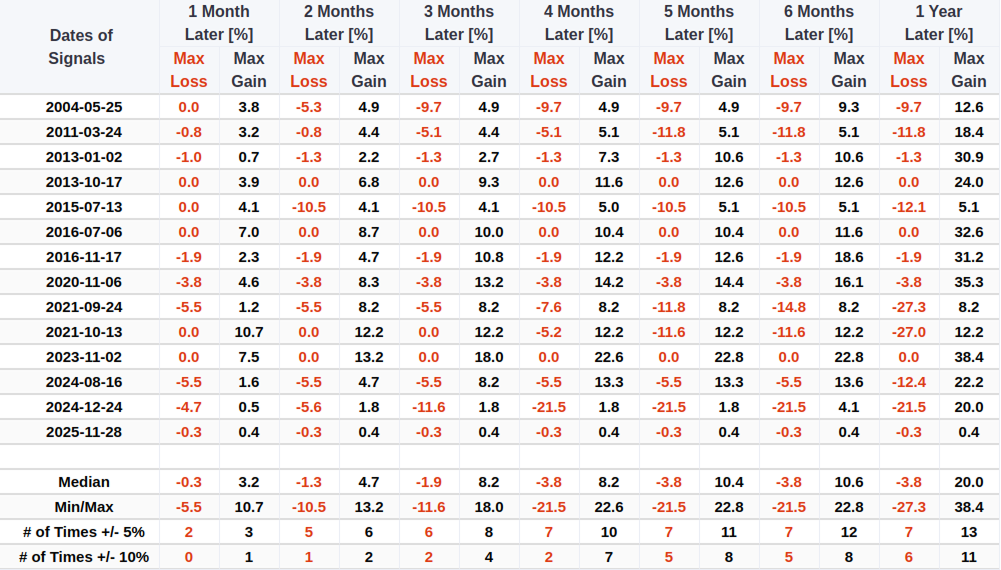
Whenever the S&P 500 Volatility Index's 84-day range rank cycled from above 99% to less than 20%, with the S&P 500 above its 200-day average, the world's most benchmarked index displayed excellent returns and consistency.
This trend filter is crucial: it ensures that we are buying into a dip within a primary uptrend rather than catching a falling knife in a bear market. As shown in the table below, the S&P 500 was higher 92% of the time one year later, with a median return of 15.5%. Even over a shorter one-month horizon, the index showed an 80% win rate.
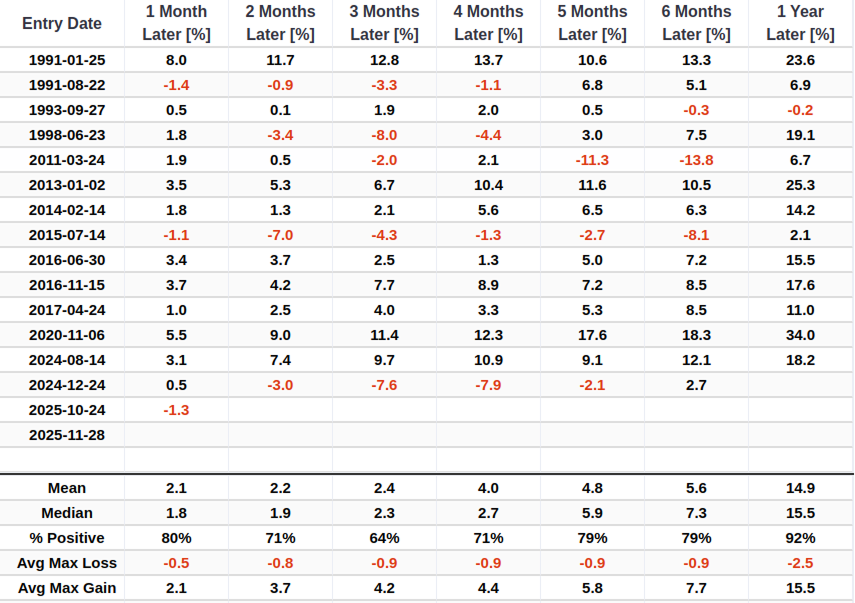
The median maximum loss over the first month was just -0.5%. This suggests that once these signals trigger within a long-term uptrend, the downside risk is well-contained.
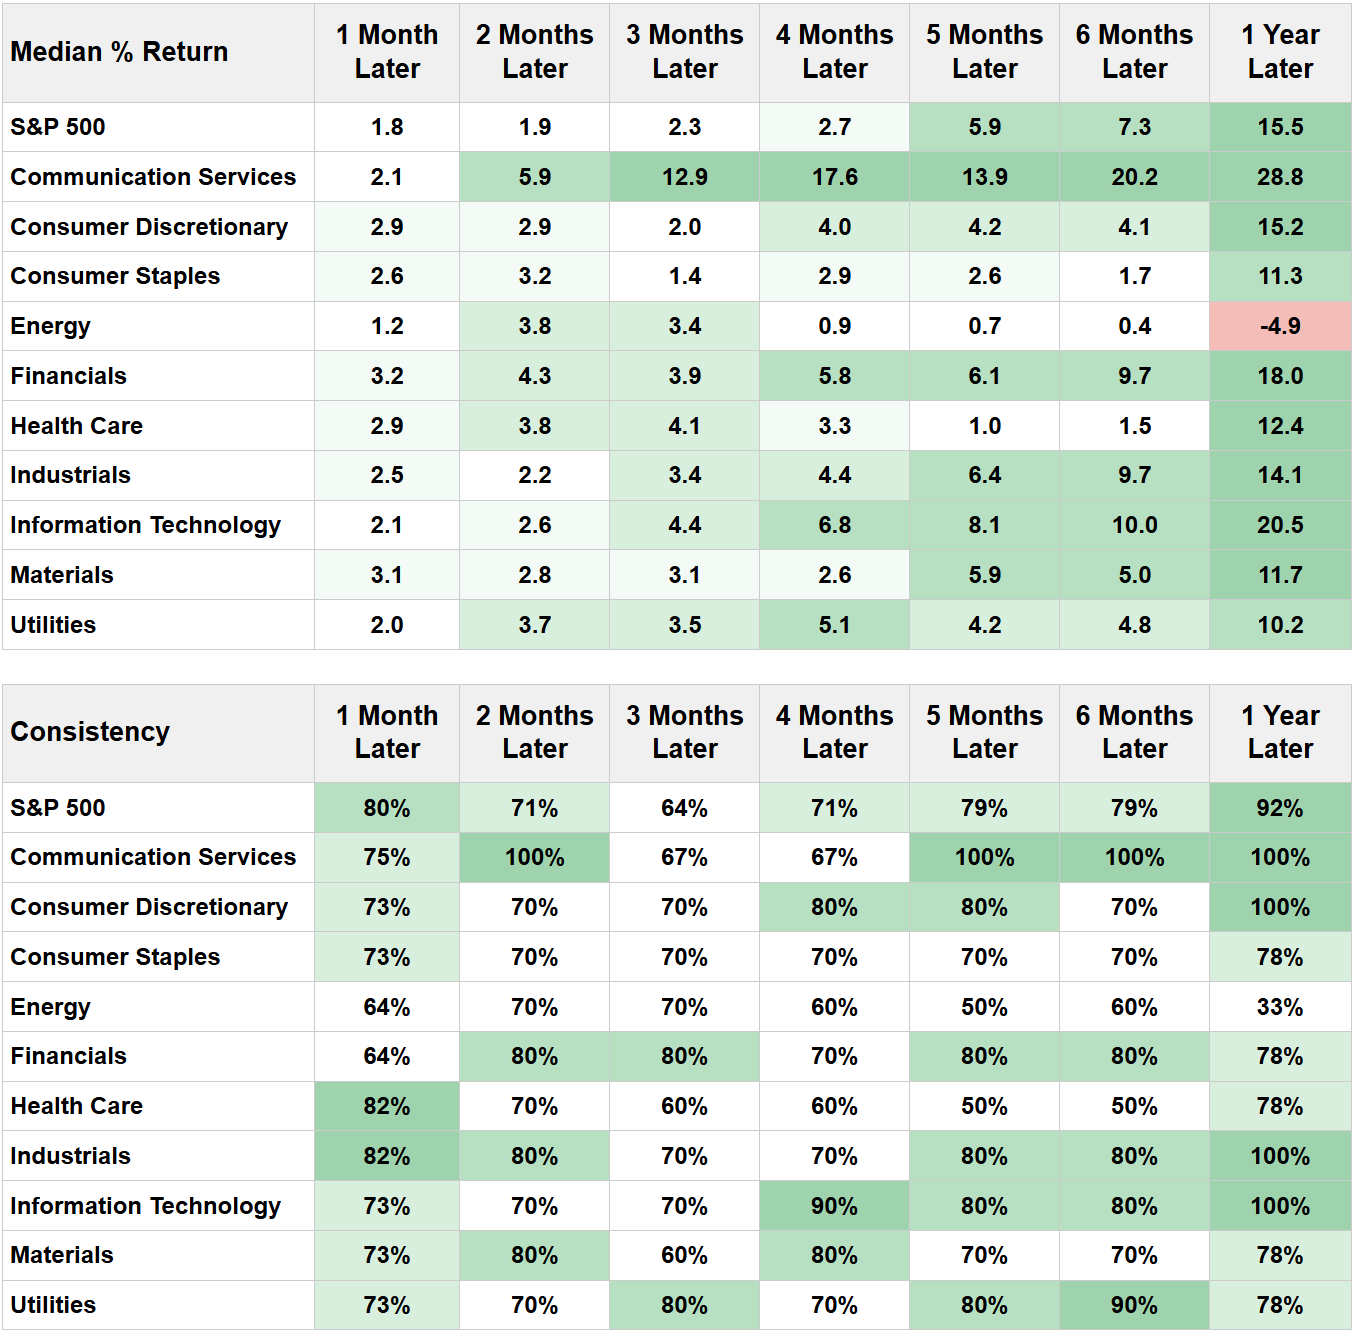
Most cyclical-oriented sectors outperformed defensive groups over the subsequent year.
QQQ triggers a similar signal
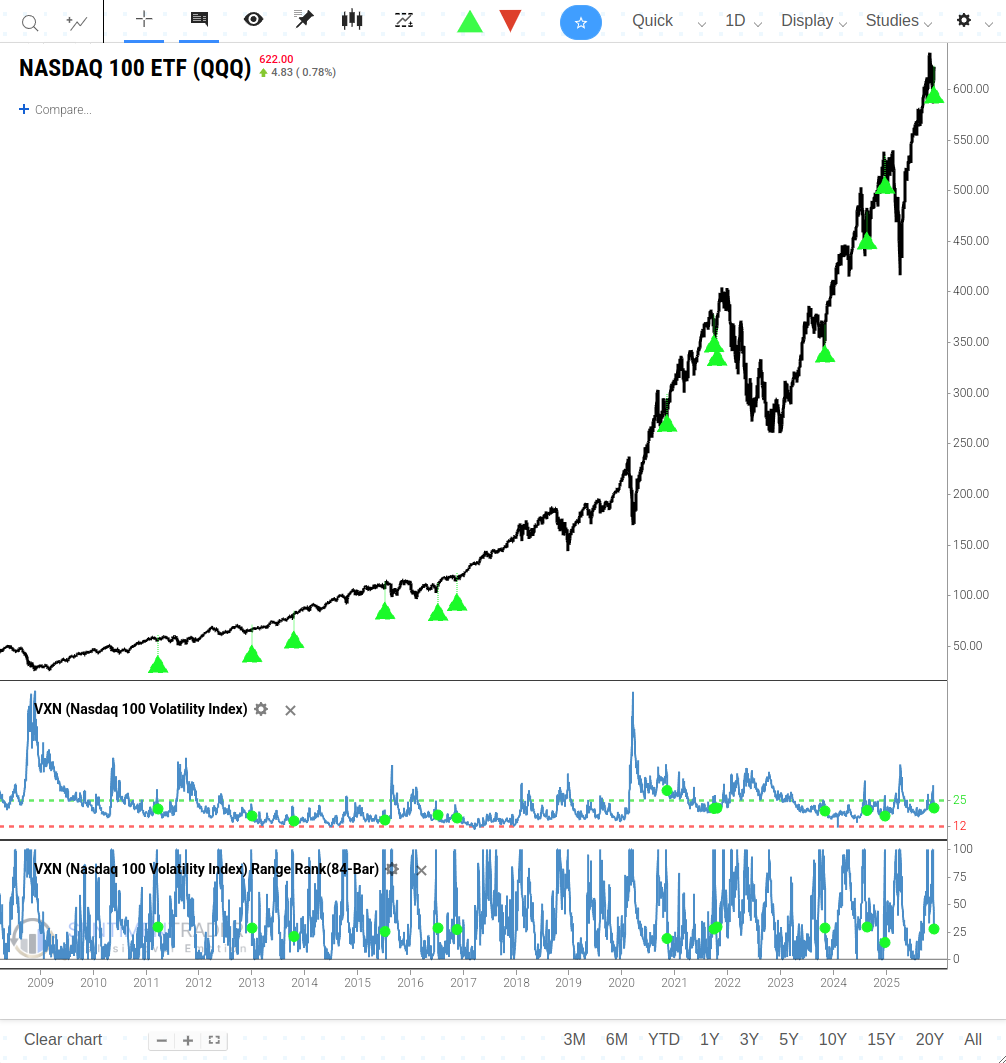
The volatility reset was not limited to the broad market. The NASDAQ 100 Volatility Index (VXN) also triggered a comparable signal. Specifically, the VXN 84-day range rank dropped from above 99% to less than 30% in 10 sessions, while the QQQ held firm above its own 200-day moving average. For related backtest, click here.
Performance following the QQQ signal is equally compelling.
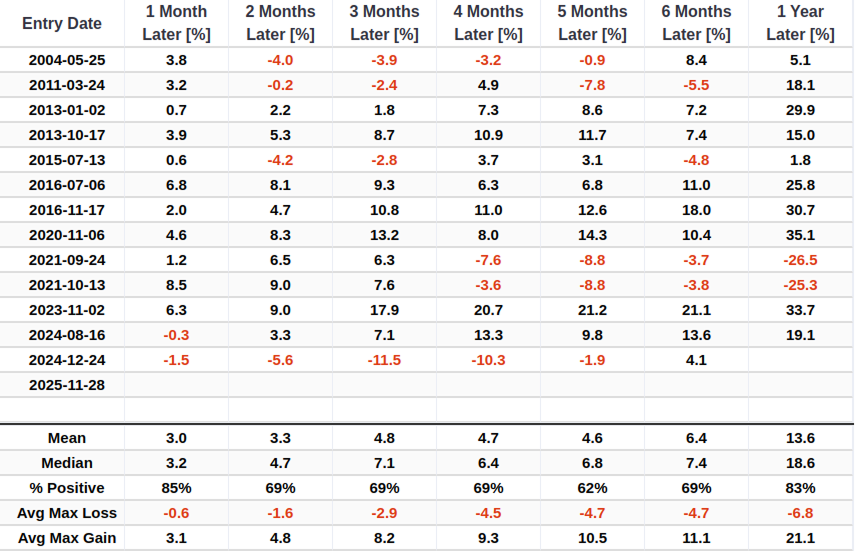
Risk management data for the QQQ also paints a constructive picture.
What the research tells us...
The fear gauge exploded higher as traders hit the panic button. As is generally the case, once cooler heads prevail, expected volatility reverses to the downside as the need to hedge via options diminishes. A swing trading system that captures these sentiment shifts triggered buy signals for both the S&P 500 and QQQ. Comparable reversals in volatility, specifically when the major indices are in long-term uptrends (above the 200-day average), produced outstanding returns and consistency.