
The fear gauge shifted lower, triggering a buy signal for stocks

Key points:
- A swing trading system based on the CBOE Volatility Index (VIX) triggered a bullish alert
- Volatility reversals in an uptrend yielded solid returns and consistency for the S&P 500 over all time frames
A drop in expected volatility typically precedes a bearish-to-bullish trend reversal in equities
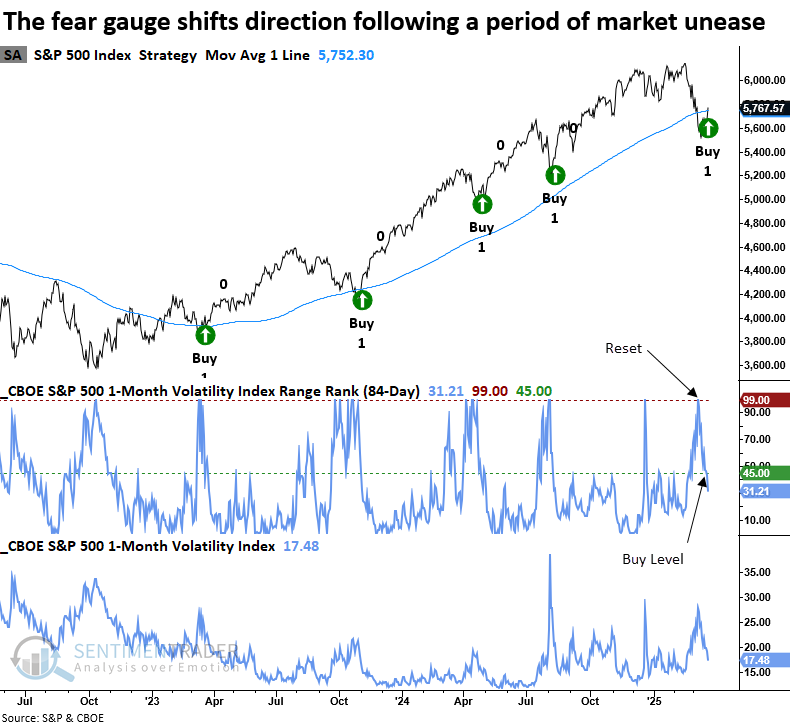
The CBOE calculates a volatility index for the S&P 500, commonly known as the VIX or fear gauge. It measures market expectations of near-term volatility (1 month) conveyed by index option prices. The VIX rises when investors are uncertain or fearful about a market's direction. Conversely, when apprehension subsides, volatility reverts to lower levels.
Following a surge in the VIX, a swing trading system triggered a new signal when the volatility index's 84-day range rank reversed lower after rising to the top end of its range.
The previous alert occurred in August 2024, leading to an 8.2% gain in the S&P 500 over the subsequent two months.
Comparable volatility reversals have been a precursor to a bullish outlook for stocks
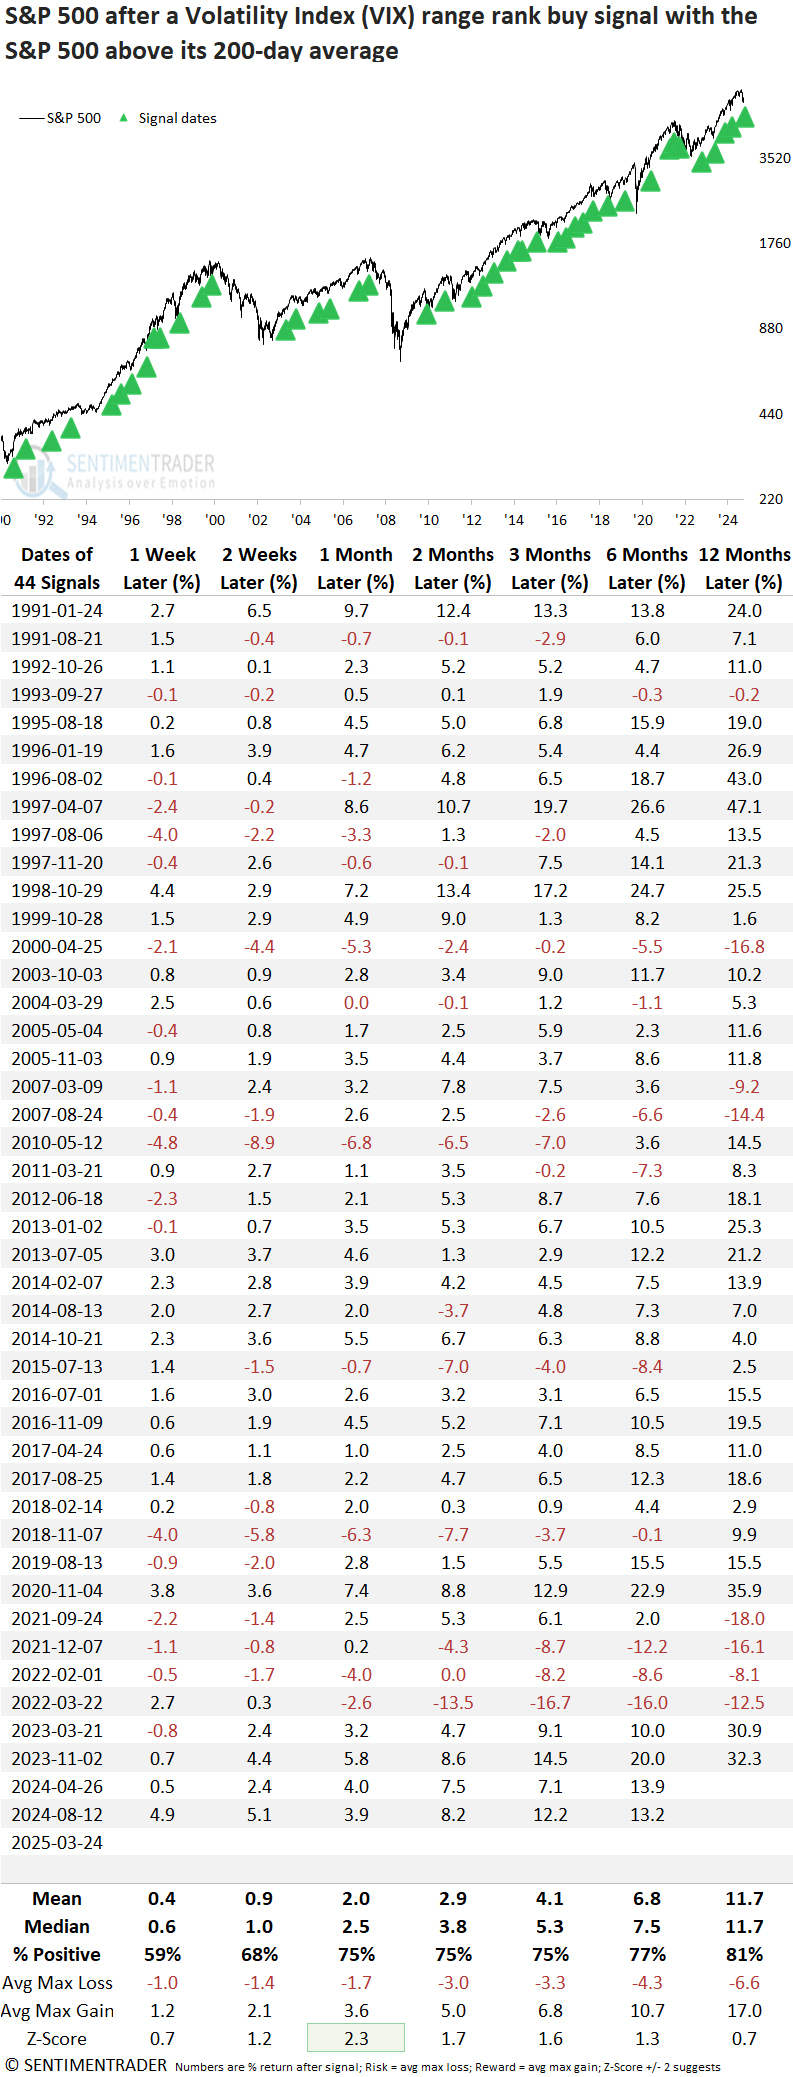
Whenever the S&P 500 Volatility Index's 84-day range rank cycled from above 99% to less than 45%, with the S&P 500 above its 200-day average and exhibiting positive price momentum, the world's most benchmarked index displayed excellent returns and consistency over short, medium, and long-term horizons.
The one-month horizon showed notable strength, advancing 75% of the time and demonstrating statistical significance compared to random returns.
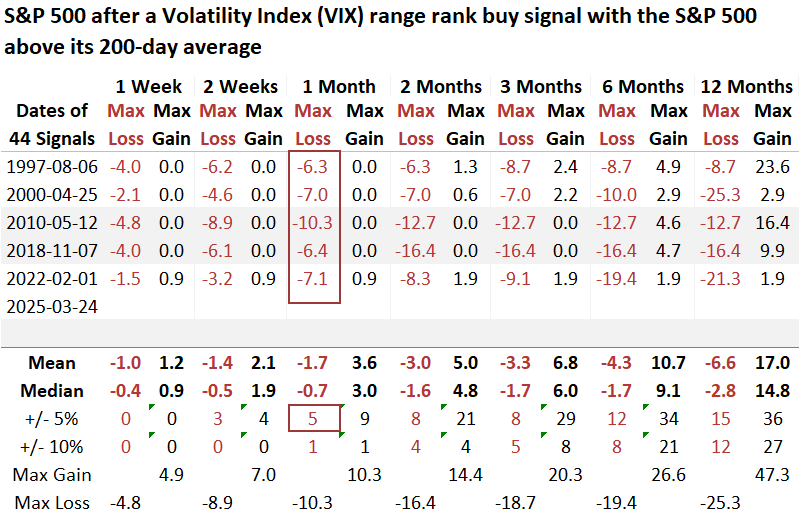
Over the favorable one-month period, the S&P 500 experienced a maximum loss exceeding 5% in five instances (11% of cases), reinforcing that once volatility subsides in an uptrend, the likelihood of a significant near-term drawdown decreases.
Other volatility indexes
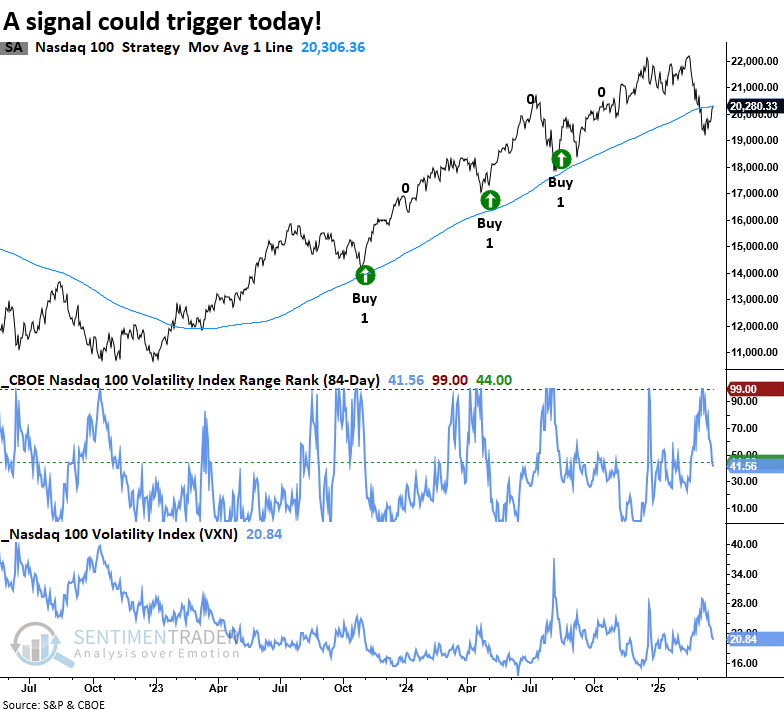
With the Nasdaq 100 Volatility Index (VXN) reversing lower, the 84-day range rank has dropped beneath the buy signal threshold on an intraday basis. If this trend holds through the close, the Nasdaq 100 will trigger an alert.
Update on bounce scenario
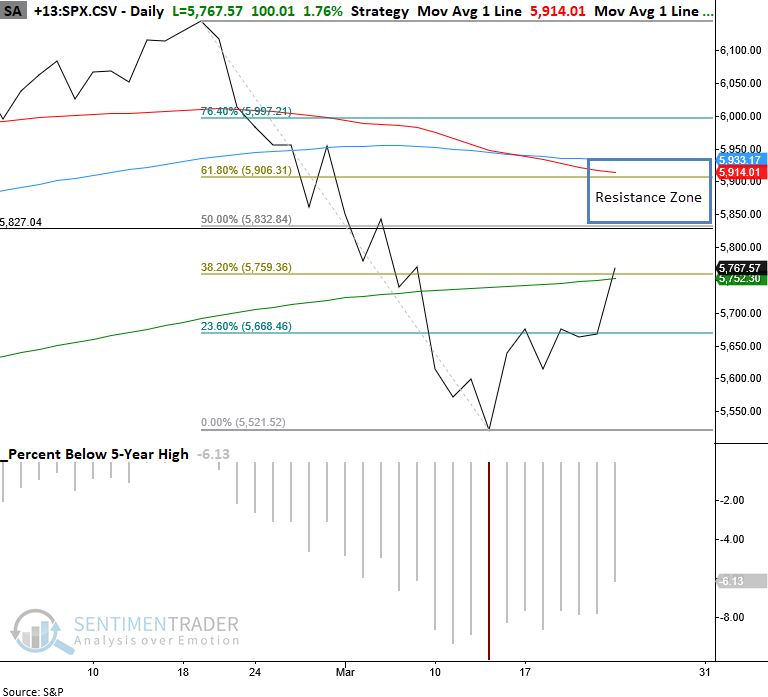
As discussed in my report, "The S&P 500 formed a two-day bullish reversal pattern," a relief rally seemed probable. With the world's most benchmarked index reclaiming the 200-day average, a resistance zone between 5830 and 5930 is now in focus.
What the research tells us...
The fear gauge shot higher as traders grew uneasy over policy uncertainty, concerned about the potential economic fallout from multiple factors. As is generally the case, once cooler heads prevailed, expected volatility reversed to the downside as the need to hedge via options diminished. This shift is even more intriguing because a tariff deadline awaits on April 2nd, which is only six trading sessions from today. If traders were concerned, wouldn't volatility remain elevated? Instead, it has fallen in 8 of the last 10 sessions. Maybe the market has already discounted the event. While making an educated guess as to why a market acts a certain way is always fun, it's best to leave the narratives at the door and follow the signal.
A swing trading system that captures volatility shifts triggered a new buy signal. Comparable reversals, with the S&P 500 in a long-term uptrend, produced outstanding returns and consistency for the world's most benchmarked index over short, medium, and long-term horizons.