Products
SentimenTrader Trading Tools
‍
Backtest Engine
My Trading Toolkit
Correlation Analysis
Seasonality
Indicators & Data API
‍
Proprietary Indicators & Charts
Market Data API
Strategies & Scanner
‍
50+ Trading Strategies
Smart Stock Scanner
Research Reports
‍
Research Solutions
Reports Library
Free Resources
Simple Backtest Calculator
Simple Seasonality Calculator
The Kelly Criterion Calculator
Sentiment Geo Map
Public Research Reports
Pricing
Company
About
In the News
Testimonials
Client Success Stories
Contact
Log inLoginSign up
< BACK TO ALL REPORTS

The FAANMG rally

Troy Bombardia
2020-07-14
The U.S. stock market's rally has been driven by FAANMG. Could the tech-led rally be running out of steam?

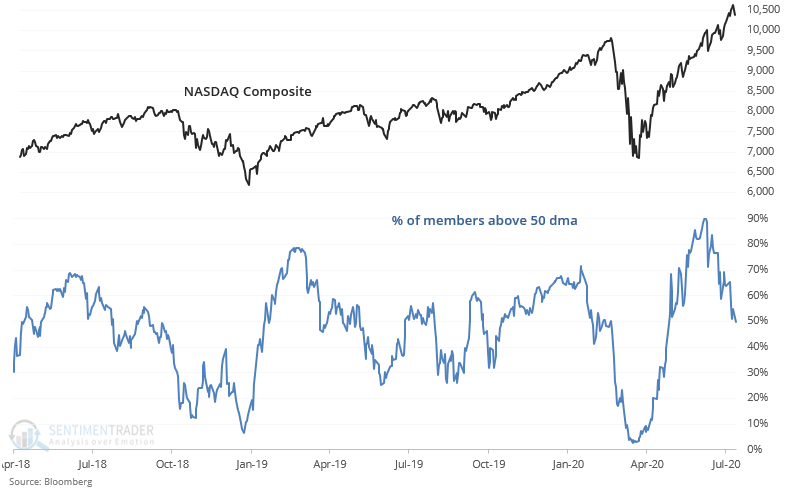
The U.S. stock market's rally over the last few weeks was led by tech stocks, and on the surface it looks like this rally could be running out of steam. As Liz Ann Sonders noted, the % of NASDAQ Composite members above their 50 dma fell below 50%, signalling a loss of these stocks' medium term moving averages.

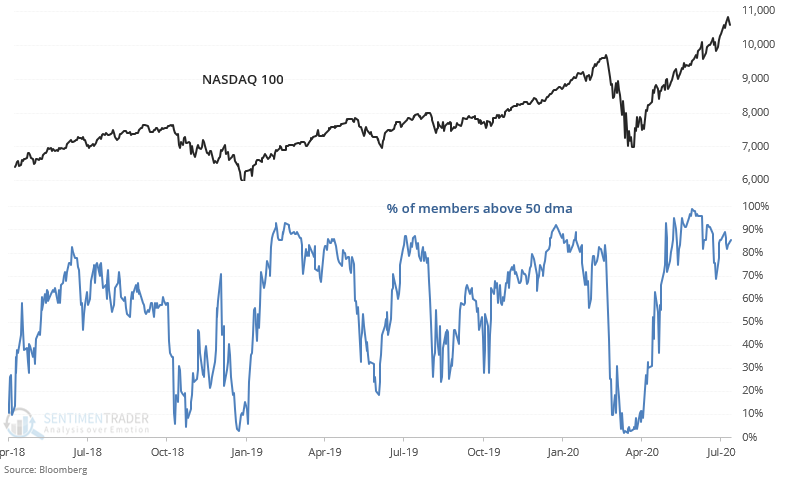
But a look at the NASDAQ 100 demonstrates that it's mostly smaller stocks that are slipping. More than 80% of the NASDAQ 100's members are still above their 50 dma:

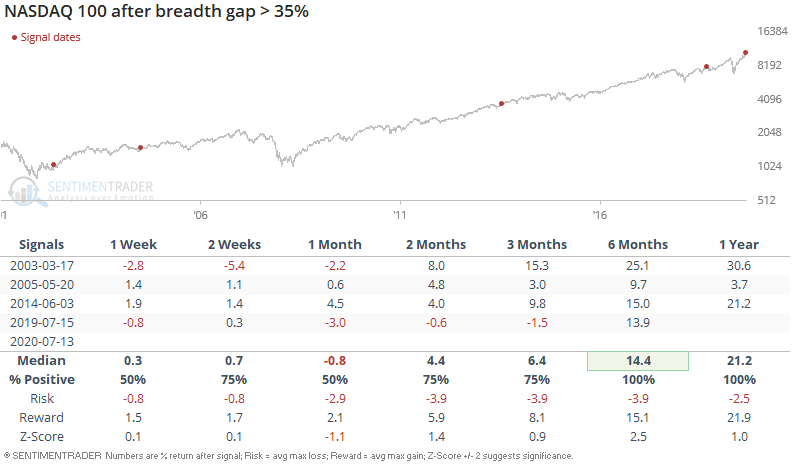
This pushed the difference in % of NASDAQ 100 members above their 50 dma - the % of NASDAQ Composite members above their 50 dma to the highest level in years. Could this be a worrisome sign?

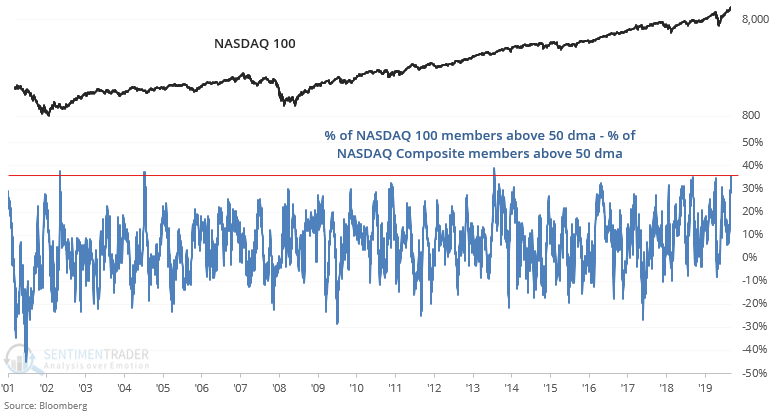
Such strong breadth divergences sometimes led to short term pullbacks, but long term this was bullish for the NASDAQ 100:

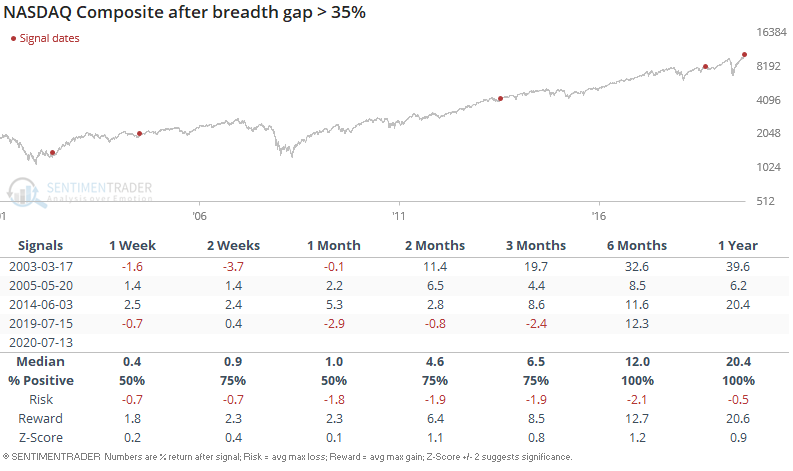
And it was also bullish for the NASDAQ Composite:

While tech speculators enjoyed strong gains over the past month, investors in a broad S&P 500 fund have had comparatively little to celebrate about. The NASDAQ surged while the S&P went nowhere.

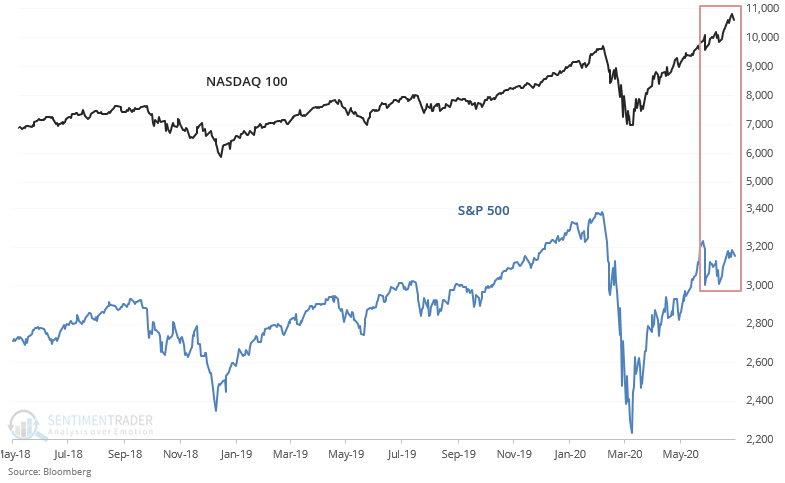
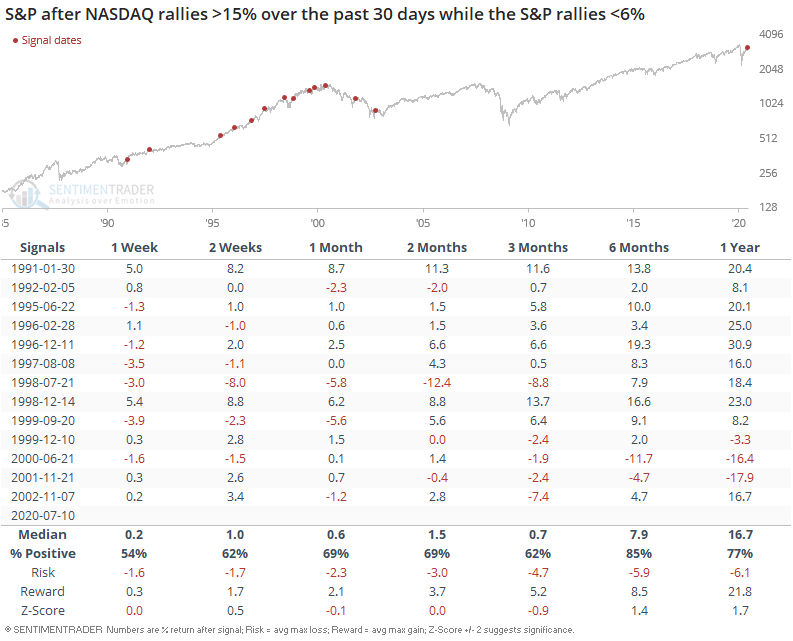
When the NASDAQ rallied >15% over the past 30 days while the S&P rallied <6%, it often led to a short term pullback in tech stocks over the next 2 weeks. Such a large gap in returns has not been seen since the dot-com boom and bust.

The S&P 500 fared comparatively better than the NASDAQ:

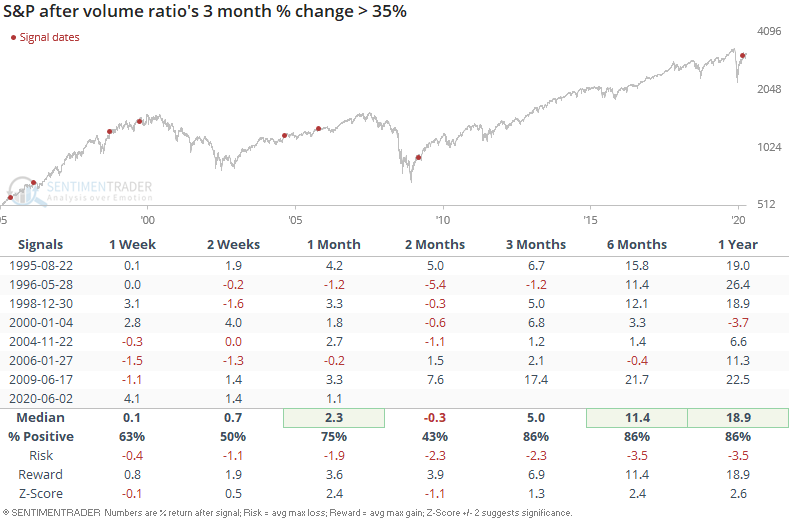
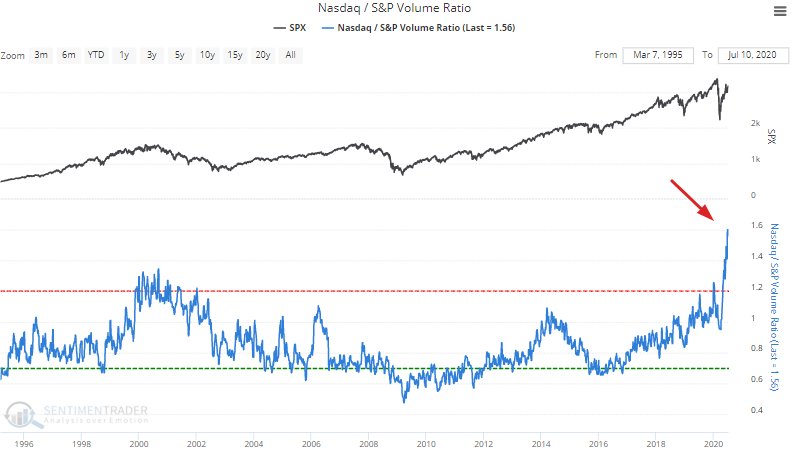
And lastly, the NASDAQ/S&P volume ratio is still near an all-time high:

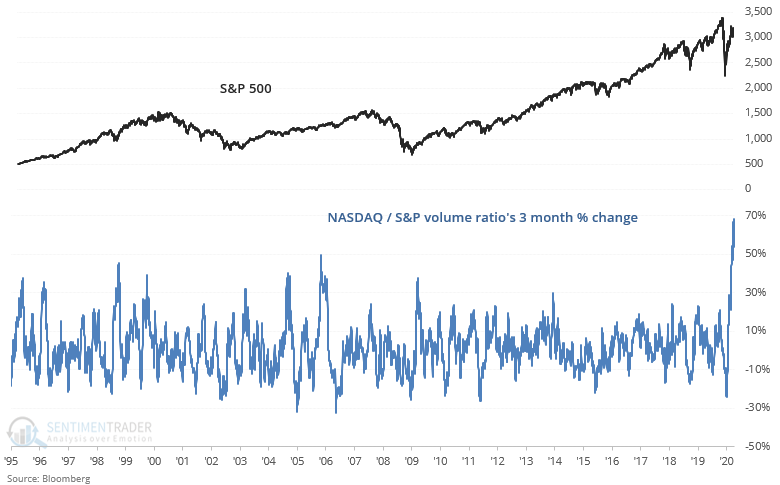
We can look at the ratio's 3 month rate-of-change instead of absolute figures. Such analysis leads to a similar conclusion: speculators have charged headlong into tech stocks over the past few months.

Such headlong charges into tech stocks could lead to short term pullbacks in the U.S. stock market, but on a 6-12 month forward basis this usually led to more gains.

Sorry, you don't have access to this report

Upgrade your subscription plan to get access
Go to Dasboard
PRODUCTS
SentimenTrader
Trading Tools
Indicators & Data API
‍
Strategies & Scanner
‍
Research Reports
FREE
RESOUrCES
Simple Backtest
Calculator
Simple Seasonality
Calculator
The Kelly Criterion
Calculator
Sentiment Geo Map
‍
Public Research Reports
‍
Pricing
Bundle pricing
‍
Announcements
‍
FAQ
COMPANY
‍
About
‍
In the News
‍
Testimonials
‍
Client Success Stories
CONTACT
‍
General Inquiries
‍
Media Inquiries
‍
Financial Professionals Inquiries
‍
© 2025 Sundial Capital Research Inc. All rights reserved.
Setsail Marketing
TermsPrivacyAffiliate Program
Risk Disclosure: Futures and forex trading contains substantial risk and is not for every investor. An investor could potentially lose all or more than the initial investment. Risk capital is money that can be lost without jeopardizing ones’ financial security or life style. Only risk capital should be used for trading and only those with sufficient risk capital should consider trading. Past performance is not necessarily indicative of future results.

Hypothetical Performance Disclosure: Hypothetical performance results have many inherent limitations, some of which are described below. No representation is being made that any account will or is likely to achieve profits or losses similar to those shown; in fact, there are frequently sharp differences between hypothetical performance results and the actual results subsequently achieved by any particular trading program. One of the limitations of hypothetical performance results is that they are generally prepared with the benefit of hindsight. In addition, hypothetical trading does not involve financial risk, and no hypothetical trading record can completely account for the impact of financial risk of actual trading. for example, the ability to withstand losses or to adhere to a particular trading program in spite of trading losses are material points which can also adversely affect actual trading results. There are numerous other factors related to the markets in general or to the implementation of any specific trading program which cannot be fully accounted for in the preparation of hypothetical performance results and all which can adversely affect trading results.

Testimonial Disclosure: Testimonials appearing on this website may not be representative of other clients or customers and is not a guarantee of future performance or success.