Products
SentimenTrader Trading Tools
‍
Backtest Engine
My Trading Toolkit
Correlation Analysis
Seasonality
Market Prediction
Indicators & Data API
‍
Proprietary Indicators & Charts
Market Data API
Strategies & Scanner
‍
50+ Trading Strategies
Smart Stock Scanner
Smart Option Scanner
Research Reports
‍
Research Solutions
Reports Library
Free Resources
Simple Backtest Calculator
Simple Seasonality Calculator
The Kelly Criterion Calculator
Sentiment Geo Map
Public Research Reports
Education
Sentiment Indicators
Technical Indicators
Pricing
Company
About
In the News
Testimonials
Client Success Stories
Contact
Log inLoginSign up
< BACK TO ALL REPORTS

The Everything Rally

Jason Goepfert
2019-06-24
null

The everything rally

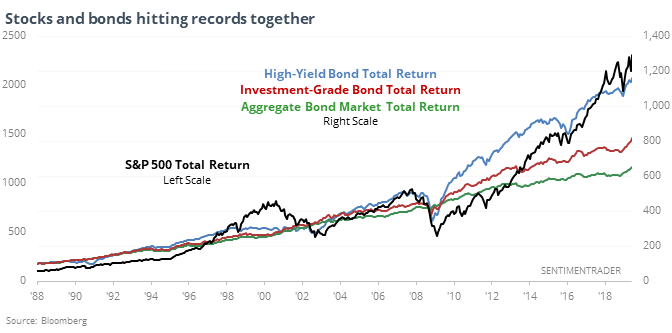
Total return stock and bond indexes are hitting all-time highs at the same time. They cover an array of stocks and bonds, suggesting extreme breadth of buying interest, as noted by Bloomberg.
The Everything Rally

When they’ve all hit records together, it has been an especially good longer-term sign for stocks. They rallied almost universally after these signals and over the next 2-6 months, there was only one date that showed a loss of more than 1%. For bonds, it wasn’t quite as consistently positive, but all of them showed gains most of the time across all time frames, with returns mostly above random.

Quick cycle

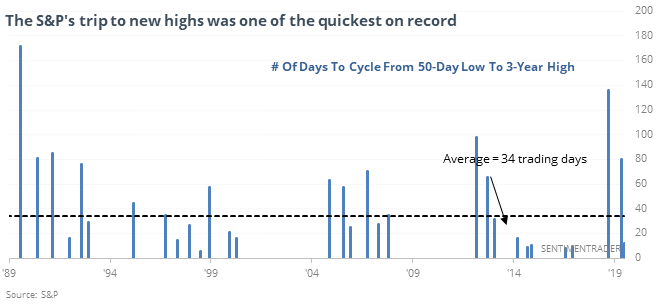
Yet again, stocks showed a tendency to cycle quickly from a selloff to new highs. For the S&P 500, it went from a 50-day low multi-year high in less than three weeks, nearly a record going back to 1928.
The Everything Rally

The median cycle from low to high has taken 34 days, so this was nearly three times faster than usual. Over the next month, it seems like sellers had a strong tendency to give up. From 1-4 weeks later, there was only a single loss, and the risk/reward was impressively skewed to the upside.

Dollar downtrend

The U.S. dollar’s 200-day average has been rising for a year, but the late-week selling has pushed the buck to a multi-month low and below its average. This has led to a rebound in the dollar in the past, but half of them didn’t last.

The latest Commitments of Traders report was released, covering positions through Tuesday

The 3-Year Min/Max Screen shows that “smart money” hedgers have their largest exposure in years to cotton. They’re now holding 42% of open interest in gold net short. The Backtest Engine shows over the past 7 years that has led to gains in gold only 25% of the time over the next two months.

This post was an abridged version of our previous day's Daily Report. For full access, sign up for a 30-day free trial now.

PRODUCTS
SentimenTrader
Trading Tools
Indicators & Data API
‍
Strategies & Scanner
‍
Research Reports
FREE
RESOUrCES
Simple Backtest
Calculator
Simple Seasonality
Calculator
The Kelly Criterion
Calculator
Sentiment Geo Map
‍
Public Research Reports
‍
Education
Sentiment Indicators
‍
Technical Indicators
‍
Pricing
Bundle pricing
‍
FAQ
‍
Announcements
‍
COMPANY
‍
About
‍
In the News
‍
Testimonials
‍
Client Success Stories
CONTACT
‍
General Inquiries
‍
Media Inquiries
‍
Financial Professionals Inquiries
‍
© 2026 Sundial Capital Research Inc. All rights reserved.
Setsail Marketing
TermsPrivacyAffiliate Program
Risk Disclosure: The information and tools provided are for research and analytical purposes only and are not intended as investment advice. Market analysis involves uncertainty, and outcomes may differ from expectations. Users should conduct their own due diligence and consider their individual circumstances before making any financial decisions. Past performance is not necessarily indicative of future results.

Hypothetical Performance Disclosure: Hypothetical performance results have many inherent limitations, some of which are described below. No representation is being made that any account will or is likely to achieve profits or losses similar to those shown; in fact, there are frequently sharp differences between hypothetical performance results and the actual results subsequently achieved by any particular trading program. One of the limitations of hypothetical performance results is that they are generally prepared with the benefit of hindsight. In addition, hypothetical trading does not involve financial risk, and no hypothetical trading record can completely account for the impact of financial risk of actual trading. for example, the ability to withstand losses or to adhere to a particular trading program in spite of trading losses are material points which can also adversely affect actual trading results. There are numerous other factors related to the markets in general or to the implementation of any specific trading program which cannot be fully accounted for in the preparation of hypothetical performance results and all which can adversely affect trading results.

Testimonial Disclosure: Testimonials appearing on this website may not be representative of other clients or customers and is not a guarantee of future performance or success.