
The equal-weighted S&P 500 breaks out to a multi-year high

Key points:
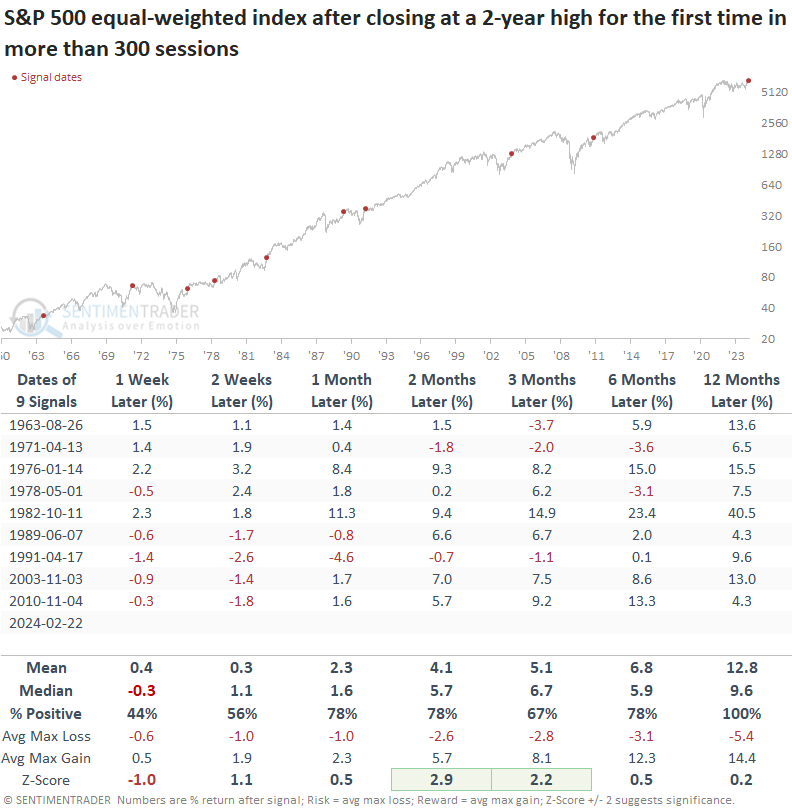
- The S&P 500 equal-weighted index closed at a 2-year high after failing to do so for more than two years
- Similar conclusions to a multi-year high drought preceded a 100% win rate for the index over the subsequent year
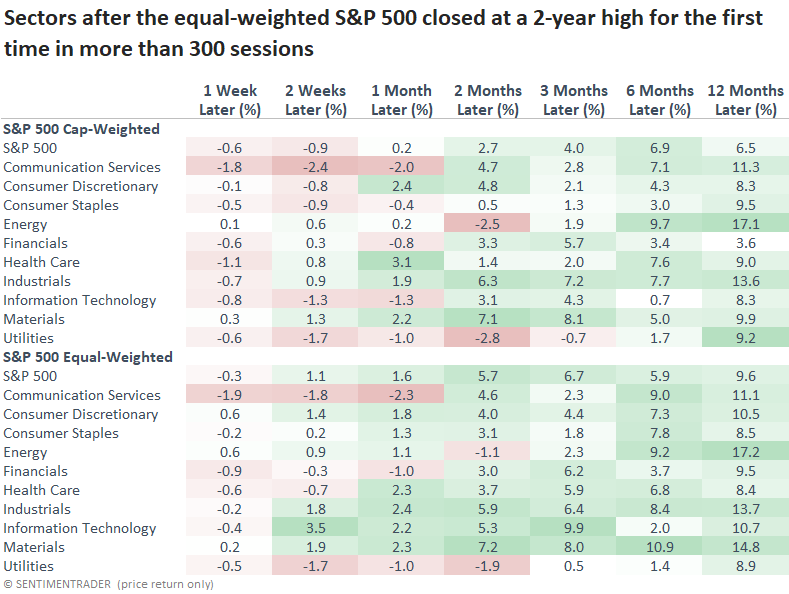
- The equal-weighted S&P 500 index tended to outperform the cap-weighted version across most horizons
An index designed to neutralize the influence of mega-cap stocks closed at a multi-year high
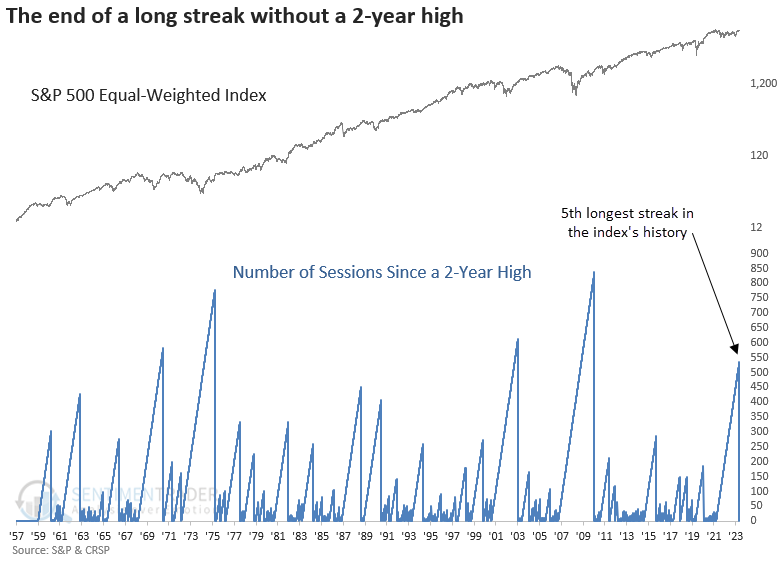
While the world's most benchmarked index recorded its 12th all-time high since the start of the year on Thursday, driven by excitement from Nvidia's earnings, very few market participants commented on the new 2-year high in the equal-weighted S&P 500 index, which remains only 1.77% below its all-time high.
The index, which allocates an equal weighting to each component, broke its streak of 546 sessions without a multi-year high, ending the 5th longest drought in history.
Similar breakouts produced bullish long-term results
After a prolonged period without reaching a new multi-year high, the equal-weighted S&P 500 tends to sustain its positive momentum after achieving this milestone. Although recent signals suggest some near-term weakness, the damage was minimal. A year later, the index was higher every time.
The equal-weighted index and sectors show slightly more favorable returns over the subsequent year. However, most signals occurred after a recession-driven bear market, which is not the case now. So, the historical tendency of the equal-weighted index to outperform the cap-weighted version in this early cycle phase may not be an appropriate analog.
As always, it's imperative to verify that historical tendencies align with current relative trends before allocating capital.
Interestingly, after highlighting a narrowing in stocks outperforming the S&P 500 in a recent note, the trend has reversed, with an abundance of stocks in sectors outside of Technology carrying the baton.
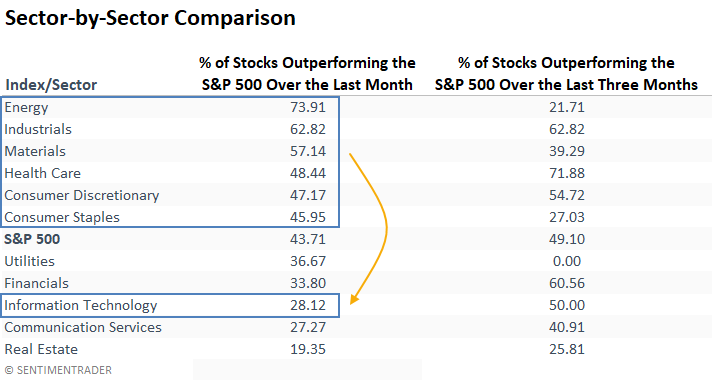
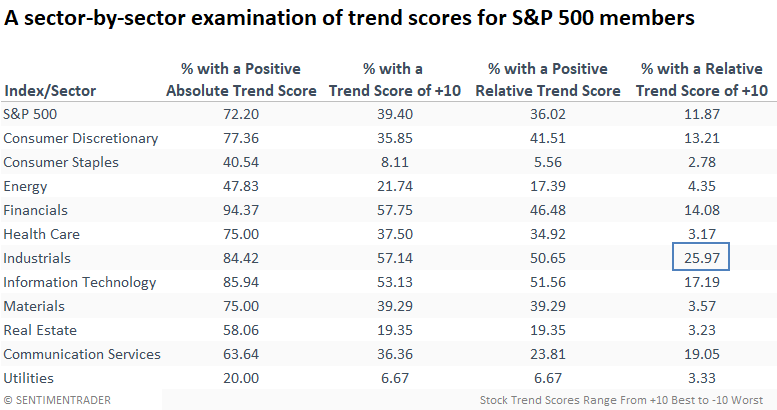
Absolute and Relative Trend Scores
Industrials have overtaken the Technology sector with the highest percentage of stocks with a perfect relative trend score of ten.
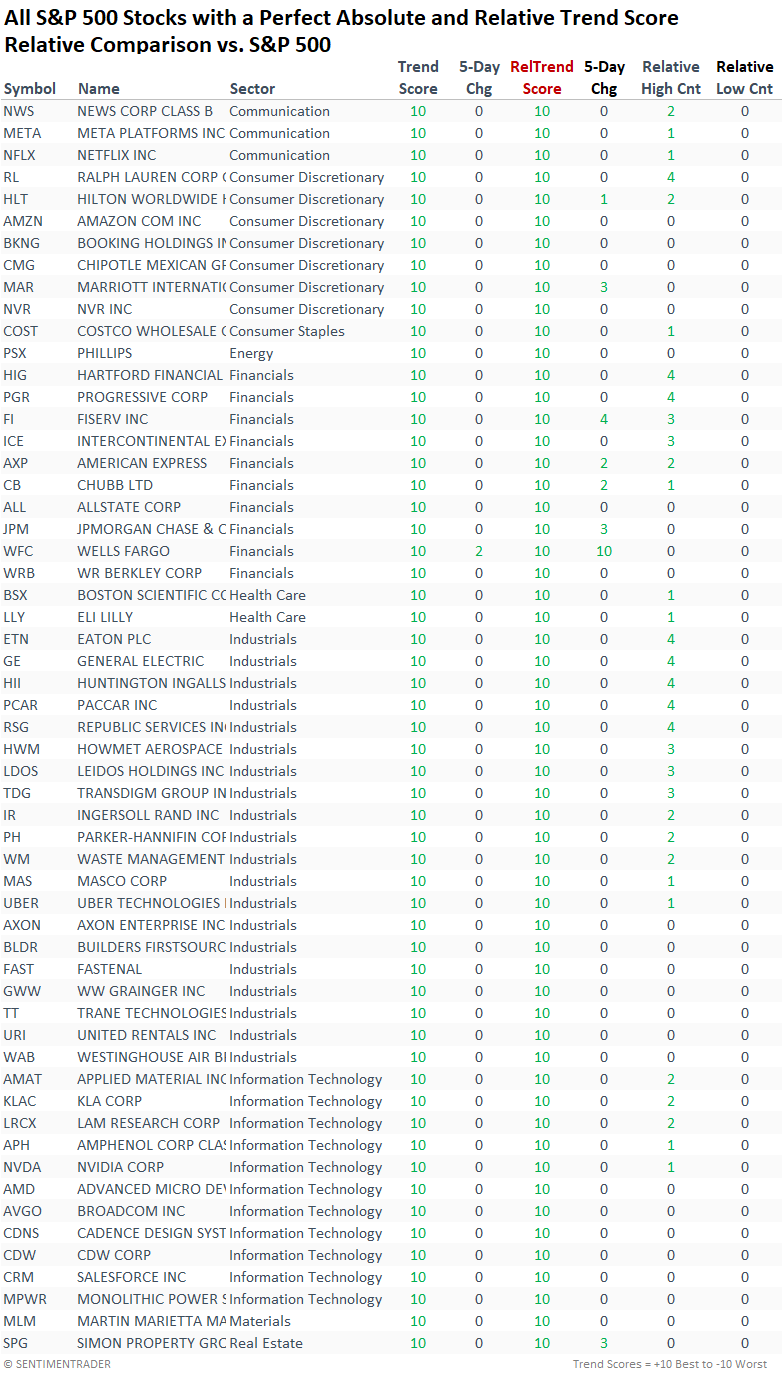
Suppose you were wondering which S&P 500 stocks comprised the perfect relative trend scores list. In that case, here's a table sorted by sector.
What the research tells us...
Whether it's the S&P 500 or many other broad benchmarks such as the NYSE composite, indexes continue to stair step higher, recording multi or all-time highs, a common feature of bull markets. While the breadth backdrop is not perfect, it's most likely nothing more than sector rotation. The equal-weighted S&P 500, an index that captures the movement of the average stock, closed at a new multi-year high after failing to do so for 546 sessions, the 5th longest drought in history. After similar breakouts, the index has risen over the subsequent year in every case.