
The equal weight S&P 500 has recovered...but Germany still leads

Key points:
- The equal-weight version of the S&P 500 finally recaptured its 200-day average relative to the cap-weight version
- While there are few precedents, it has been difficult for the average stock to maintain its relative momentum
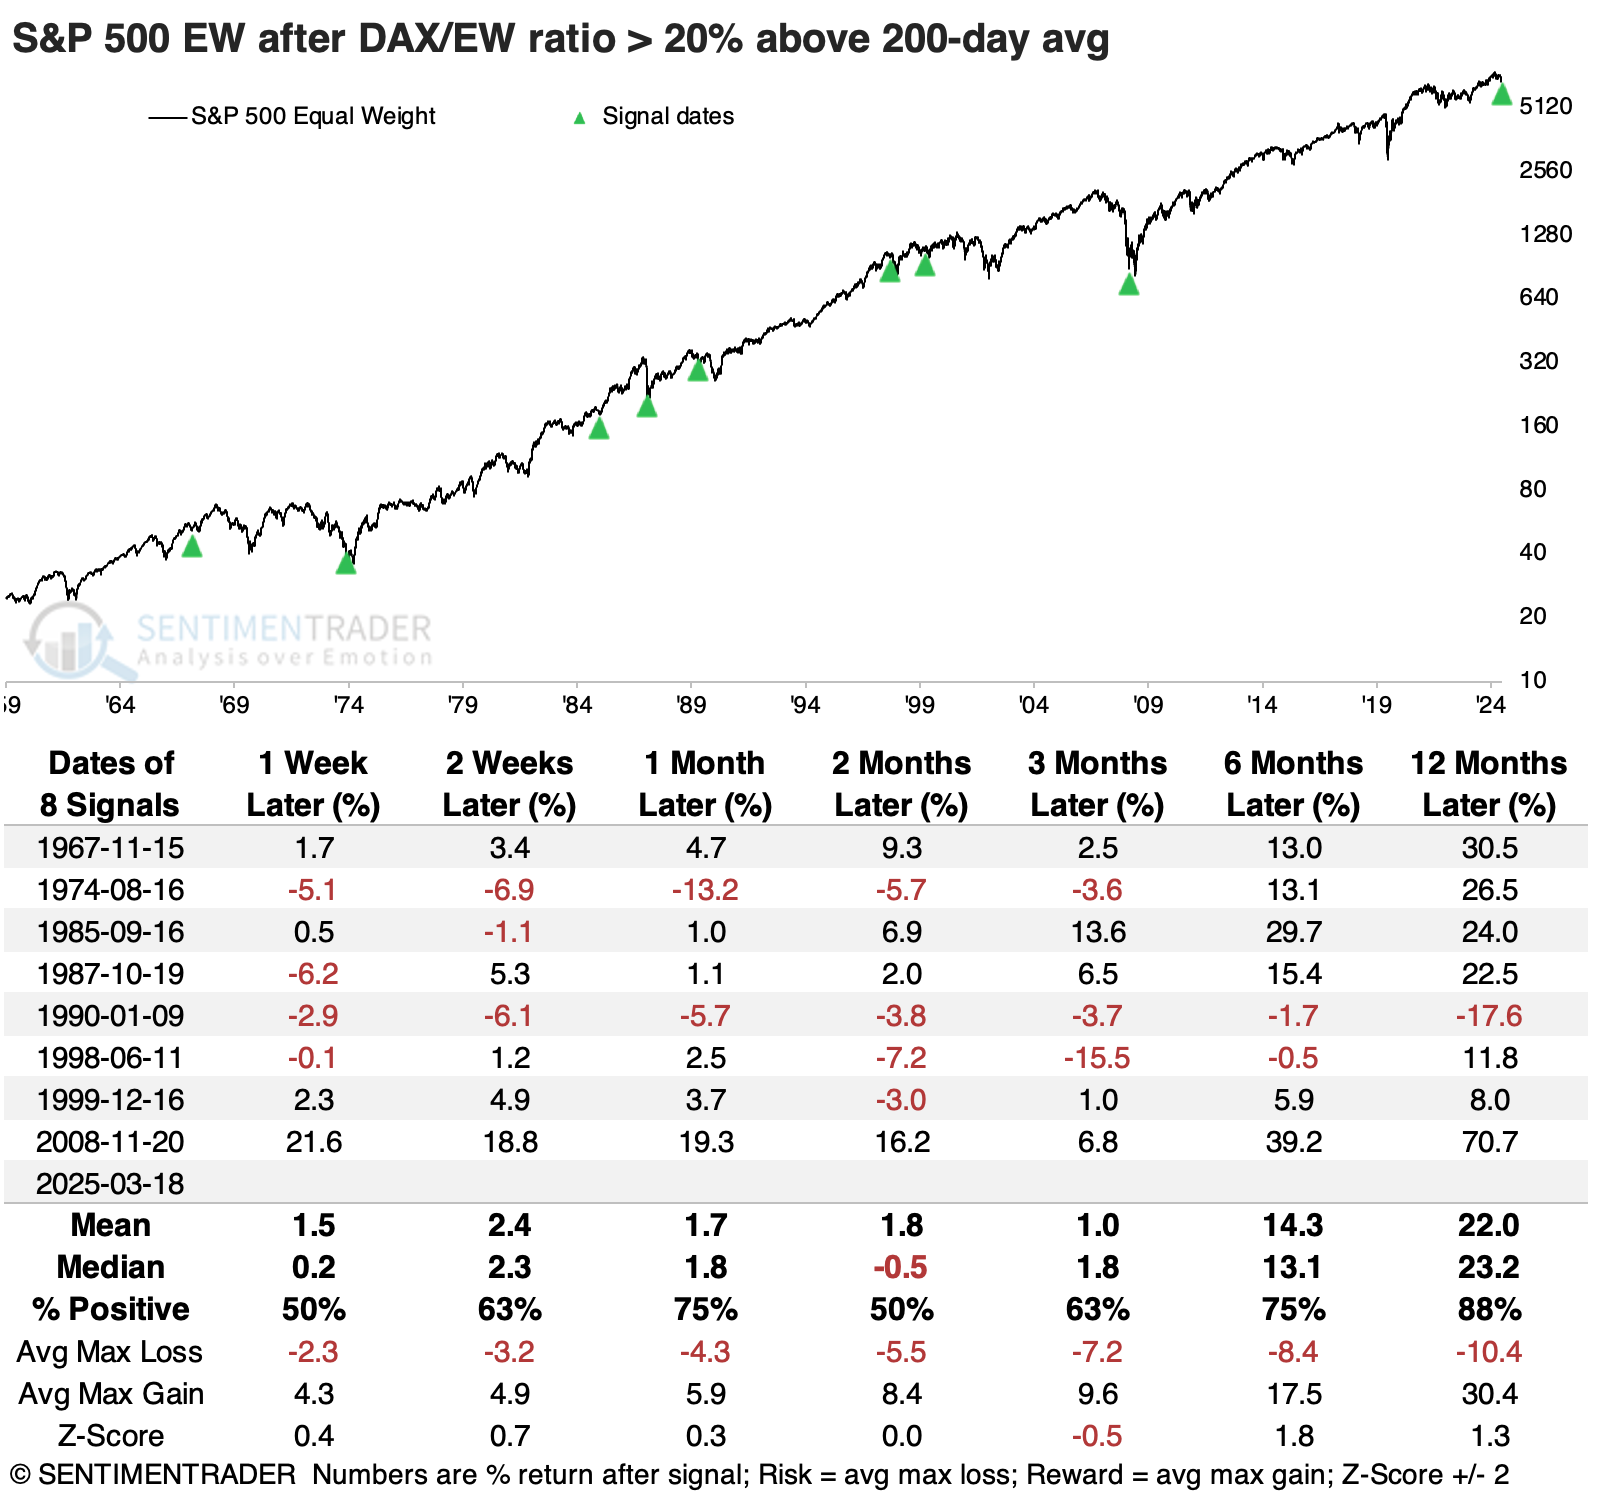
- The German DAX has done even better, rising 20% above its long-term average relative to the average S&P 500 stock
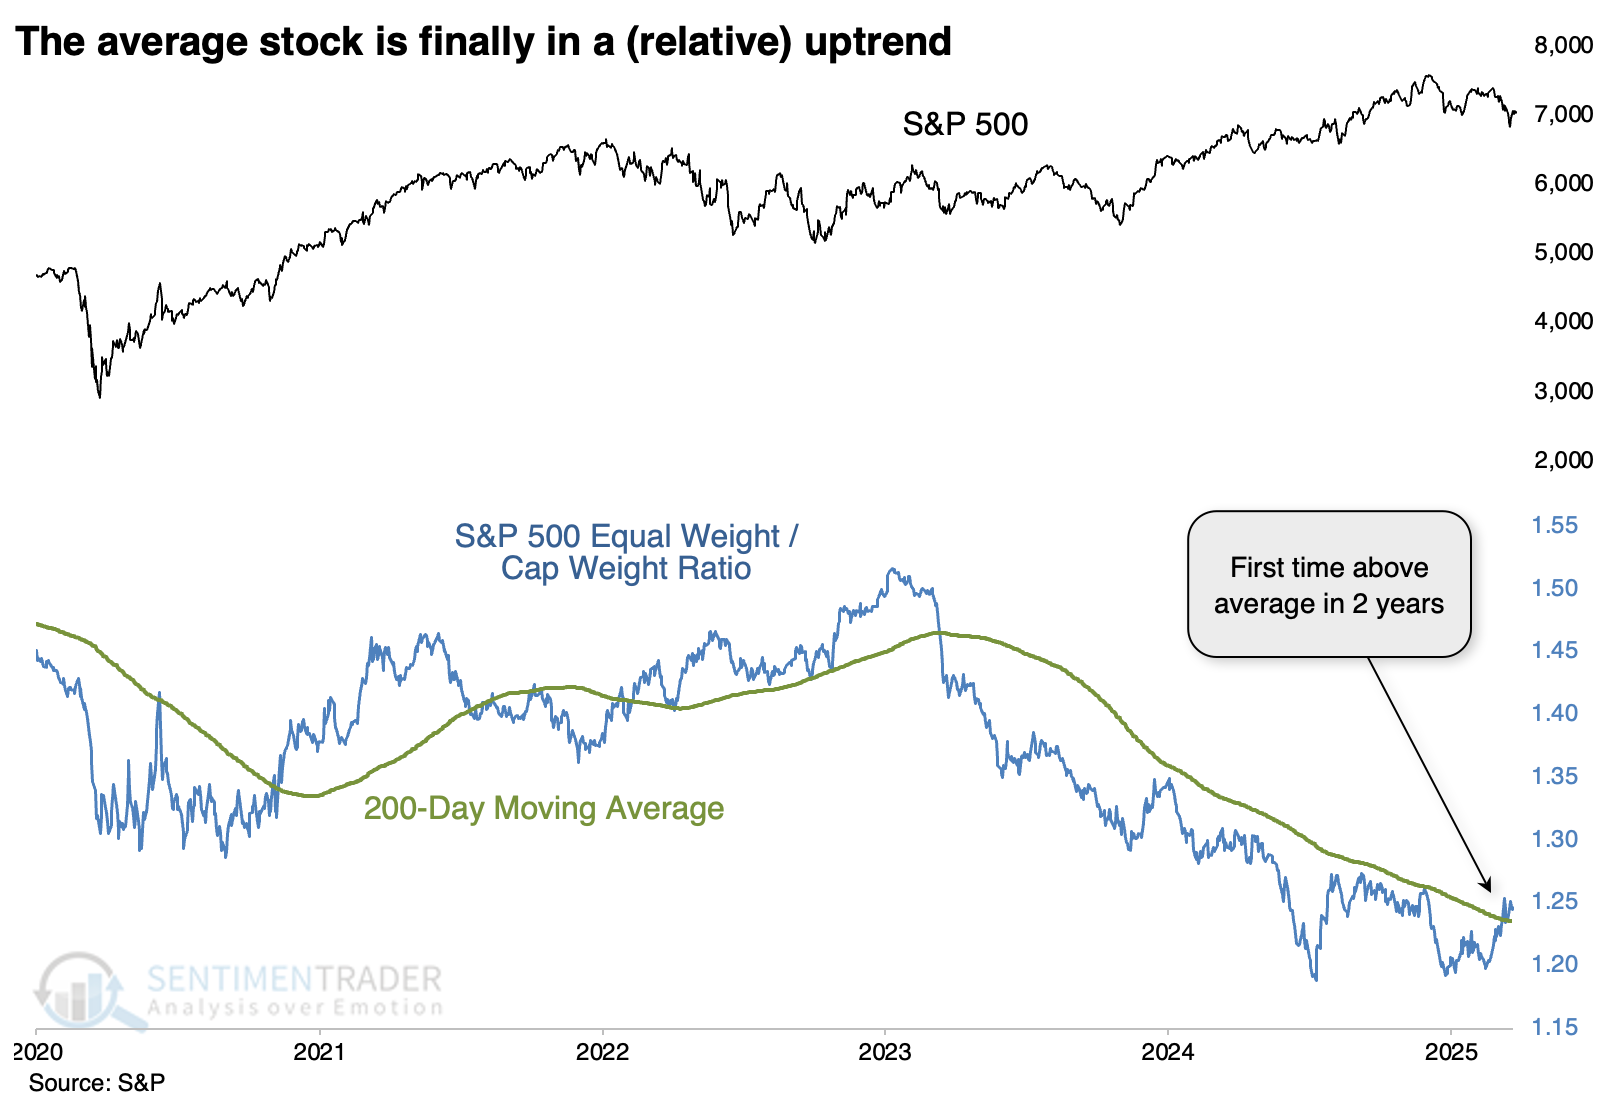
The average stock is in a relative uptrend
Several times in recent months, we've discussed the idea of defensive stocks likely leading the market, along with a relative resurgence in value. Basically, the average stock over the ones that had dominated an index like the S&P 500.
That index is capitalization-weighted. The equal-weighted version of the index has finally staged a notable turnaround, and the ratio between the two versions climbed above its long-term average for the first time in over two years.
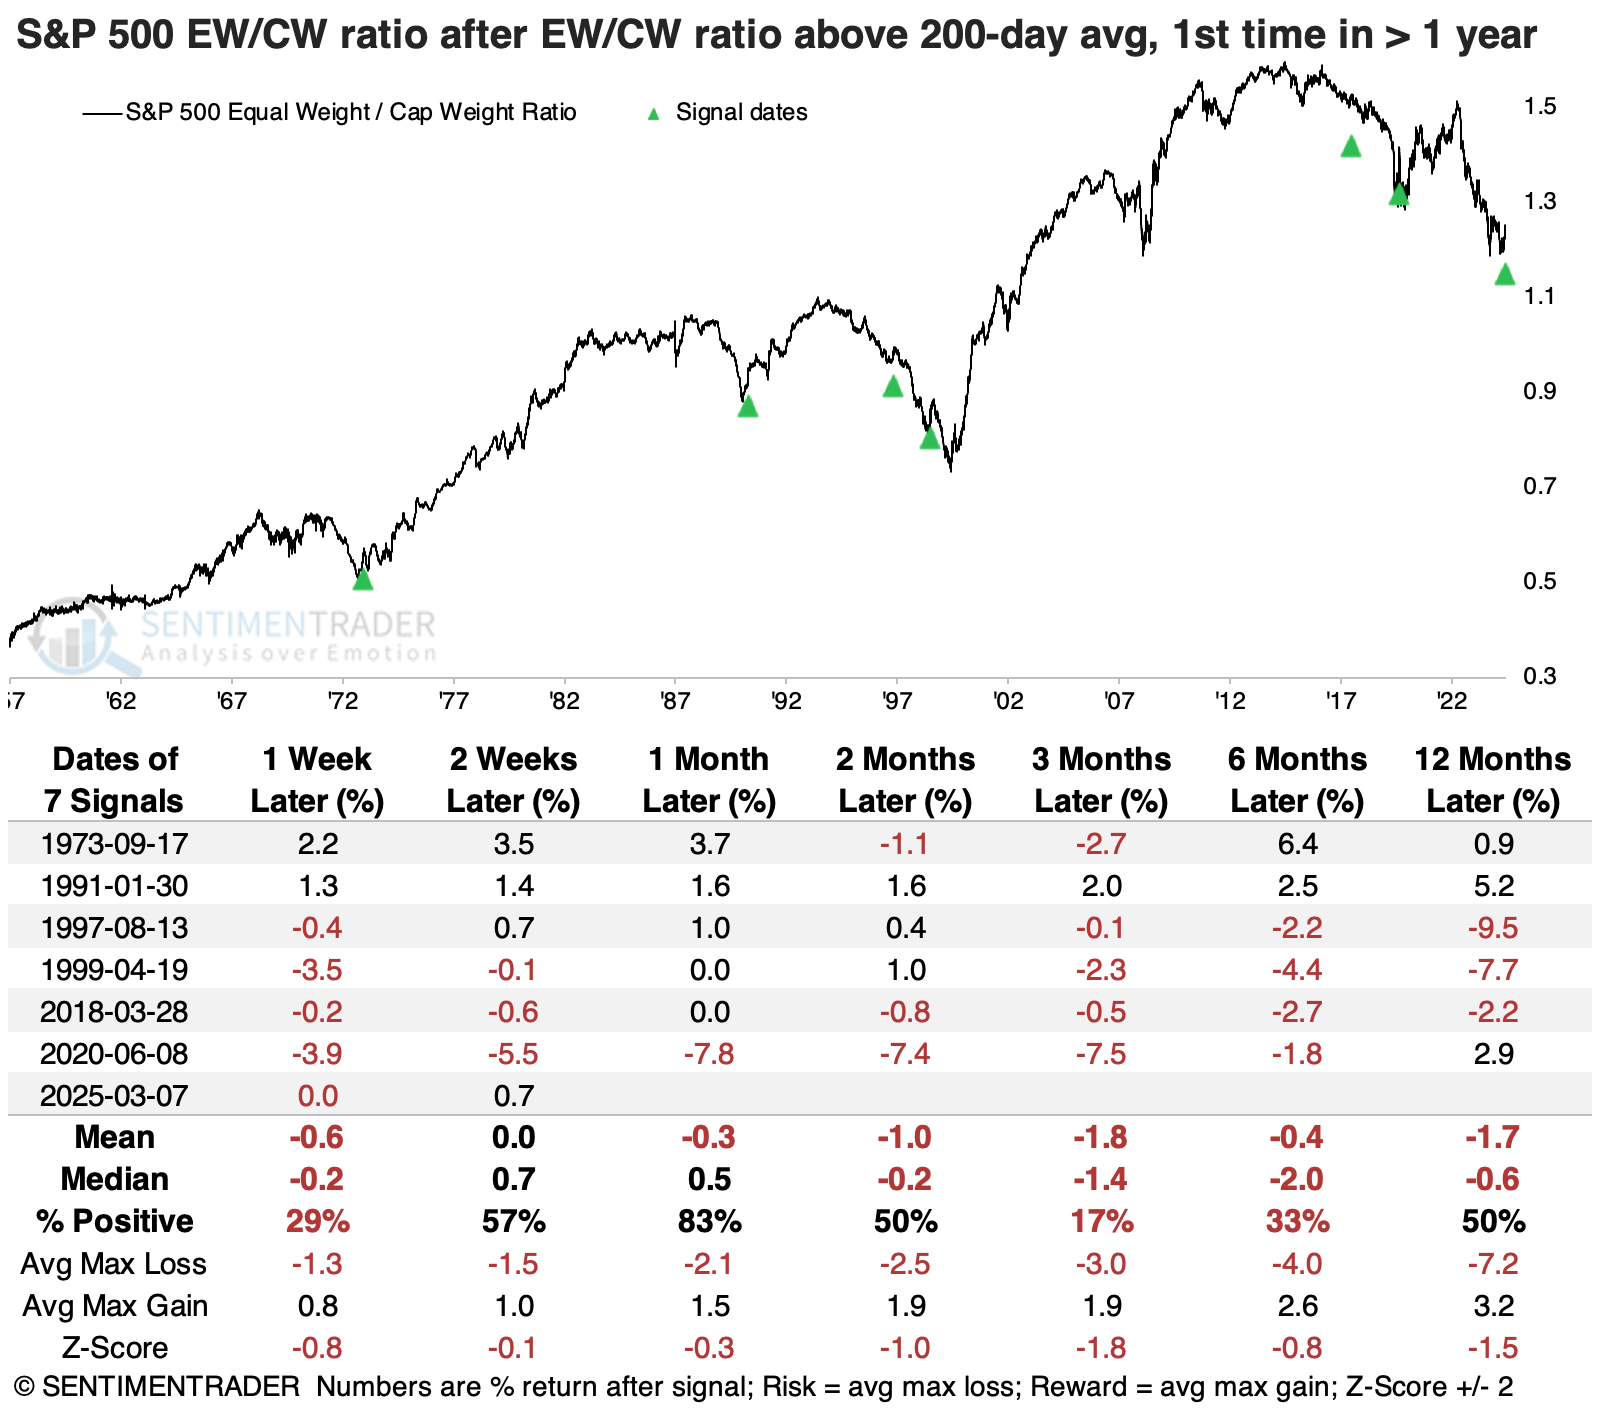
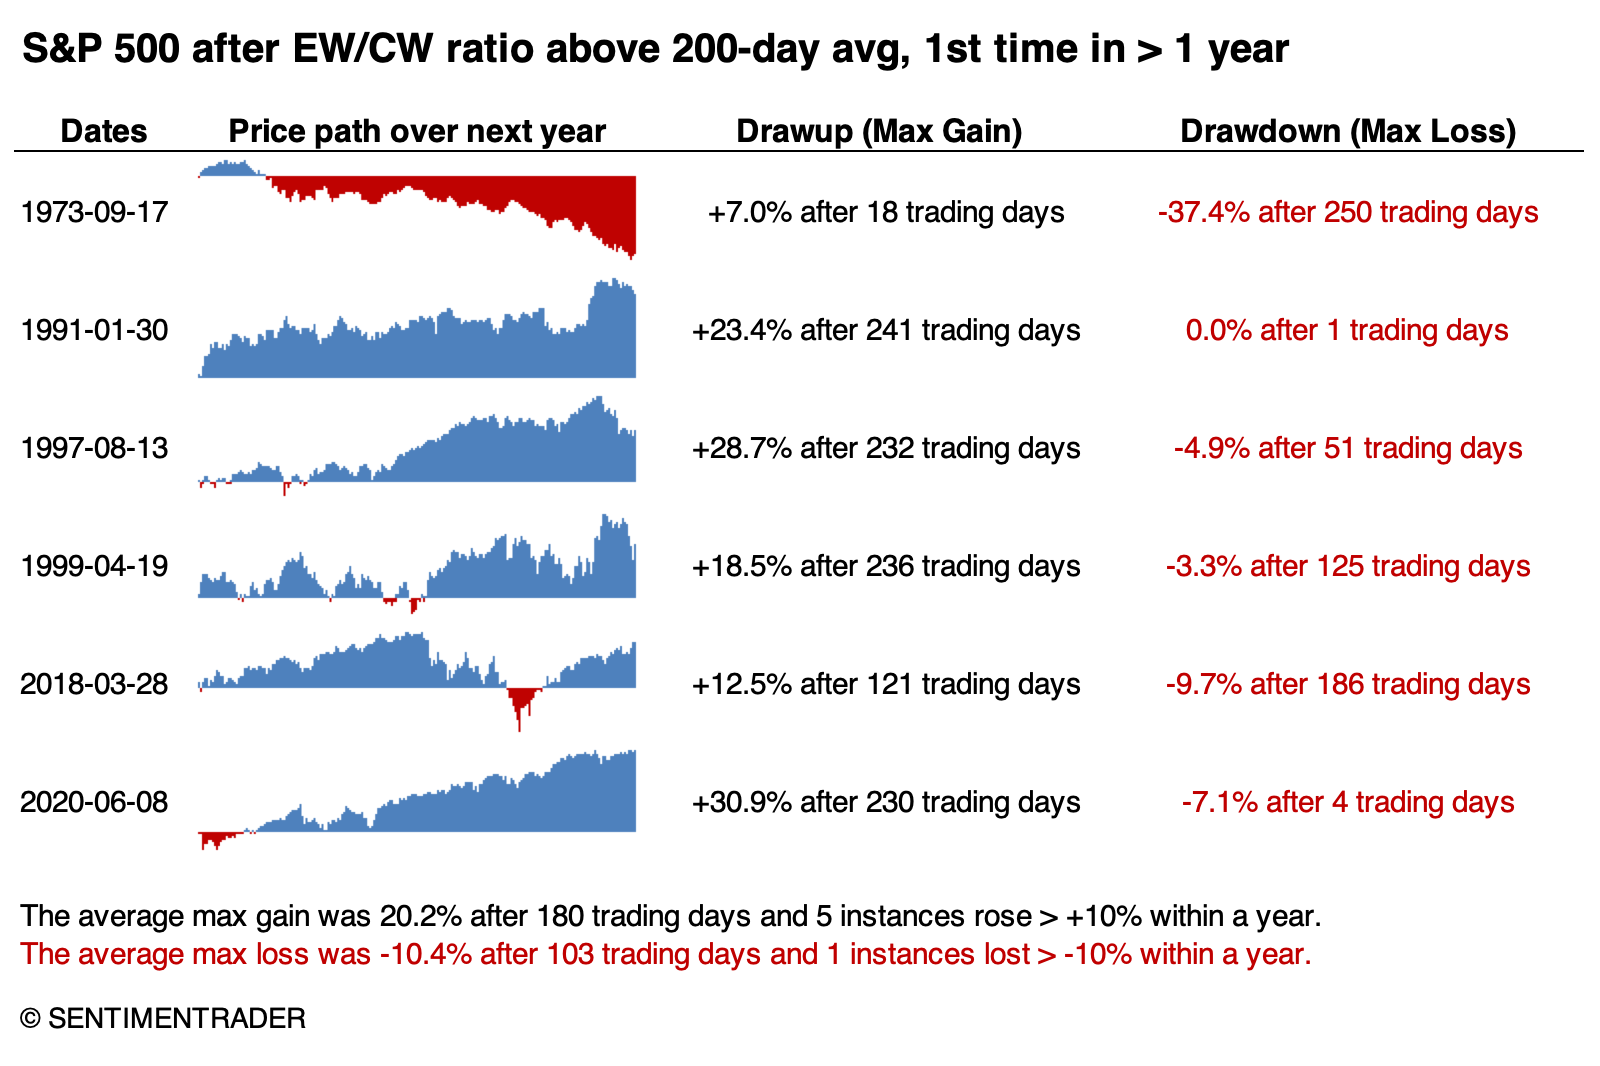
There have only been a handful of times in nearly 70 years when the ratio had gone more than a year below its 200-day average, then reclaimed it. And except for the instance in 1991, the equal-weight version of the index had trouble holding onto its relative momentum. That was the only time it continued to outperform the cap-weight version over the following three months.
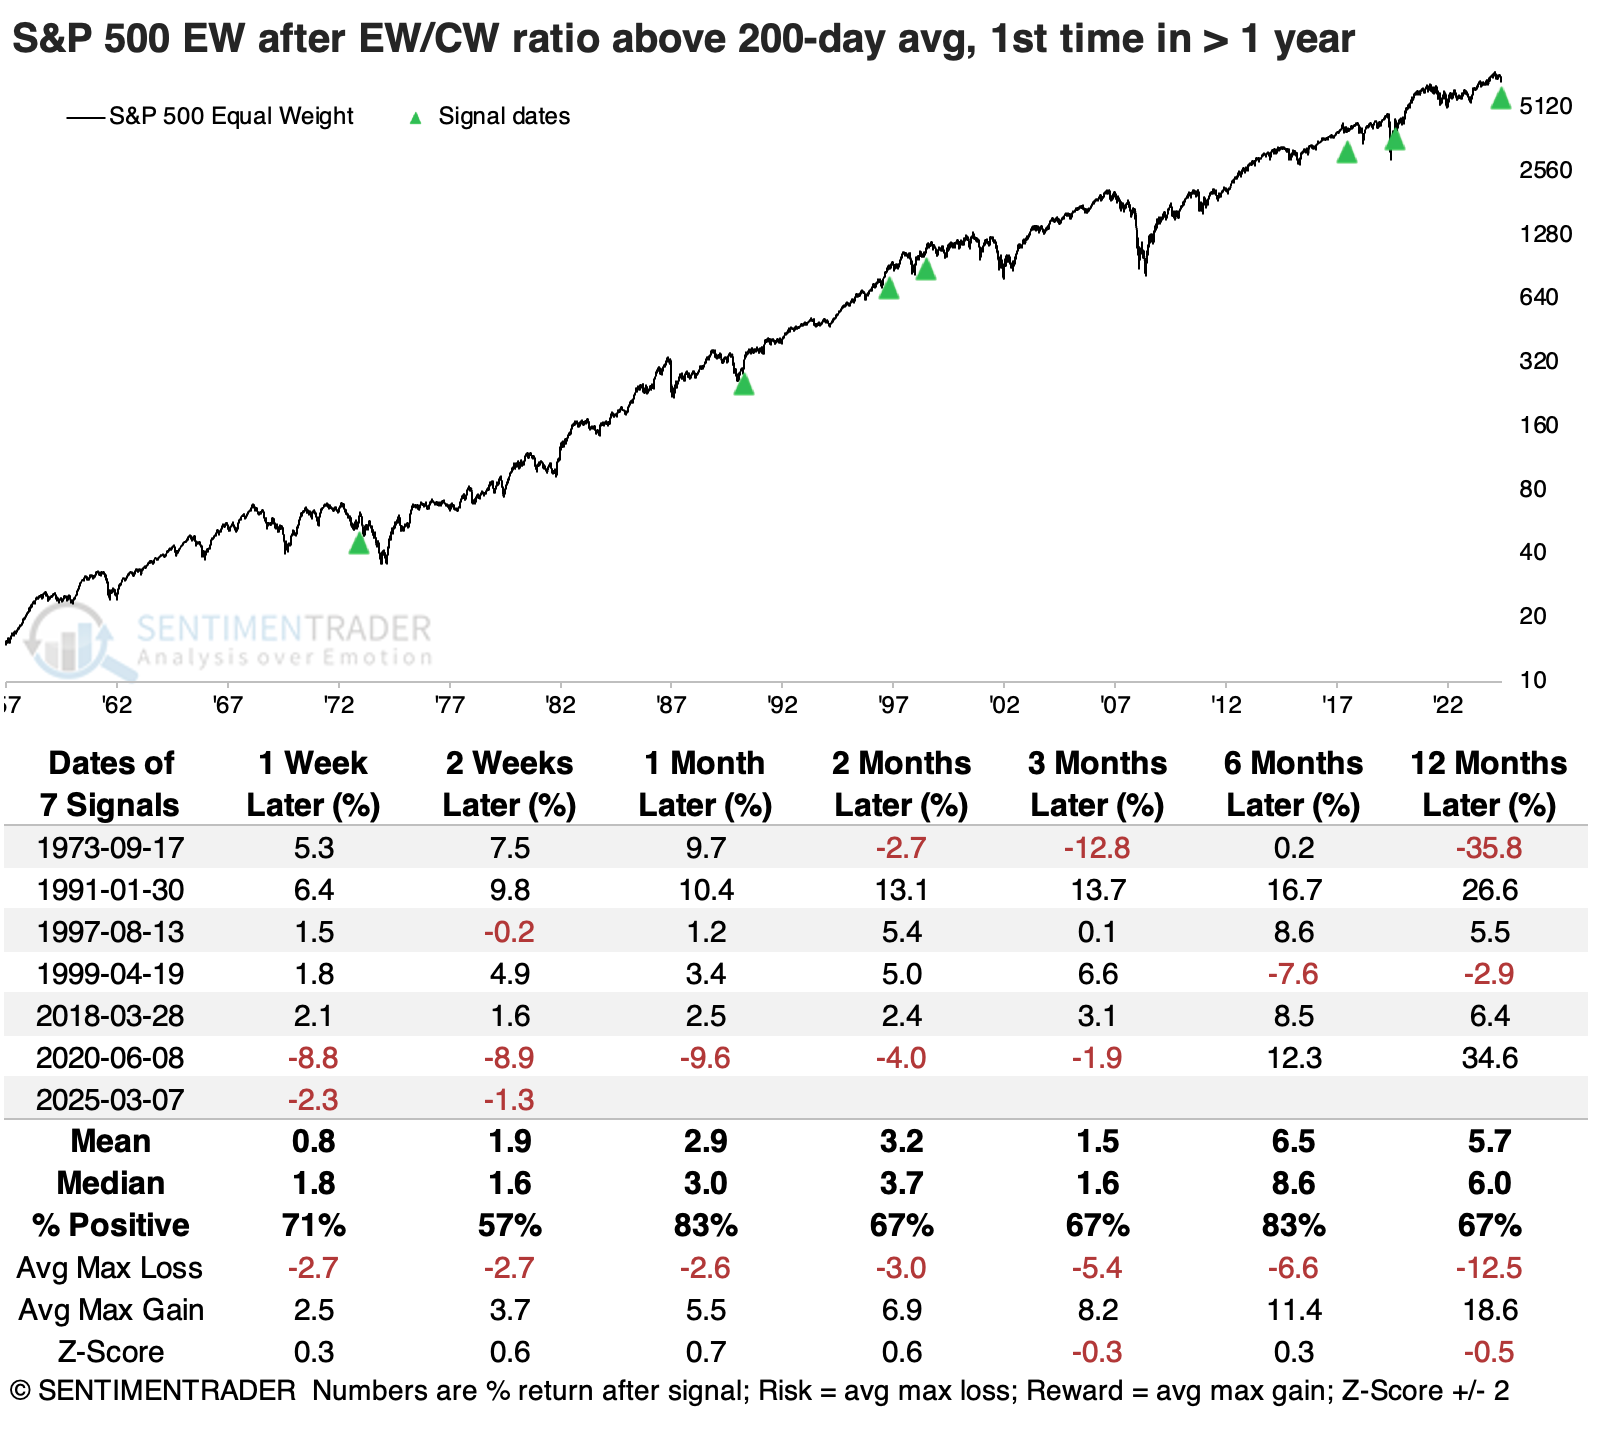
That's not to say the equal-weight index necessarily suffered losses. The table below shows its absolute returns, and they were mostly positive.
Because we were looking at relative returns, the cap-weight version of the index tended to perform better than the equal-weight one. Its returns were more consistently positive, with lower risk and higher reward. With only six precedents, though, it's hard to read too much into this.
A drawdown analysis shows that within the following year, only one of the signals suffered more than a -10% drawdown while five enjoyed a gain of at least +10%.
German stocks keep powering ahead
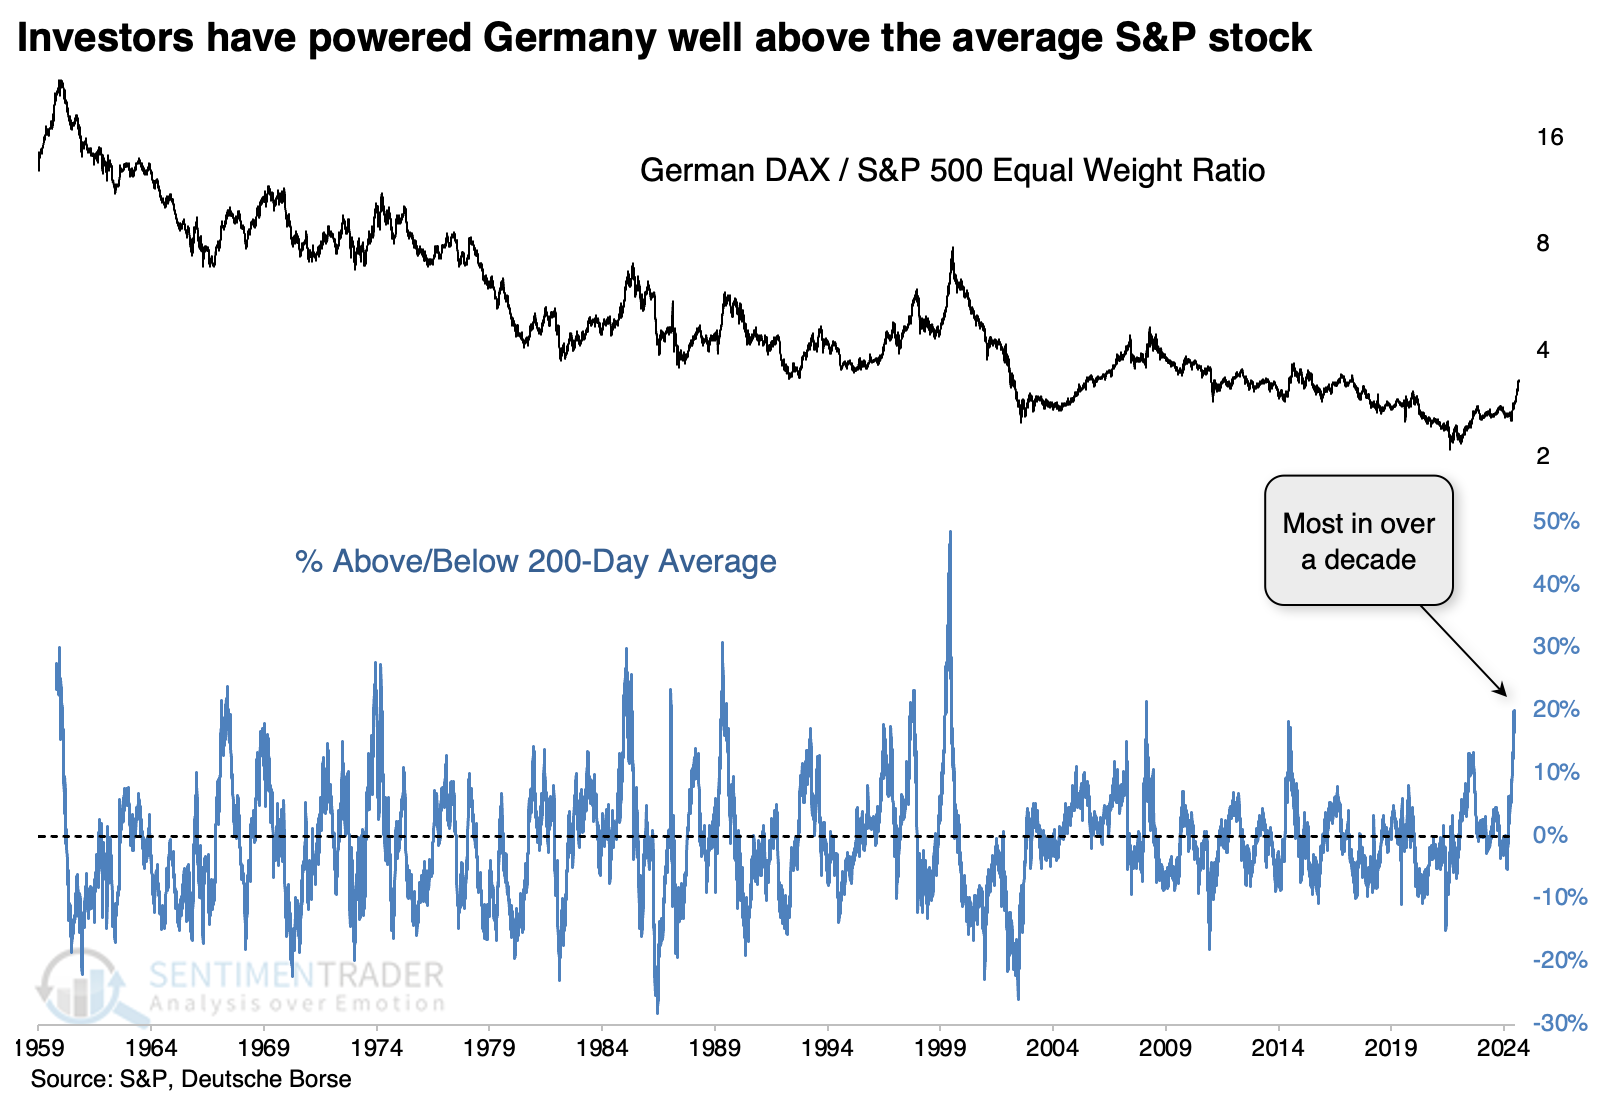
Even though the equal-weight version of the S&P 500 has been handily outperforming the cap-weight version of the same index, it has not been even remotely close to the German DAX (also a cap-weighted index).
The ratio between that index and the equal-weight S&P surged over 20% above its 200-day average for the first time in over a decade.
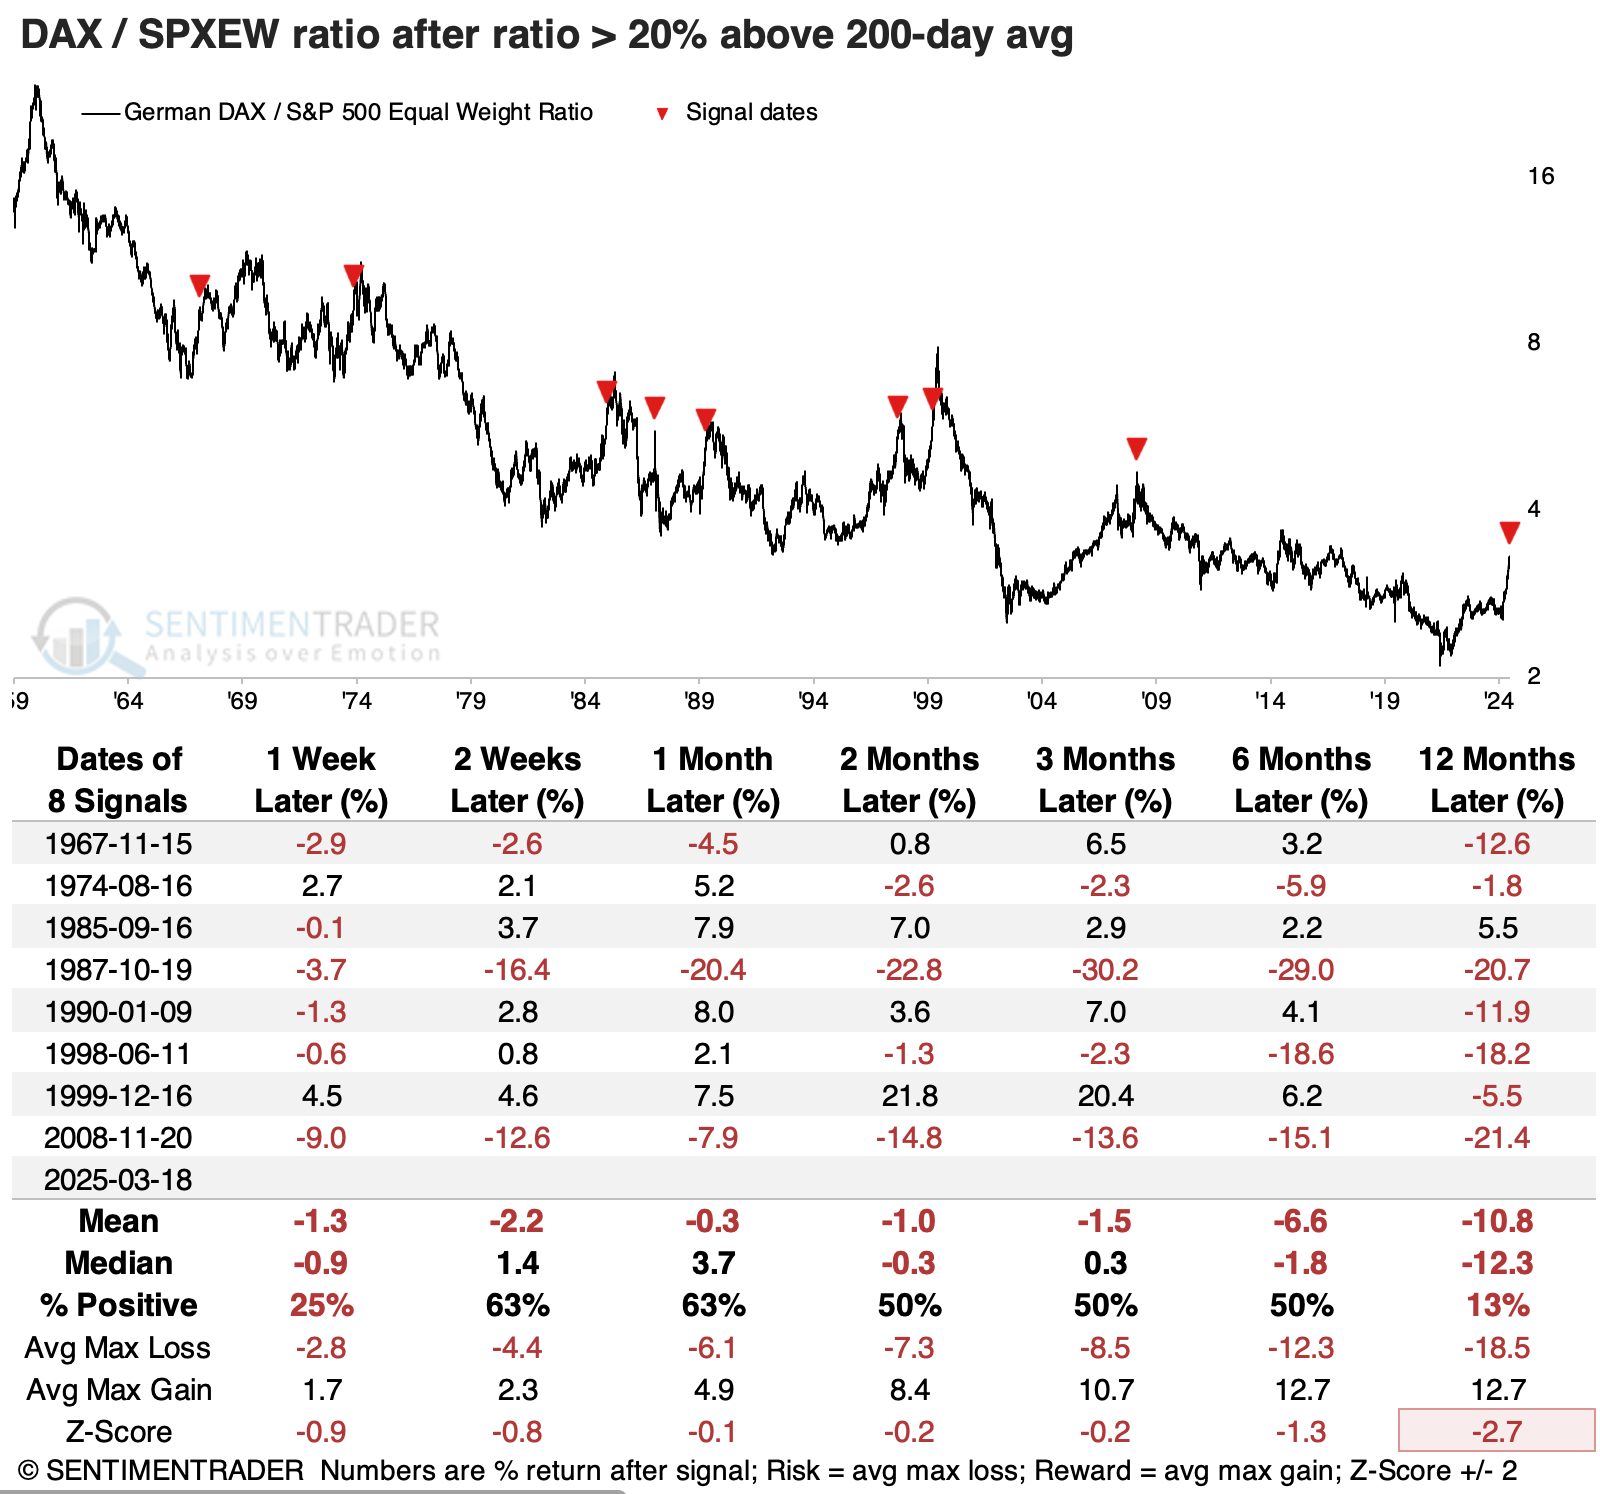
It has been difficult for the ratio to continue its relative outperformance. The ratio most often gave back some ground right away, then oscillated in the weeks ahead. But over the following months, any gains tended to evaporate. Over the following year, the DAX outperformed the average S&P 500 stock only once.
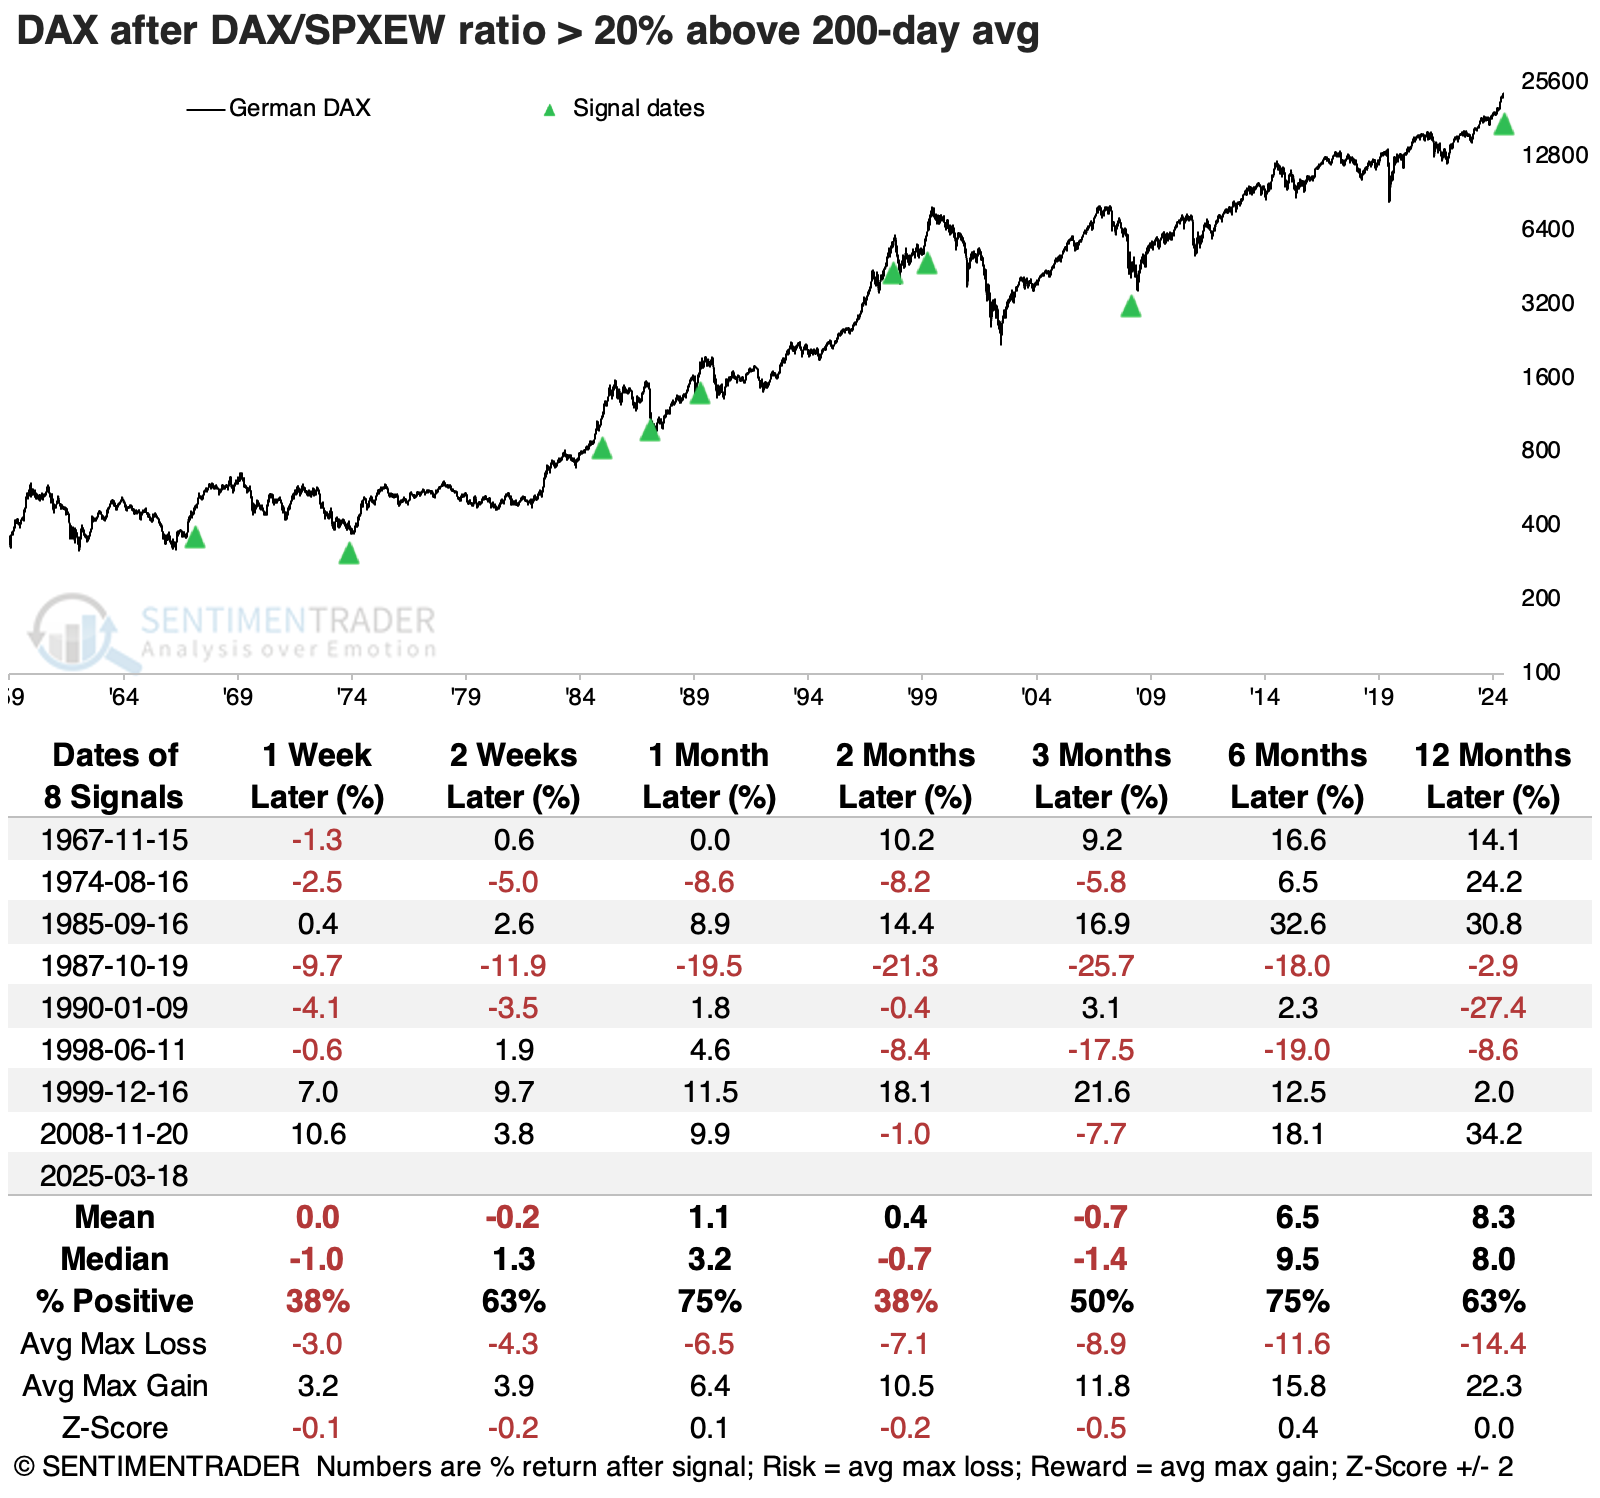
The absolute returns in the DAX were volatile.
The equal-weight S&P 500 tended to hold up well, with only two small losses over the following six months.
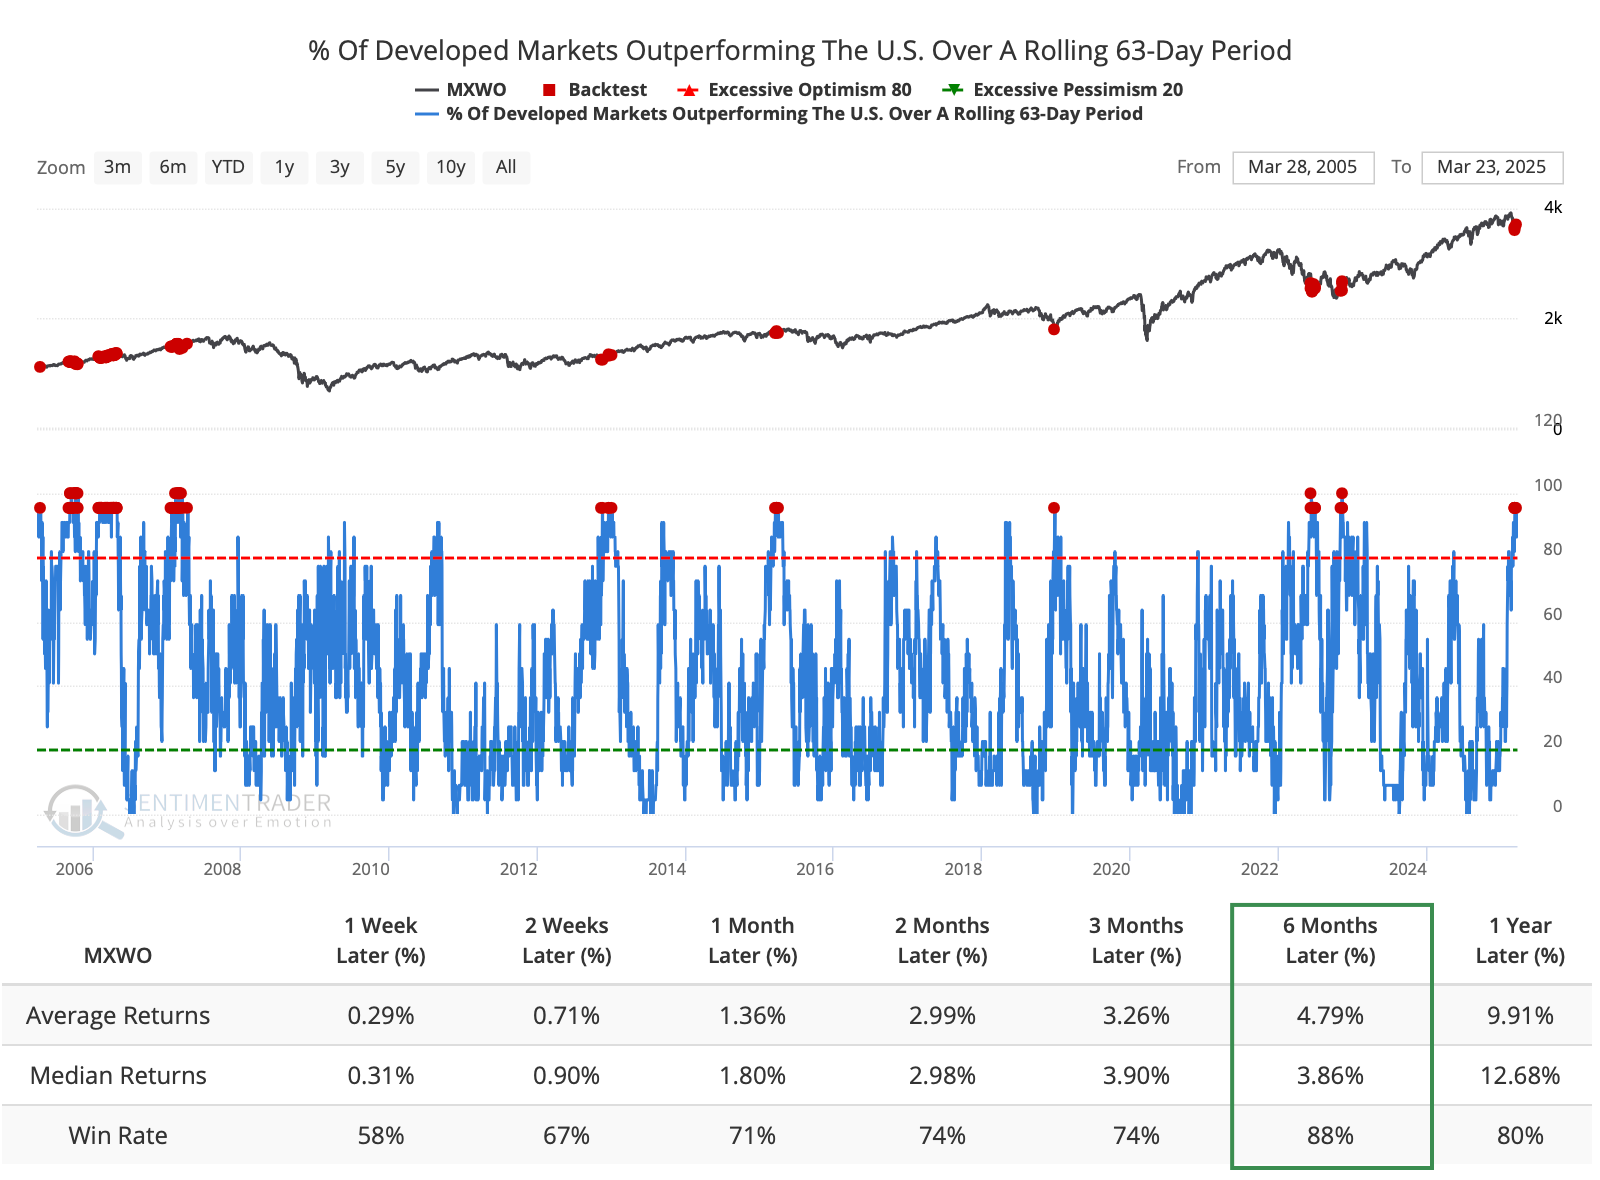
The tech team has just created a remarkable digest of custom breadth indicators for international markets (and crypto). Among the many indicators now available, we can see that over the past quarter, or 63 trading days, more than 95% of developed markets have outperformed the S&P 500. Similar thrusts for these markets have typically occurred near the beginning or middle of uptrends for the MSCI World Index.
What the research tells us...
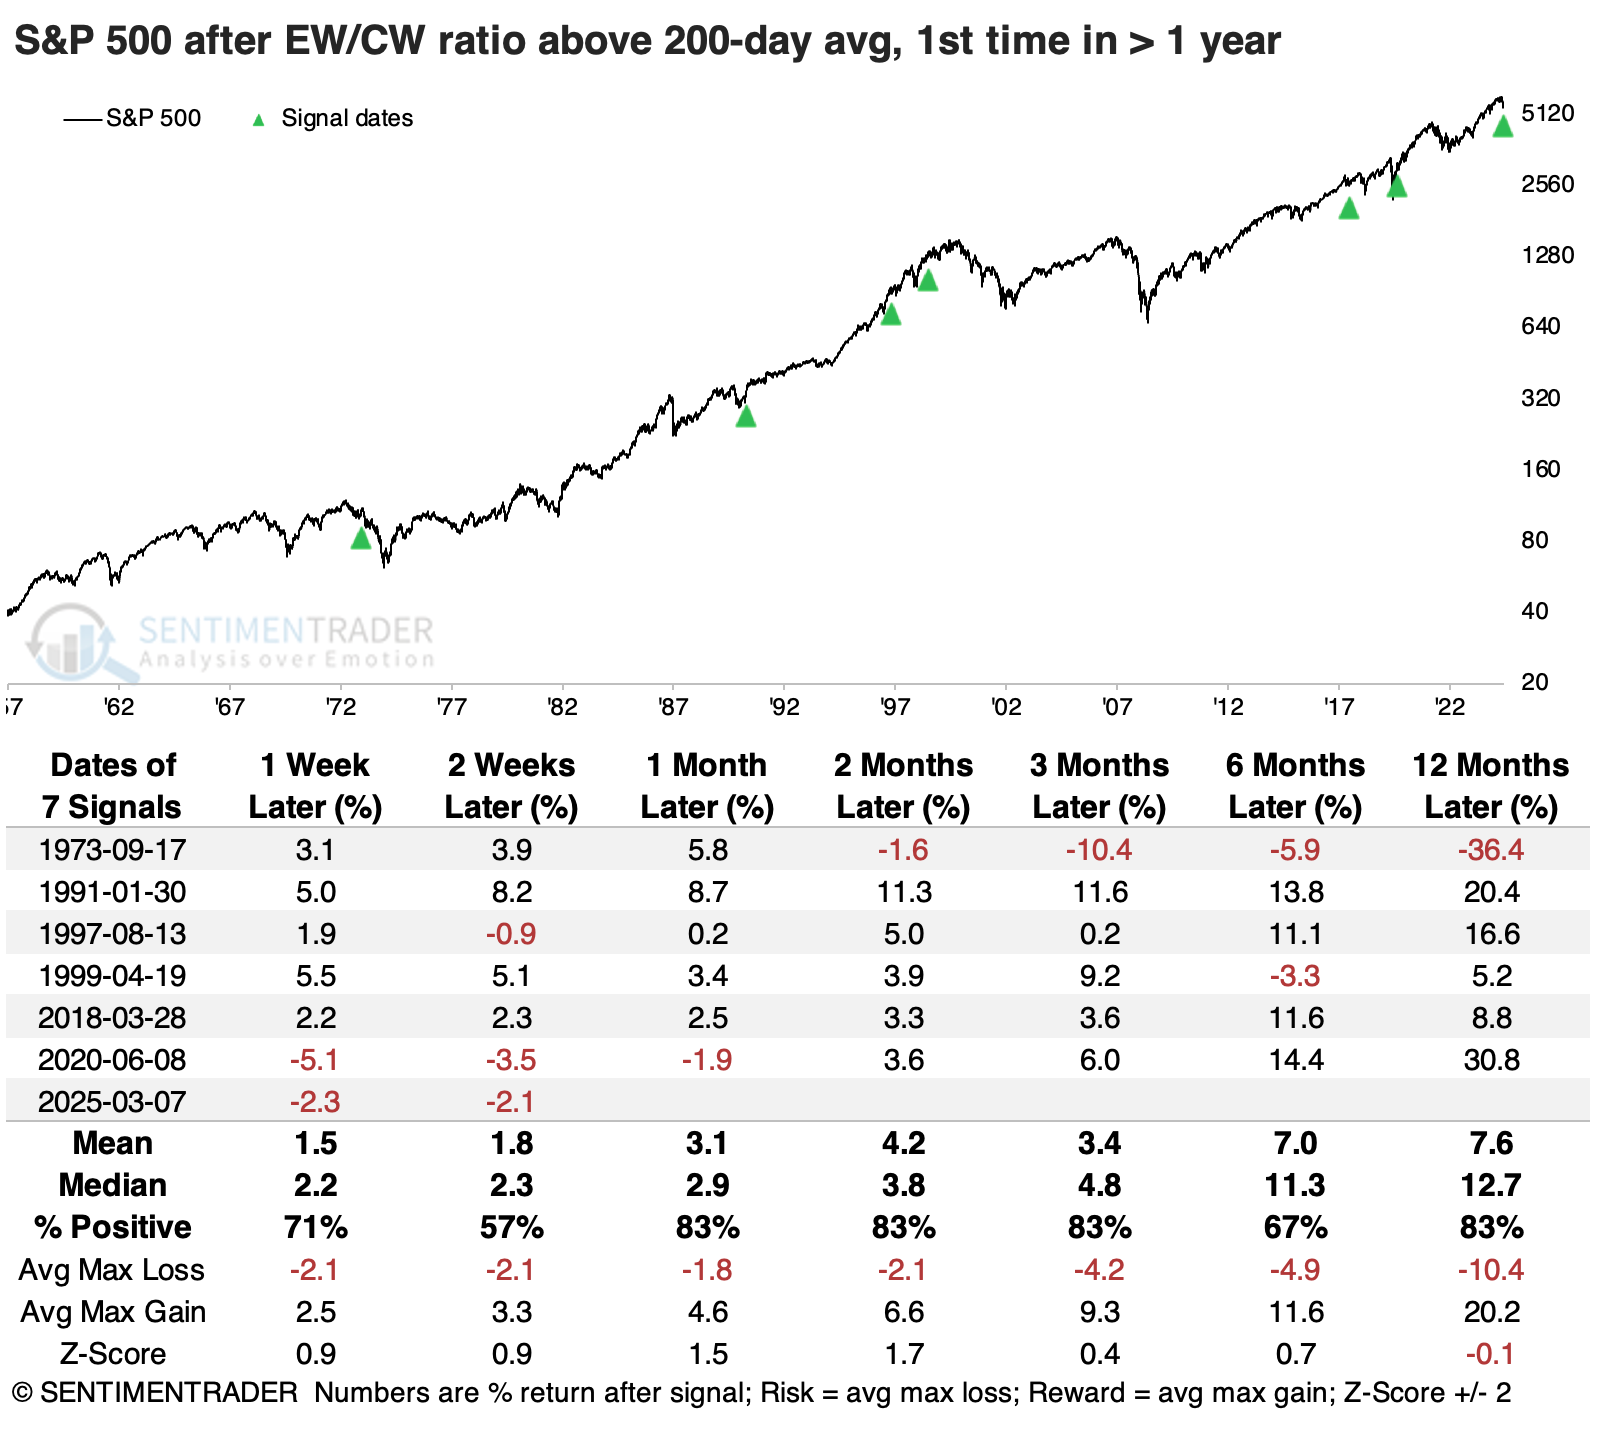
Investors have long been waiting for a time when the average stock, or really even any index, can beat the venerable S&P 500. This year, they've finally found some vindication. The hard part is that it has been tough to outperform the capitalization-weighted S&P. When the equal-weight version of the index has climbed above its average over the last 200 sessions, it has tended to fall back on a relative basis.
It has been a generally positive sign for both versions of the index, though we have few precedents from which to judge. It has also been a good sign when developed markets have done relatively well. It shows mostly decent risk appetite among investors worldwide, which tends to persist.