
The Energy sector triggered a breadth thrust

Key points
- The Energy (XLE) triggered a breadth thrust signal as its 10-day advance/decline ratio exceeded 2:1.
- Historically, similar thrusts occurring near 52-week highs have preceded weak returns, with the sector rising only 29% of the time over the next two months.
- However, long-term indicators are improving, suggesting underlying health despite short-term risks.
Energy stocks surge
Traders have flooded back into energy contracts, driving a rebound in energy stocks, fueled by geopolitical tensions and growing interest in commodities generally.
Anyone around longer than a generation may remember a major speech from President Bush about weapons of mass destruction in the Middle East and the subsequent return on energy stocks. There are more than a few rhymes in recent days.
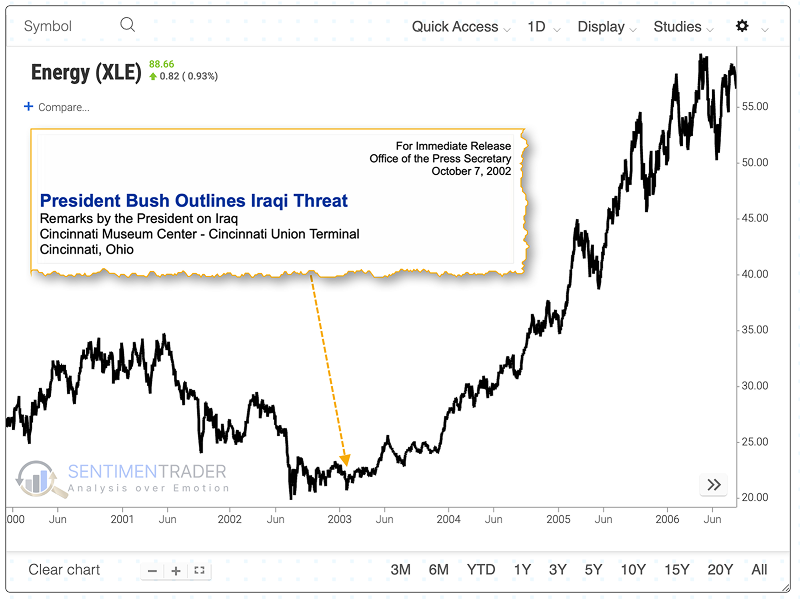
Investors seem to be anticipating a repeat of that scenario.
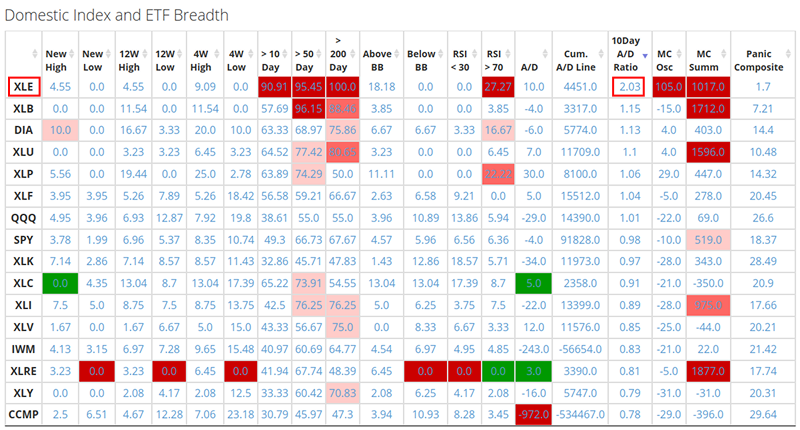
The 10-day advance/decline ratio for energy stocks broke above 2.02. This means that over the past 10 days, the number of advancing stocks held by the XLE fund was more than double the number of declining stocks. This is a stark reversal from the situation just a few weeks ago. As shown below, such signals occurring near highs often bring bad news. The last signal triggered in March 2025 led to a -11.5% decline over the following month.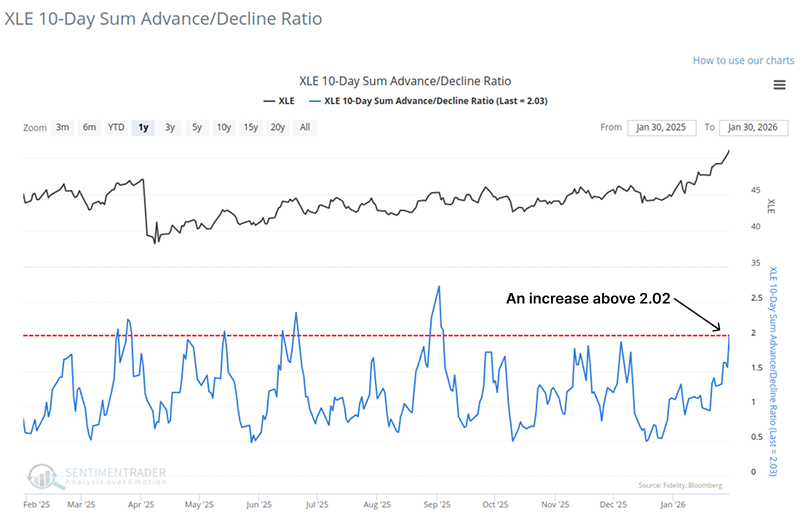
Subscribers can view the 10-day advance/decline ratio indicator under the "Focus" section of the Market Breadth page.
If you would like to save a copy of the breadth thrust signal to your Backtest Engine favorites, please click here.
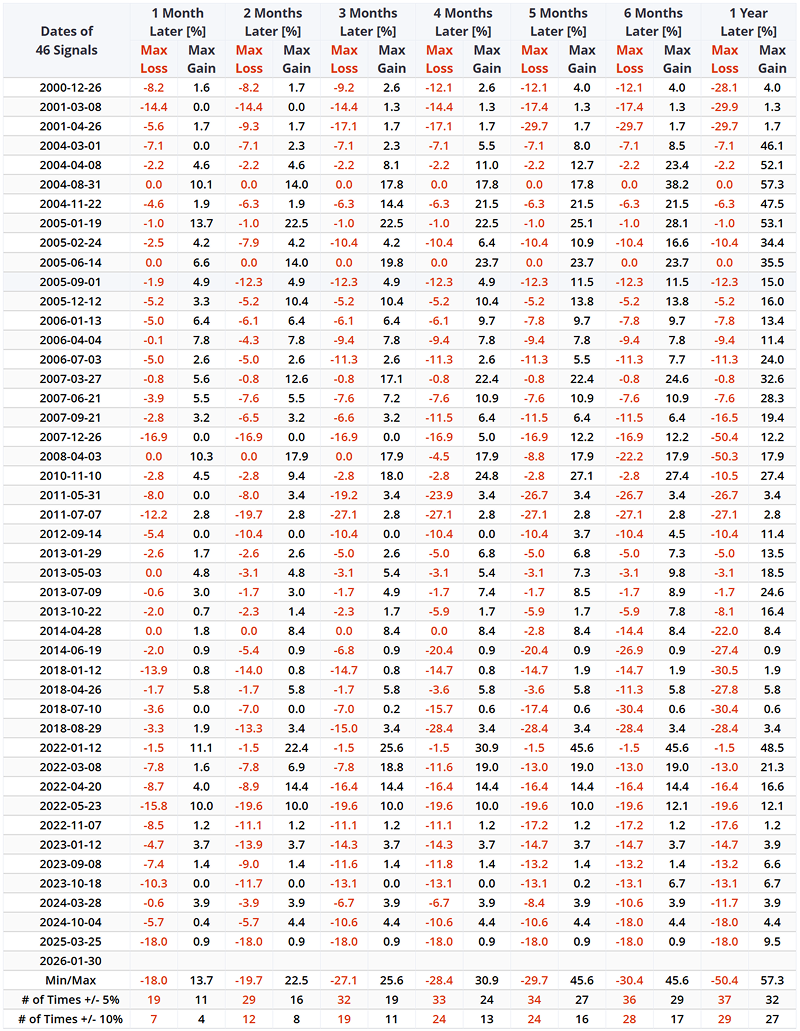
Similar breadth expansions precede negative returns
The Backtesting Engine 2.0 demonstrates XLE's performance following similar cycles. These cycles refer to broad-based rallies in the energy sector within 5% of its two-year highs. In the subsequent months, the fund had less than a 50% probability of rising, and many of these trades ultimately ended in failure.
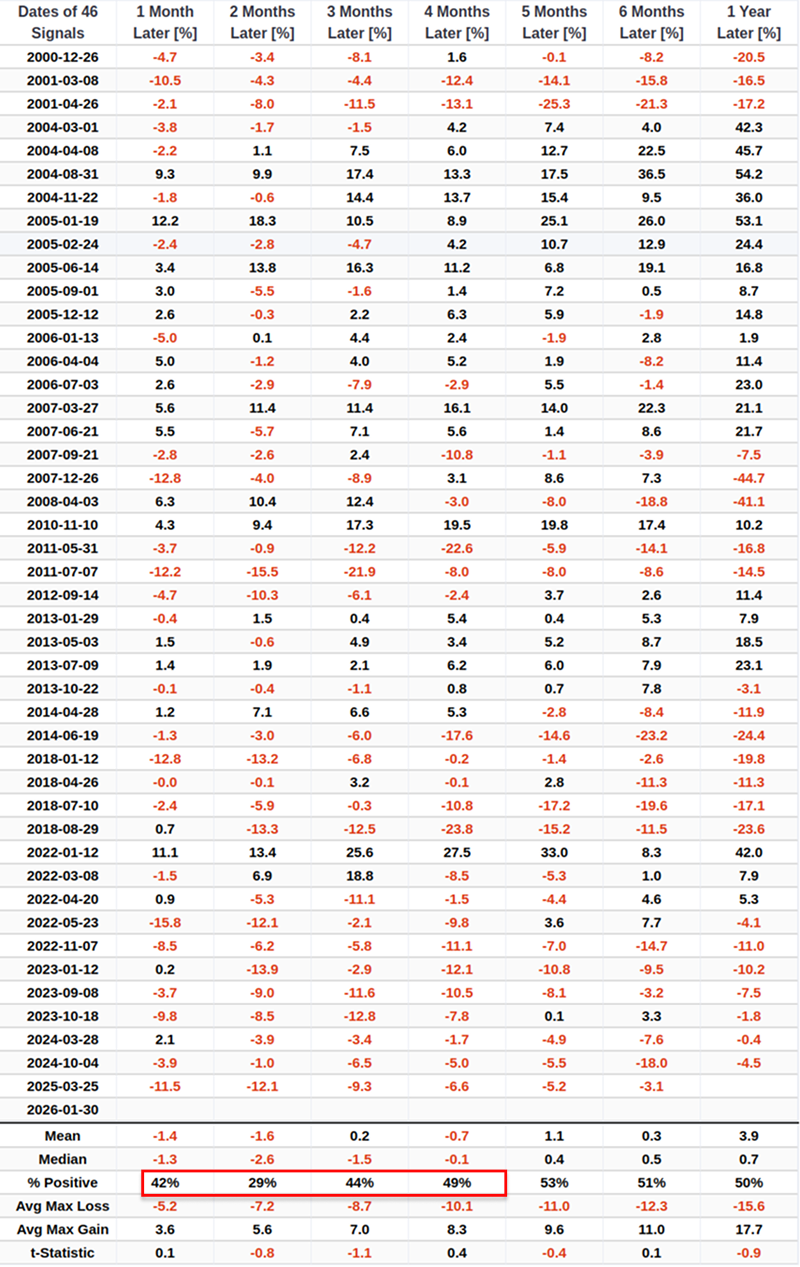
These signals frequently face substantial and frequent maximum drawdowns within a year, often requiring investors to endure significant unrealized loss pressure.
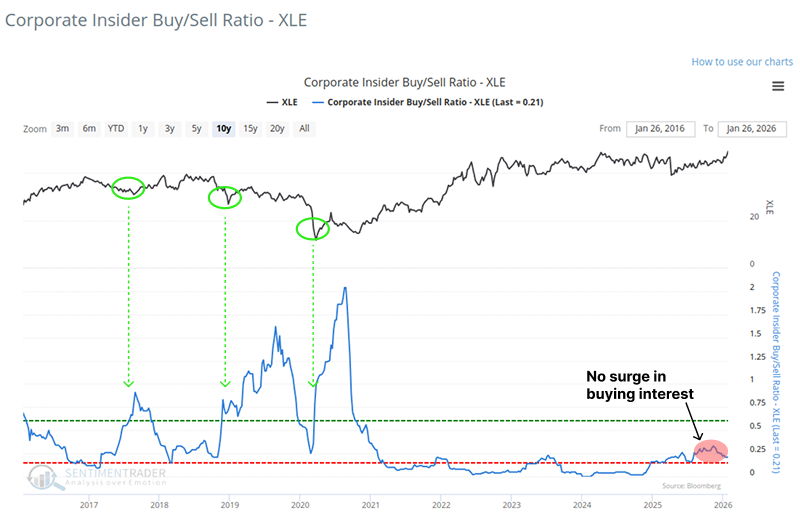
More concerning is that insiders at energy companies do not seem keen on buying shares. While the insider buy/sell ratio is rising slowly, it has barely moved out of depressed territory. Before several major lows in XLE, the buy/sell ratio was above 0.5, whereas currently, it is only half that level.
It's not all bad news
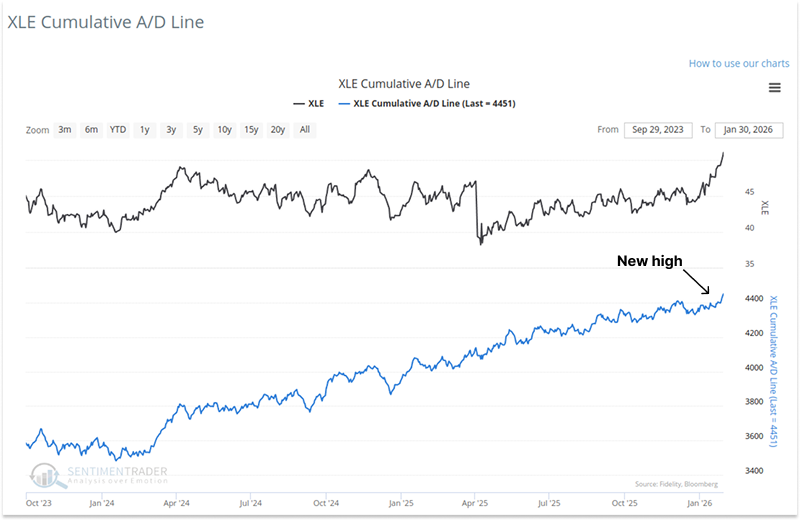
Perhaps most impressively, the cumulative advance/decline line for XLE components has just hit an all-time high. This indicator has been climbing steadily since spring 2024, even as the XLE fund itself stagnated. This suggests broad interest in the sector, which is typically a positive sign for sustained gains.
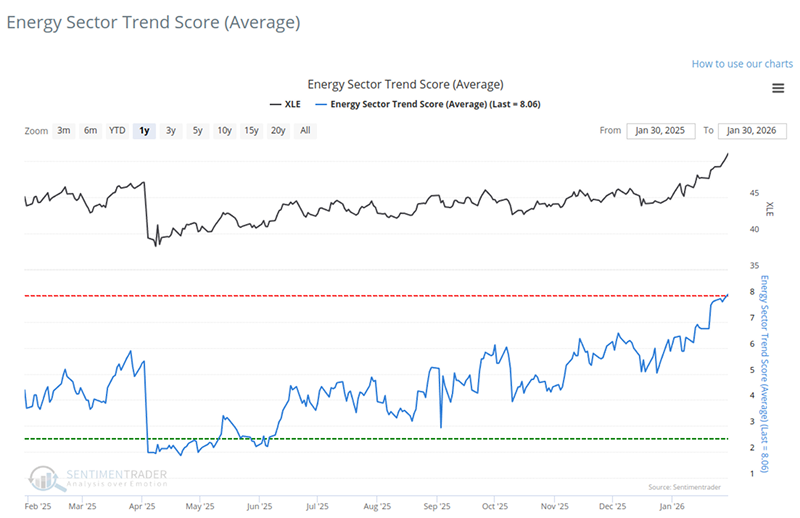
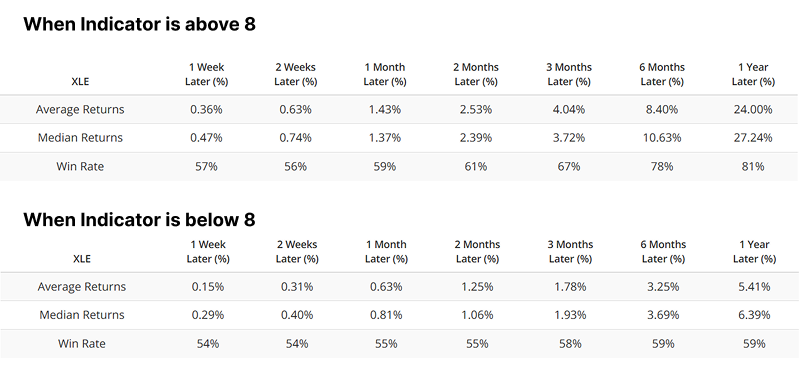
These positives will take more time to play out. XLE's trend score remains high. Currently, all trend-following indicators are in healthy territory. In recent years, XLE has performed better when at least 8 indicators are positive, and it is currently hovering around that threshold.
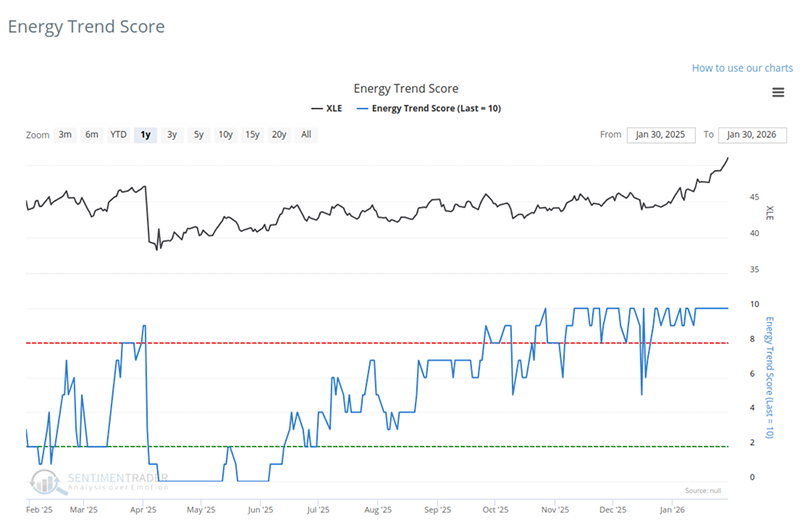
Last week, the average trend score for XLE stocks finally climbed above 8. The chart below shows that when the average trend score for stocks in this sector reaches above 8, XLE's average returns double.
What the research tells us...
The Energy sector triggered a breadth thrust with advancing issues outnumbering decliners by more than 2-to-1 over a ten-day period, indicating broad participation. However, similar signals occurring within 5% of all-time highs have historically led to weak returns and instability, particularly over the subsequent two months where the win rate drops to 29%.
Geopolitical developments or even rumors on social media can cause the energy sector to swing by several percentage points daily, a risk that is currently elevated. The sector has indeed shown positive signs, such as record-high breadth following April 2025's panic readings and rapid improvement in trend scores. Yet over the past 26 years, energy investors attempting to capture sudden momentum have often faced setbacks. The sector lacks a strong track record for sustaining gains seen in recent weeks. Typically, this failure occurs immediately. Should bulls continue to push the sector higher, XLE would have a better track record for sustaining gains over the long term. Bulls should closely monitor developments in the coming weeks.