
The energy sector triggered a breadth thrust

Key points:
- The S&P 500 Energy sector triggered a breadth thrust signal
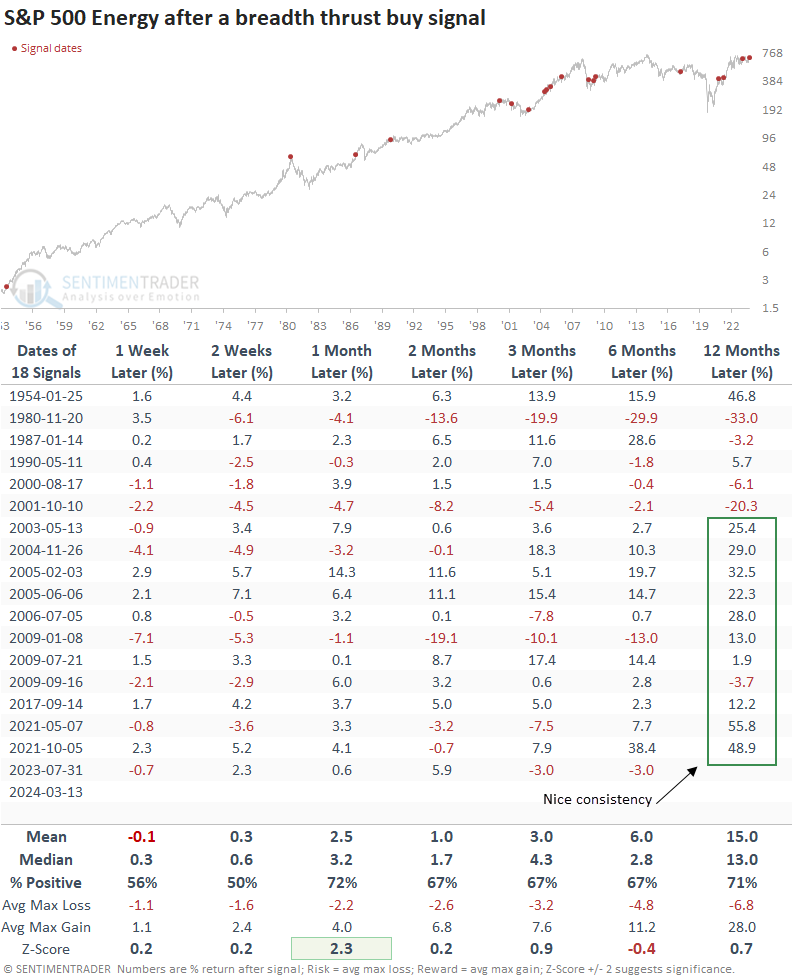
- Similar thrusts preceded a 72% win rate over the subsequent month
- Seasonality and a favorable trend in crude oil strengthen the case for additional upside momentum
Energy stocks are surging, triggering a breadth thrust
Investing in energy stocks is challenging, largely due to crude oil's inherent volatility, which is profoundly influenced by geopolitical factors and governmental policies worldwide.
Because of the volatile nature of oil and oil-related stocks, price momentum and breadth-based signals, which we routinely share for broad indexes and other sectors, tend to produce less-than-stellar outcomes for the energy sector, similar to the commodity-influenced materials sector, a subject that Jason discussed in his research note on Wednesday.
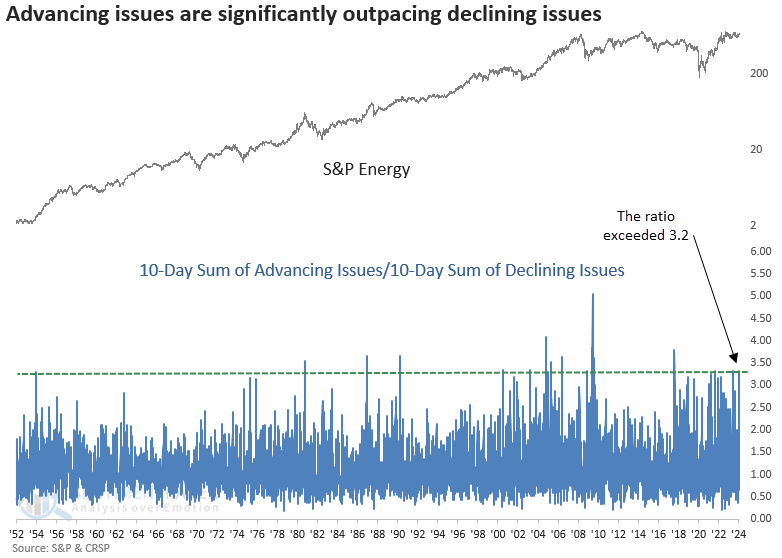
Over the prior ten sessions, the sum of advancing issues outnumbered the sum of declining issues in the S&P 500 energy sector by a ratio of 3.32 to 1, triggering a breadth thrust buy signal.
The previous signal was observed on July 31, 2023, after which the sector rallied 5.9% over two months. If you recall, that date coincided with a peak in the S&P 500, with the world's most benchmarked index falling 6.3% over that same period. Cue the scary music.
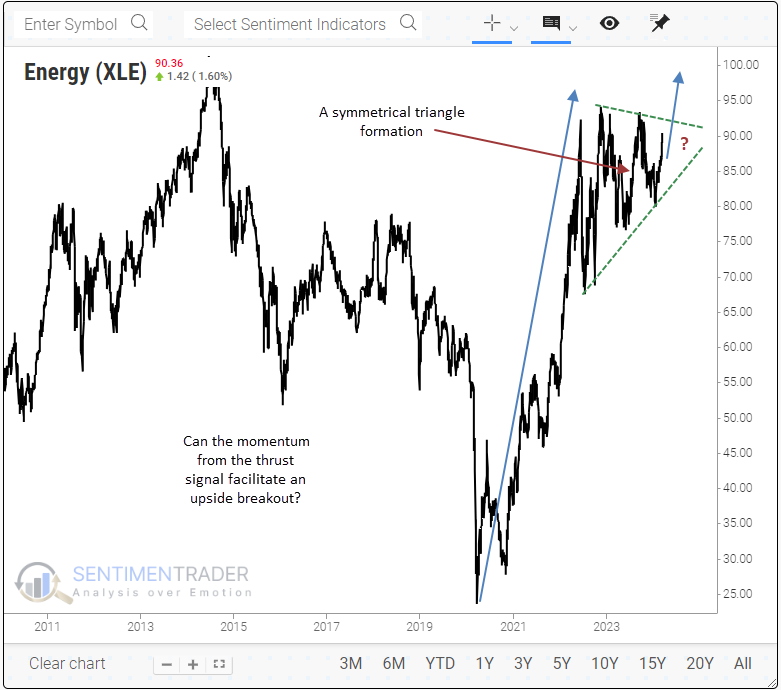
From a technical analysis perspective, the energy sector has formed a symmetrical triangle. Typically, this pattern breaks out in the direction of the preceding trend, which, in energy's case, was a substantial uptrend from 2020-22.
Similar long-term trend conditions preceded a positive outlook for stocks
Whenever the S&P 500 energy sector registers a breadth thrust, the positive price momentum for the group tended to persist over the subsequent month, with 15 of 18 precedents showing a gain at some point over that horizon.
Should the consolidation over the last year-plus in the energy sector be a pause that refreshes an uptrend, then the new thrust signal could act as a positive catalyst for an upside breakout. If that scenario unfolds, the long-term results could resemble the 2003-2006 or 2021 signals.
A favorable commodity trend
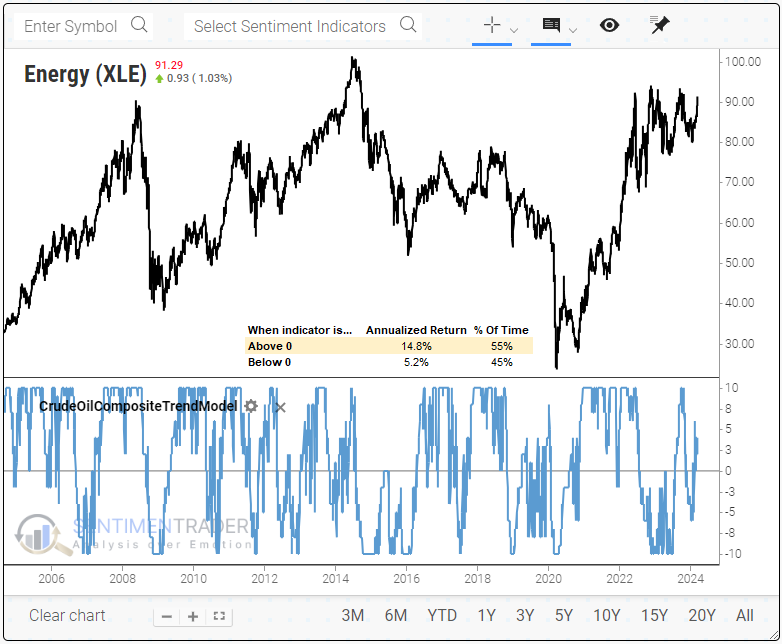
My composite trend model for crude oil shows 4 out of 10 indicators with a positive profile. When the score is above zero, the S&P 500 energy sector annualizes at 14.8%, compared to a modest 5.2% when it resides below zero.
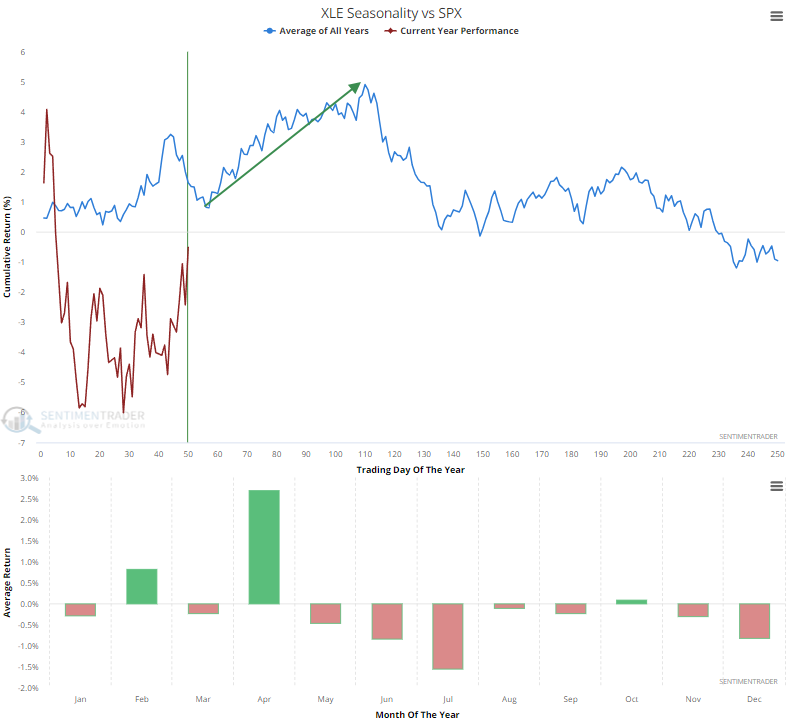
Seasonality
The energy sector is about to enter the most favorable month of the year for absolute and relative returns. Our seasonality charts have been upgraded to include a feature that lets you compare ETFs to a benchmark like the S&P 500, enabling the assessment of relative trends.
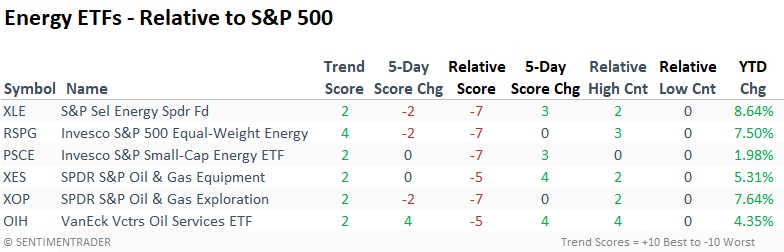
Absolute and relative trends
Absolute and relative trend scores for energy ETFs look unattractive. This is not surprising, given that the indicators comprising the composites are predominantly long-term. Should the positive expectancy from the thrust signal come to fruition, the trend scores will most likely improve.
The Oil Services ETF (OIH) has registered a one-month high in four out of five sessions.
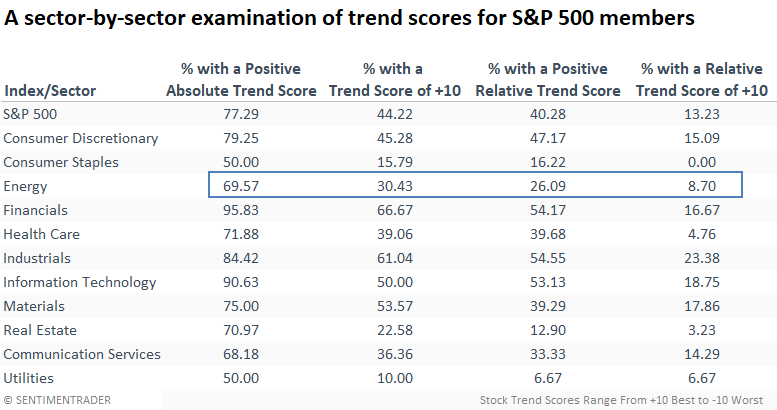
Drilling down to individual stock trends for the energy sector provides a similar message. Absolute and relative trend scores are less than desirable, ranking in the bottom third compared to other groups across all categories.
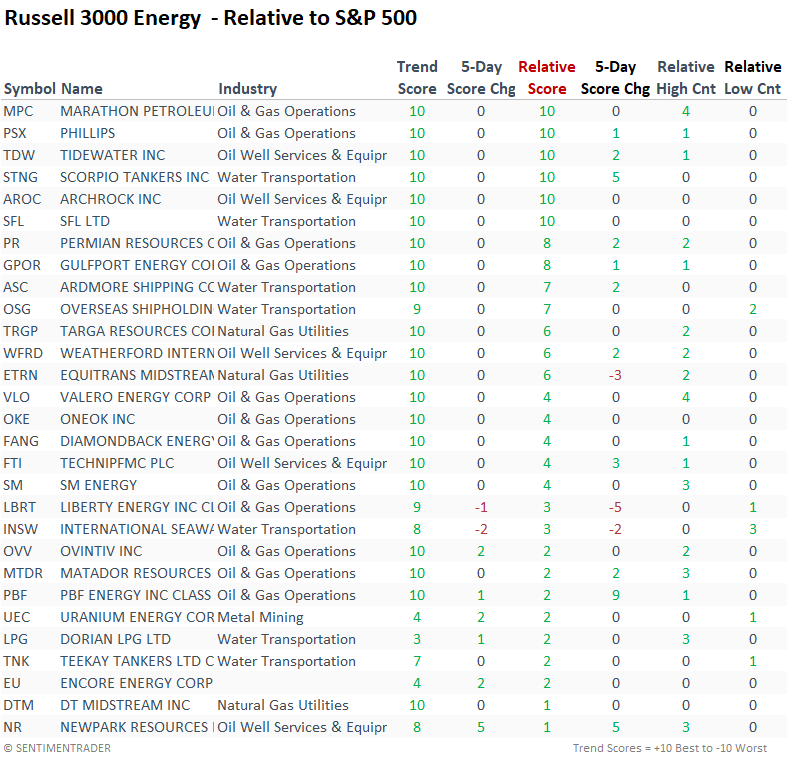
Despite the energy sector's weak overall trend score profile, Marathon (MPC) and Phillips (PSX) maintain perfect absolute and relative trend scores.
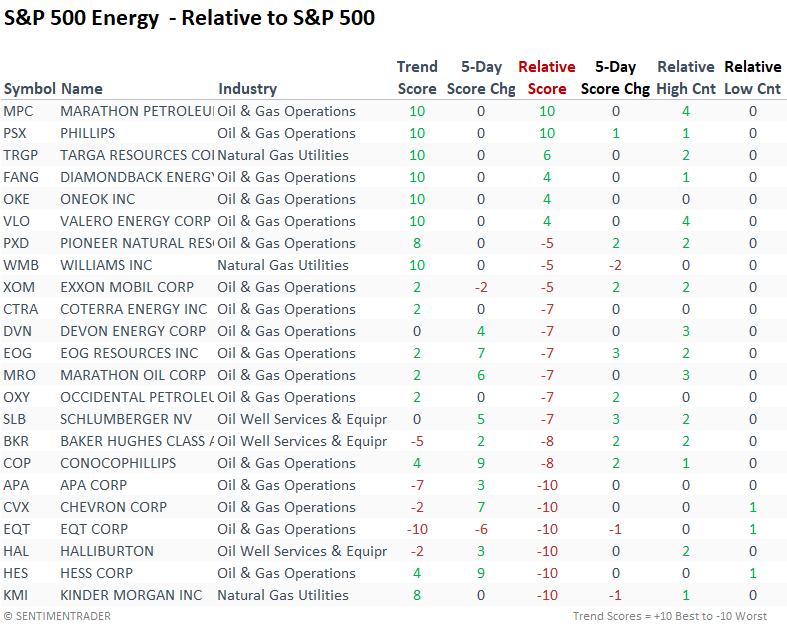
The following table contains all Russell 3000 energy stocks with a positive relative trend score versus the S&P 500. Oil and gas operations companies account for a significant portion of the total.
What the research tells us...
Whether the recent price action in the energy sector signifies a catch-up trade from a relative underperformer or marks the beginning of a more significant rotation remains unclear. In the near term, the breadth thrust signal suggests the bullish price momentum in energy stocks could persist, with 15 of 18 precedents showing a gain over the subsequent month. Adding further credence to upside follow-through is bullish seasonality and a positive trend for crude oil. Substantial sector rotations tend to occur around significant inflection points for the broad market, not during steady uptrends like now, which is why I view any allocation to energy as a short-term rental rather than a buy-and-hold situation.