
The energy sector leads the 52-week lows list

Key points:
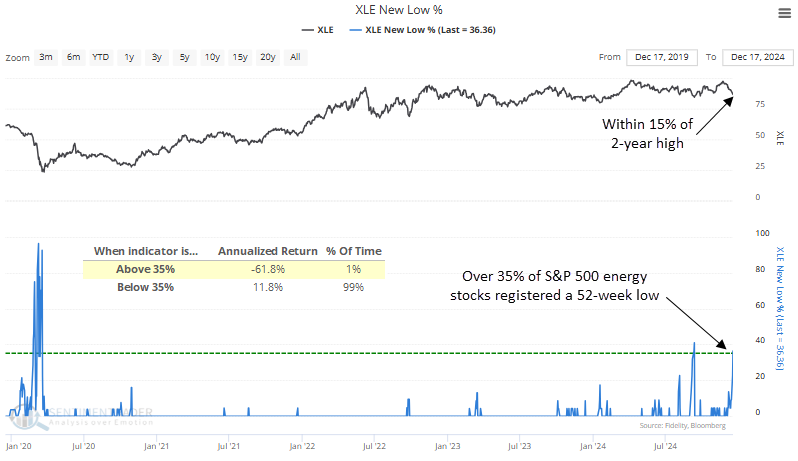
- More than 35% of S&P 500 Energy sector stocks registered a 52-week low
- Similar expansions in lows produced a slight upward bias in the sector over the next three months
- Although the sector could bounce, relative performance versus the broad market was disappointing
Does the oversold condition in the energy sector suggest we should position for a bounce
In my research report, a historic divergence between the energy sector and crude oil, I highlighted the substantial decoupling between the S&P 500 Energy sector and crude oil, which suggested energy stocks would decline, closing the gap with the commodity.
Three weeks after publishing that report, the S&P 500 Energy sector has fallen 10% as of the close on 2024-12-17.
The steep pullback has caused market breadth indicators for the sector to reflect oversold conditions. For instance, more than 35% of stocks reached 52-week lows, a threshold often seen during pronounced downtrends, resulting in an annualized return of -61.8% when breached.
However, during this latest occurrence, the sector traded within 15% of a multi-year high, a stark contrast from most precedents contributing to the highly unfavorable annualized returns.
With that in mind, let's assess whether a spike in the energy sector's 52-week lows within 15% of a multi-year high represents a mean-reversion opportunity or a falling knife trap.
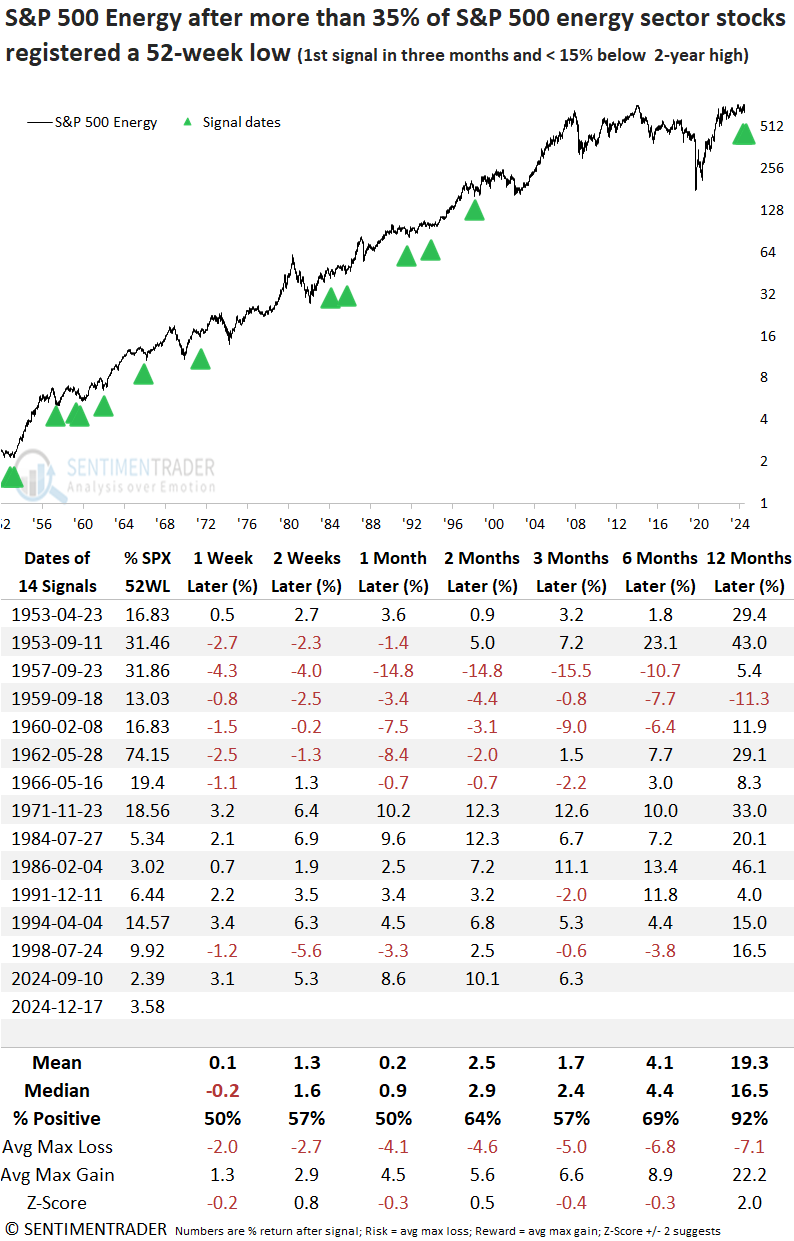
Similar expansions in 52-week lows preceded a slight upward bias over the medium-term
Whenever over 35% of S&P 500 Energy sector stocks hit a 52-week low with the index no more than 15% below a multi-year high, the sector demonstrated a slight tendency to recover in the ensuing three months. Within a year, the energy sector rose in all but one case, implying that a spike in 52-week lows within the vicinity of a high eventually paved the way for a recovery.
What explains the stark difference in performance pre- and post-1971? A closer look at the percentage of 52-week lows for the S&P 500 provides clarity. Before 1971, the broad market faced significant pressure, as evidenced by a high percentage of S&P 500 stocks recording 52-week lows (second column). This pressure eventually extended to the energy sector, where a surge in 52-week lows led to a sharp price decline or catch-down phase. In contrast, post-1971, the broad market pressure was mainly non-existent. Therefore, the oversold condition in energy sparked an oversold rally.
Relative performance
Although the last three signals, including the September 2024 instance, exhibited solid outperformance against the S&P 500, the overall outlook was decidedly negative. Moreover, the one-year timeframe, which displayed excellent absolute returns and consistency, was disappointingly lackluster from a relative perspective.
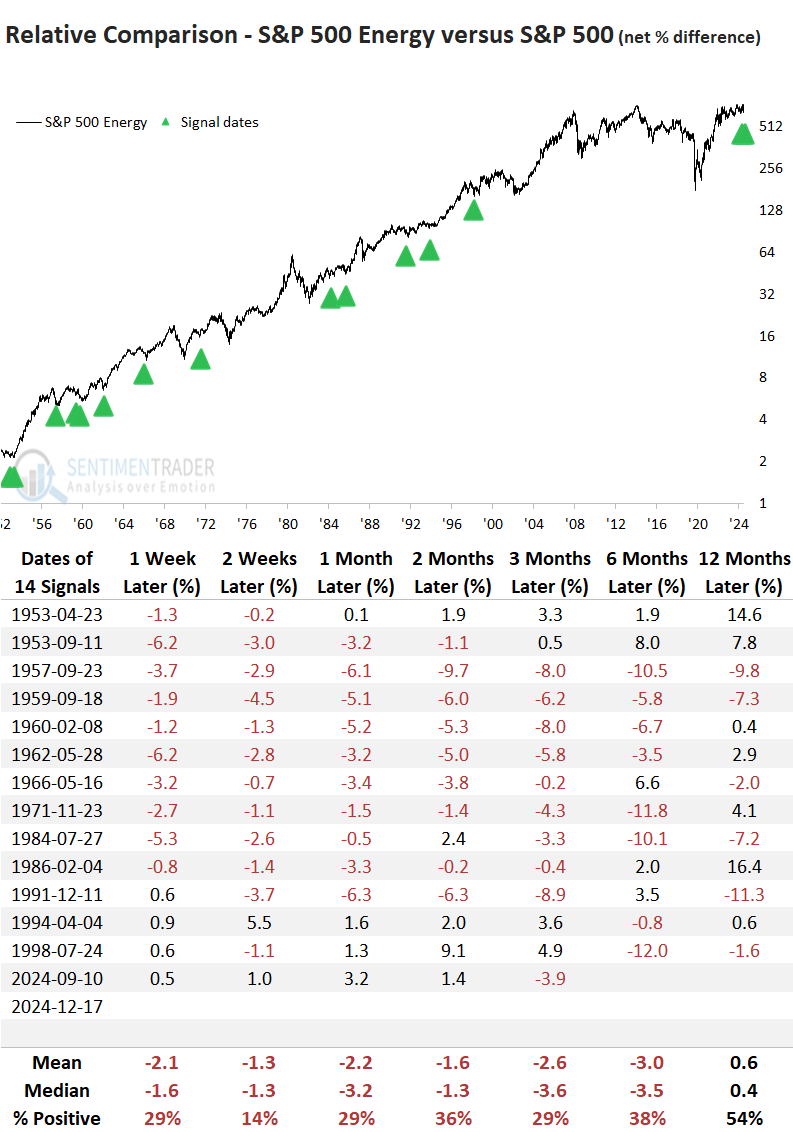
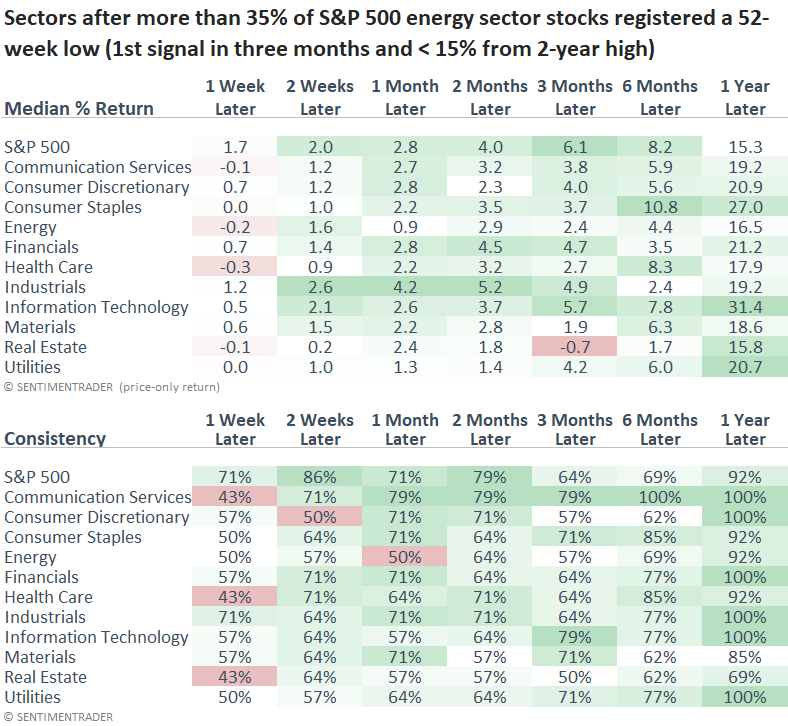
Following comparable spikes in 52-week lows for the energy sector, the broad market and sectors displayed excellent results. Before 1971, high levels of 52-week lows in the S&P 500 typically indicated a drawdown nearing its conclusion, leading to impressive subsequent returns. Post-1971, the spike in 52-week lows in the energy sector was unrelated to any systemic problem in the broad market. Consequently, the overall market continued its uptrend, a scenario most likely similar to now.
A more extensive view of market breadth conditions
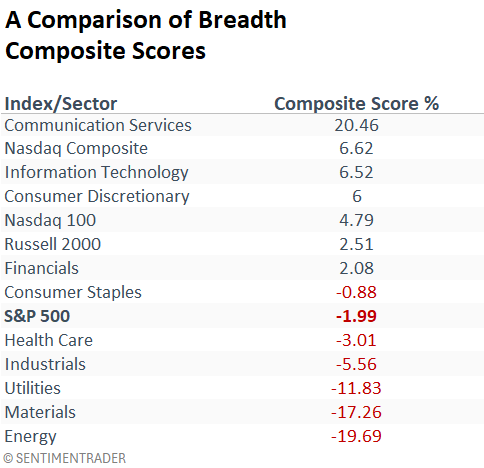
The following table contains a breadth composite score for indexes and sectors. It combines the percentage of stocks above their 10, 50, and 200-day averages, with the spread between stocks registering a 21, 63, and 252-day high or low.
I mention this because the composite score for the energy sector declined below -15%, reaching an oversold reset condition. Consequently, should the score rise above 22% within ten sessions of the oversold condition, a trading model would trigger a mean reversion buy signal.
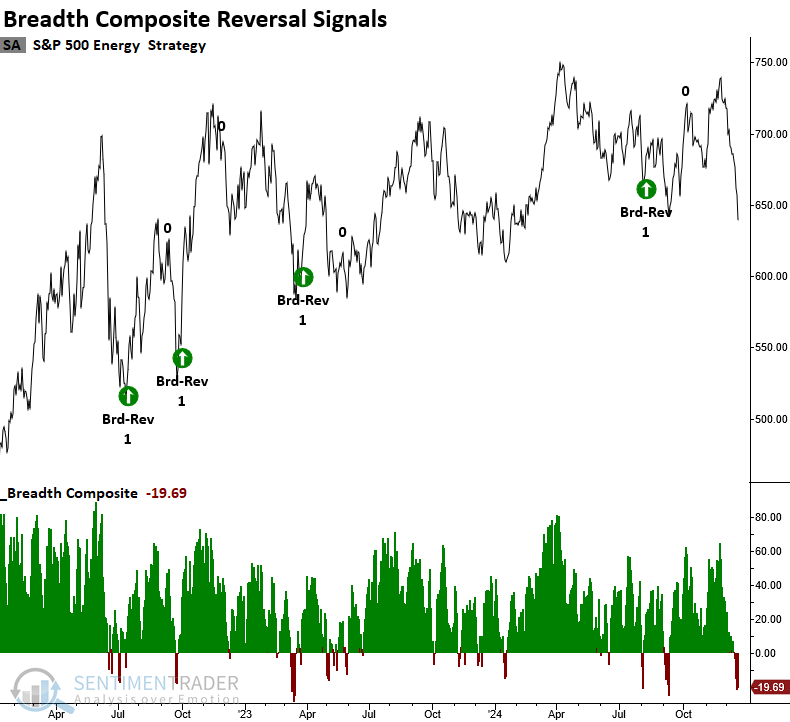
For those interested in the breadth composite reversal system, this chart highlights the signals within the energy sector over the past few years.
With the sector primarily confined to a broad trading range, reversal signals, while profitable, have required a shorter time frame to lock in gains. Identifying a market's direction-uptrend, downtrend, or sideways-is critical to determining how to approach trades.
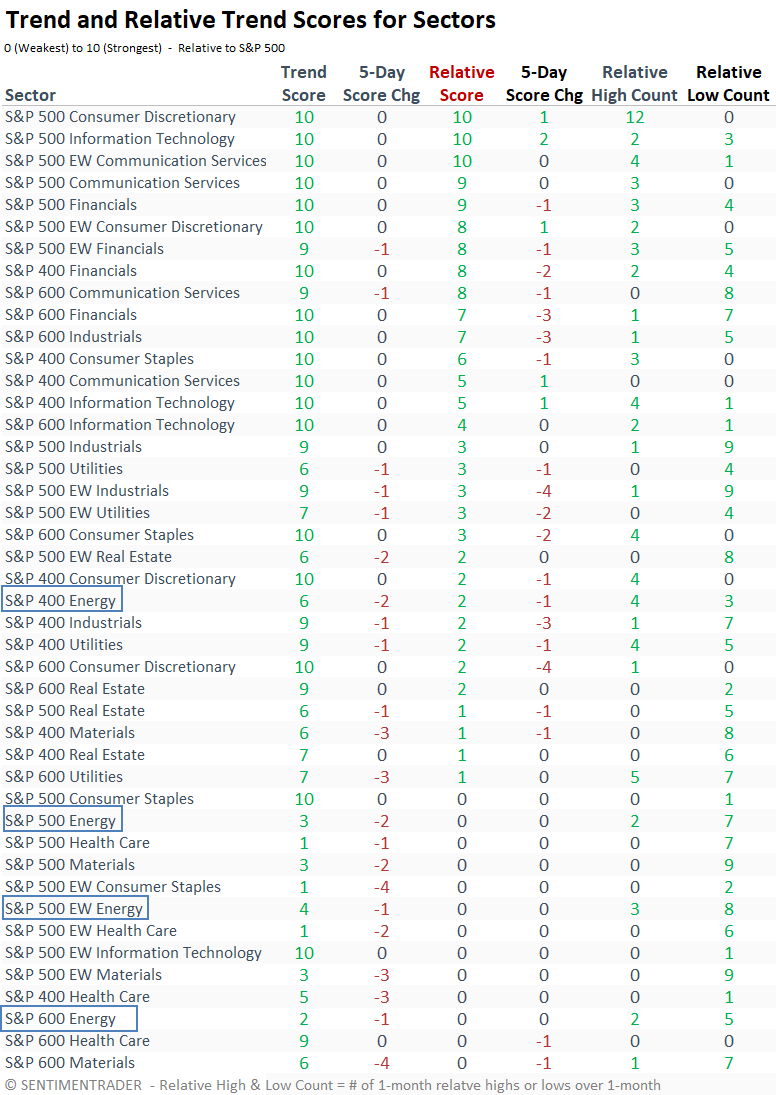
Trend Scores
From a trend score perspective, the energy sector looks unfavorable. That's not to say one can't make money in individual stocks. I've highlighted the oil and gas transportation sub-industry as a group that has bucked the overall trend in the energy sector.
Because the sector lacks a broad tailwind, I recommend a trade-to-rent rather than an investment if you're patiently waiting for a mean-reversion bounce.
What the research tells us...
As the year draws to a close, the energy sector- one of 2024's persistent underperformers-has been hit by a common Q4 phenomenon: institutional investors offloading laggards to clean up their portfolios. Adding to the pressure is a pro-drilling incoming administration, leading to intensified selling and an oversold condition, especially compared to other indexes and sectors. On Tuesday, 52-week lows spiked above 35%, with the industry in correction territory. Comparable scenarios have led to a bounce in the sector, especially more recent precedents. However, from a relative perspective, the group mostly underperformed the broad market. If you're like me and not a fan of catching a falling knife, a lower-risk opportunity could develop should my breadth composite reverse to the upside.