
The energy sector conundrum

Key points
- The energy sector is showing strength, triggering favorable signals for 6 to 12 months out from several useful breadth indicators
- However, one breadth indicator is signaling an overbought warning
- Also, seasonality remains a potential concern through late October
Strength often begets strength in XLE… but not always right away
The Energy Select Sector SPDR ETF (ticker XLE) has rallied 17% since the end of May. This strength has garnered a lot of attention and has many investors wondering if it's time to jump in - or if it's already too late to take the plunge. In short, the evidence is mixed.
On the positive side, several breadth indicators have given favorable signals. The chart below displays those times when the 10-day moving average of the XLE Breadth (% > 50 Day Avg) indicator has crossed above 99%. The most recent signal occurred on 2023-08-03.
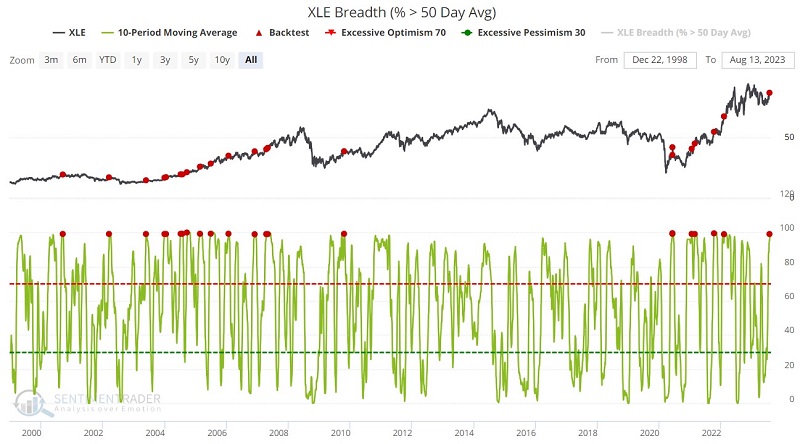
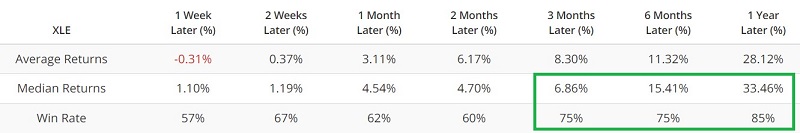
The tables below display subsequent XLE performance.
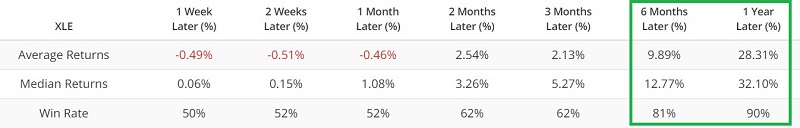
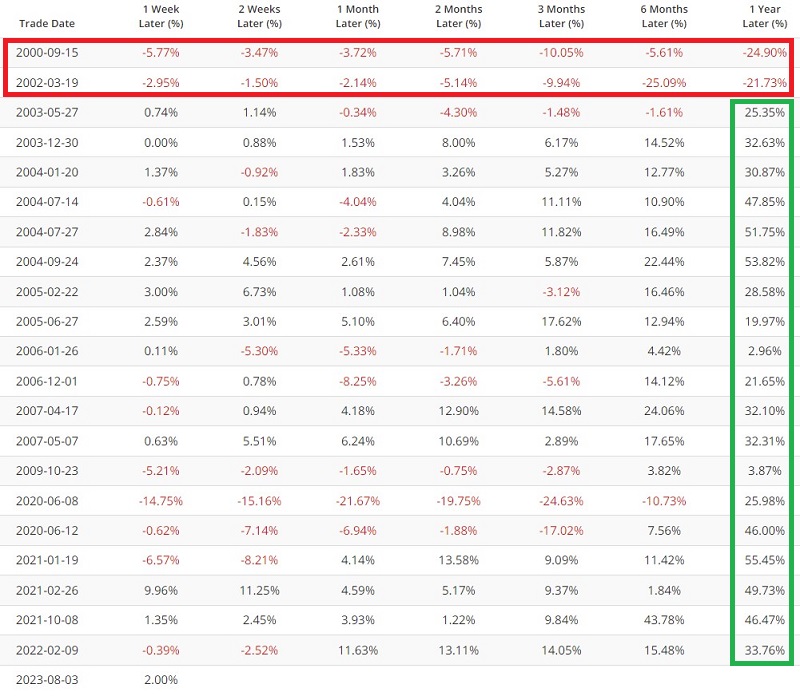
In the tables above, we can note that twelve-month returns have been very robust. We can also note, however, that 1-week to 6-month returns have varied widely, so a signal does not indicate "smooth sailing for the next twelve months." Lastly, note that the 2000 and 2002 signals were followed by 12-month declines of over -20%, so significant twelve month returns is never assured.
XLE components above Upper Bollinger Band also flash green
The chart below displays when the percentage of XLE components stocks above their respective upper Bollinger Band crossed above 70%. The most recent signal occurred on 2023-07-12.
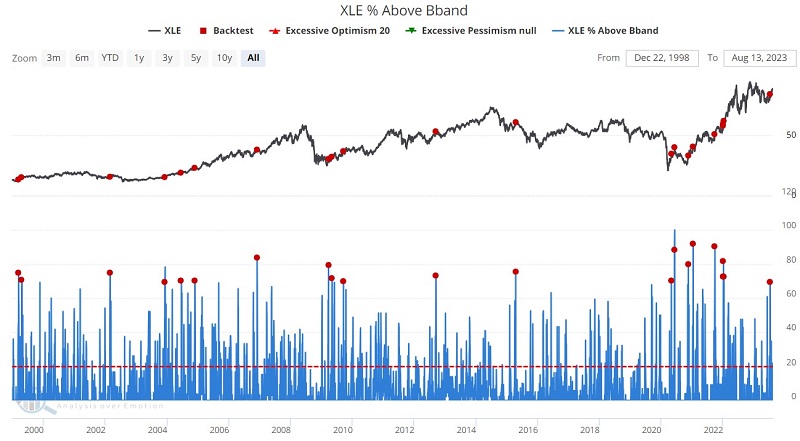
The tables below summarize performance.
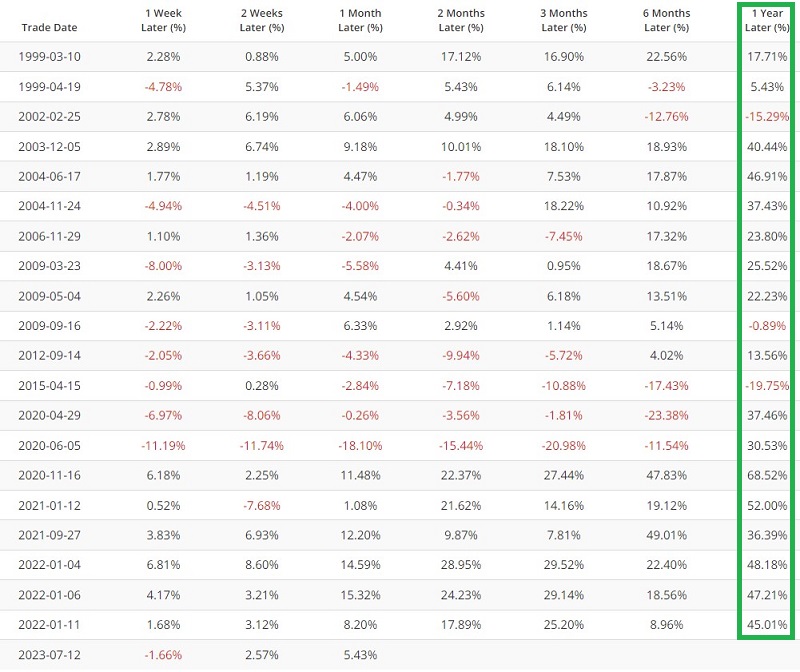
The same comments above apply here. Overall, three to twelve-month returns (particularly twelve months returns, with a median return of +33.46%) are excellent. But once again, interim results can show significant declines along the way, and 1-year returns have shown declines of -15.19% (2002-02-05 signal) and -19.75% (2015-04-15 signal).
So these signals appear to offer bullish weight of the evidence and suggest that investors look for an opportunity to get on board. However, deciding exactly when that moment may be is complicated by a couple of other factors.
Meanwhile, the McClellan Summation Index flashes yellow
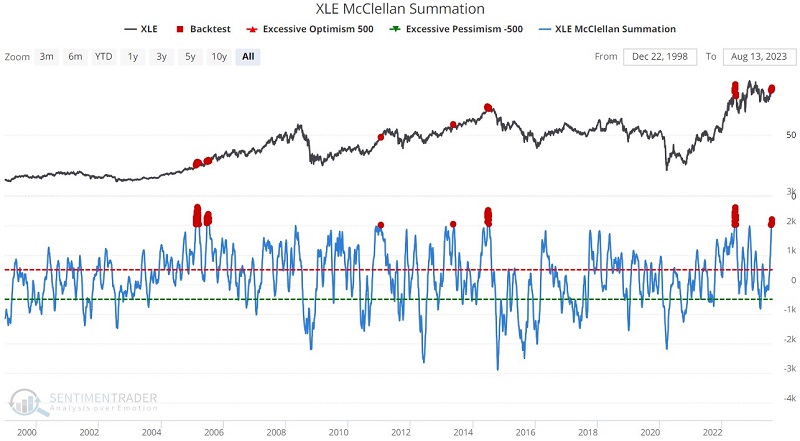
The chart below displays all days when the XLE McClellan Summation Index exceeded 2,000. This indicator was above 2,000 every day from 2023-08-01 through 2023-08-10.
The table below summarizes XLE performance following previous signals. The good news is that six and twelve-month returns were still decent. However, the key thing to note is the subpar results for 2-weeks to 3 months after a signal - with negative Average and Median Returns and Win Rates below 50%.
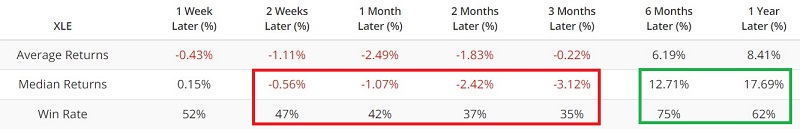
While this should not be considered a "precision market timing tool," it does suggest that waiting a while to make a significant commitment to the energy sector - rather than chasing the current rally - might make sense.
Seasonality remains a dark cloud
As always, seasonality is a summary of historical tendencies and not a roadmap. The chart below displays the annual seasonal trend for ticker XLE.
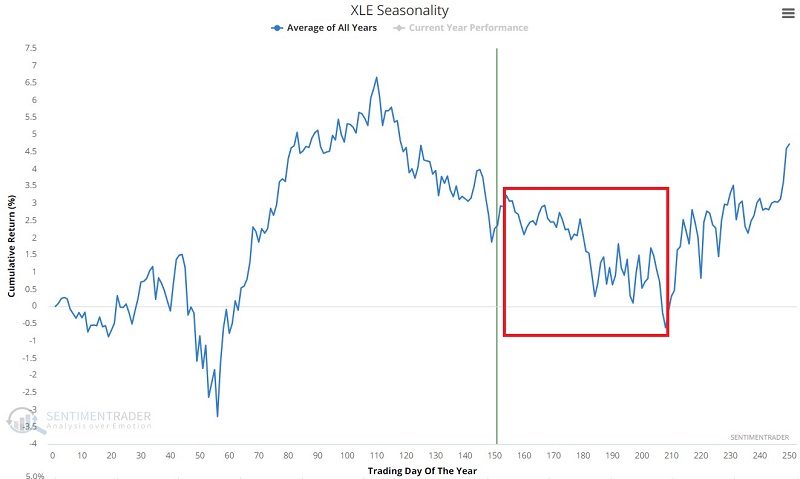
Note the upcoming unfavorable period that extends from the close on Trading Day of the Year (TDY) #154 through TDY #208. For 2023, this period extends from 2023-08-14 through 2023-10-30.
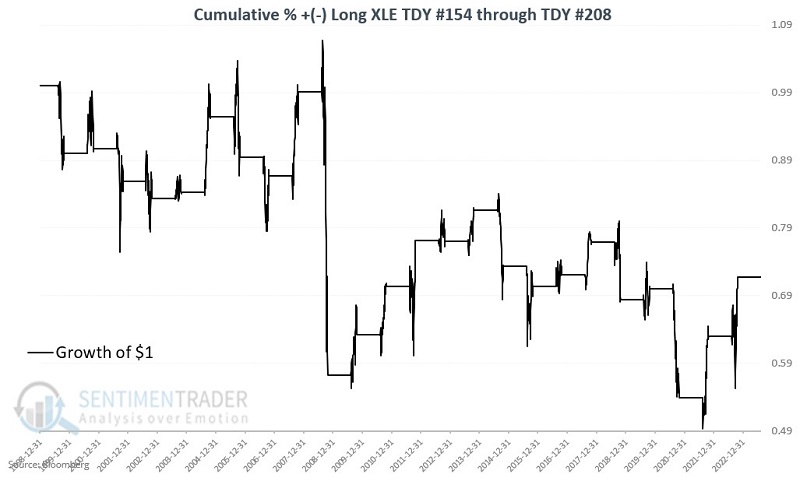
Historical XLE performance during this seasonal period has been decidedly mixed. The chart below displays the growth of $1 invested in XLE every year only during the TDY #154 through TDY #208 period. The cumulative result is a loss of -28.3%.
Despite the overall loss, it is essential to note in the table below that this seasonal period is not a "sure thing bear" for energy stocks.
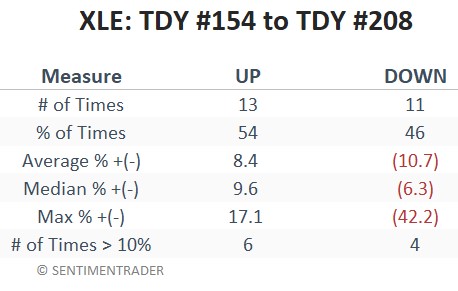
Note in the table above that this period:
- Showed a gain more often than a loss (54% to 46%)
- The Median gain is greater than the Median loss (9.6% vs. -6.3%)
- Showed more 10%+ gains than -10% losses (6 to 4)
The bottom line: XLE returns during this period are highly volatile and unpredictable.
What the research tells us…
Based on the first two indicators above, an investor anxious to establish a position in energy should not hesitate to do so. The only question is how big of a commitment to make.
Based on the second two indicators above, all others might be more inclined to fight the urge to chase the current rally and keep a close eye open for a buying opportunity closer to late October 2023.