Products
SentimenTrader Trading Tools
‍
Backtest Engine
My Trading Toolkit
Correlation Analysis
Seasonality
Market Prediction
Indicators & Data API
‍
Proprietary Indicators & Charts
Market Data API
Strategies & Scanner
‍
50+ Trading Strategies
Smart Stock Scanner
Smart Option Scanner
Research Reports
‍
Research Solutions
Reports Library
Free Resources
Simple Backtest Calculator
Simple Seasonality Calculator
The Kelly Criterion Calculator
Sentiment Geo Map
Public Research Reports
Education
Sentiment Indicators
Technical Indicators
Pricing
Company
About
In the News
Testimonials
Client Success Stories
Contact
Log inLoginSign up
< BACK TO ALL REPORTS

The energy sector advance-decline line breaks out to a new high

Dean Christians
2024-03-20
The S&P 500 energy sector advance-decline line closed at a new two-year high, generating a bullish divergence with the sector still hovering below its high. After similar signals, energy stocks rallied. Should history rhyme, the industry could be on the cusp of a massive base breakout.

Key points:

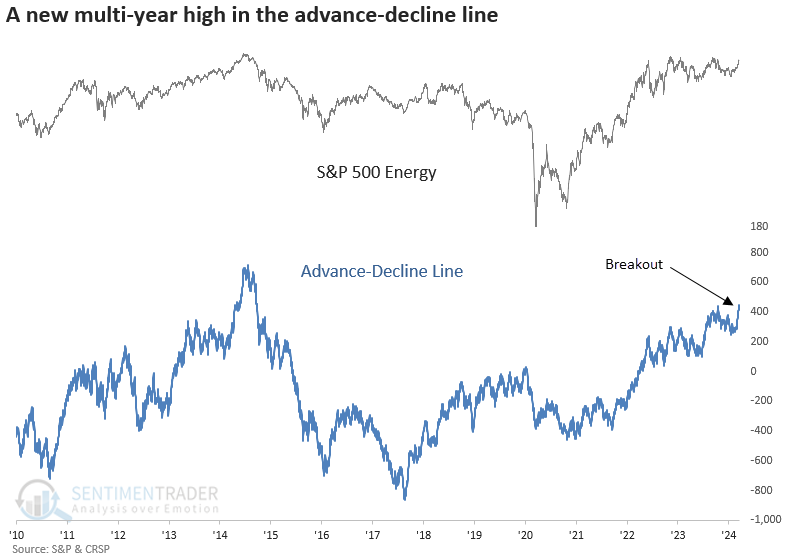
  • The advance-decline line for the S&P 500 Energy sector closed at a new multi-year high
  • At the same time, the S&P 500 Energy sector resides below its high, creating a bullish divergence
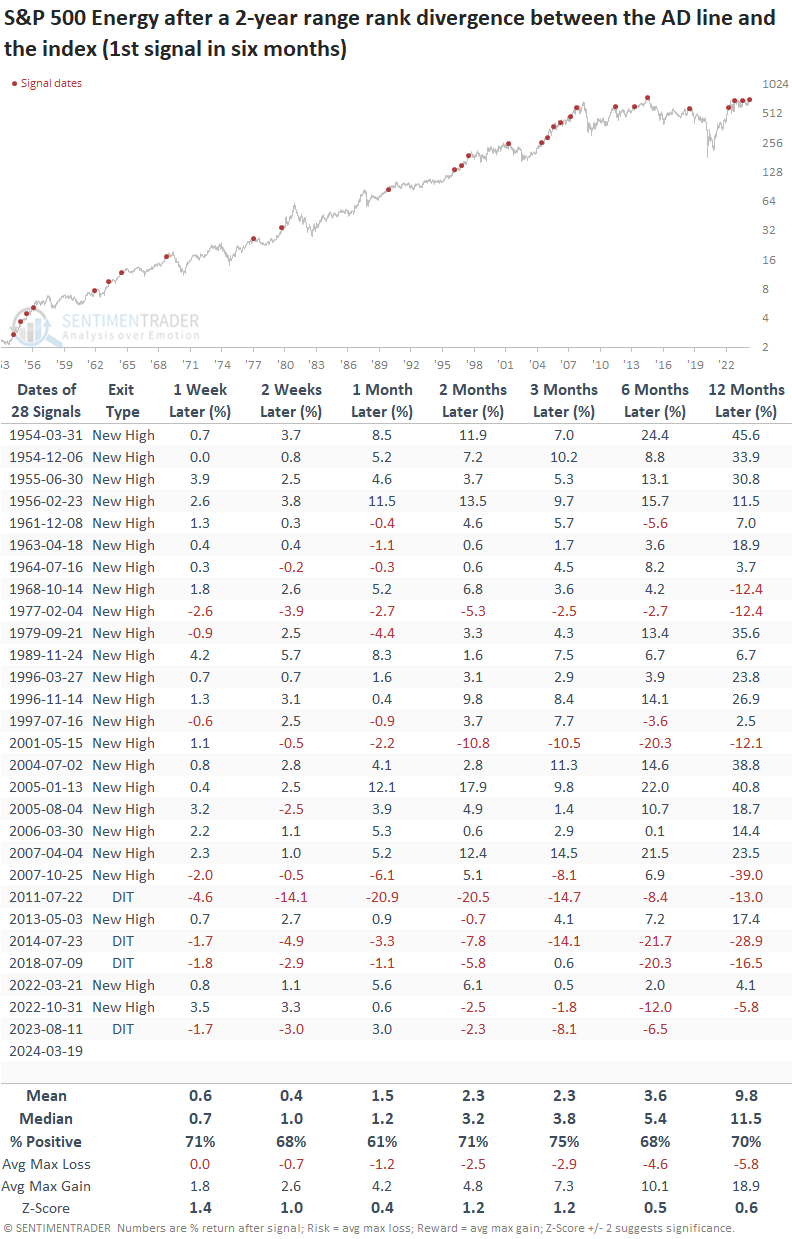
  • Similar disparities between the AD line and the index produced bullish outcomes for energy stocks

The granddaddy of market breadth indicators suggests a breakout in the energy sector

Last week, I highlighted a breadth thrust signal for the S&P 500 energy sector, suggesting that the group's bullish price action could persist over the ensuing month. Following a pause on Monday, the group catapulted to a fresh year-to-date high on Tuesday, propelling numerous market breadth indicators to new heights.

One of the indicators, the advance-decline line, concluded the session at a new multi-year high, marking a bullish divergence as the energy sector remains below its previous high. Usually, stocks enter a catch-up phase when the advance-decline line reaches a new high before a stock index.

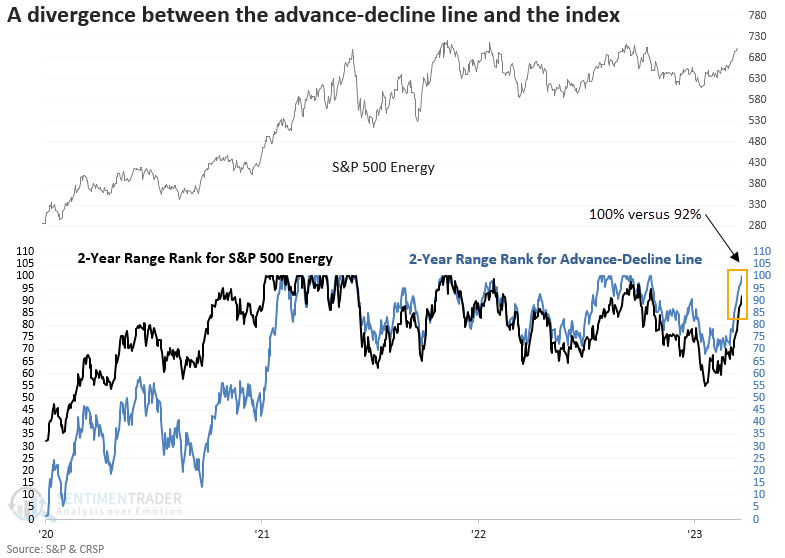
I applied a two-year range rank to both series to capture a divergence between the advance-decline line and the energy sector. The chart below shows that the AD line closed in the 100th percentile, indicating a two-year high. In contrast, the two-year range rank for the energy sector closed in the 92nd percentile, reflecting an index level below its two-year high but not far off.

Similar divergences between the AD line and the index preceded positive returns 

In instances where the S&P 500 energy sector advance-decline line reaches a two-year high, as the index ranks between the 90th and 99th percentile of its two-year range, the S&P 500 energy sector tends to rally over the subsequent year, with returns and win rates exceeding the study period results across every one of the outlook time frames.

In 24 of the 28 instances, the index surged to a new 2-year high before six months had passed, with the majority of occurrences happening swiftly thereafter. Please see the exit type column for new high precedents.

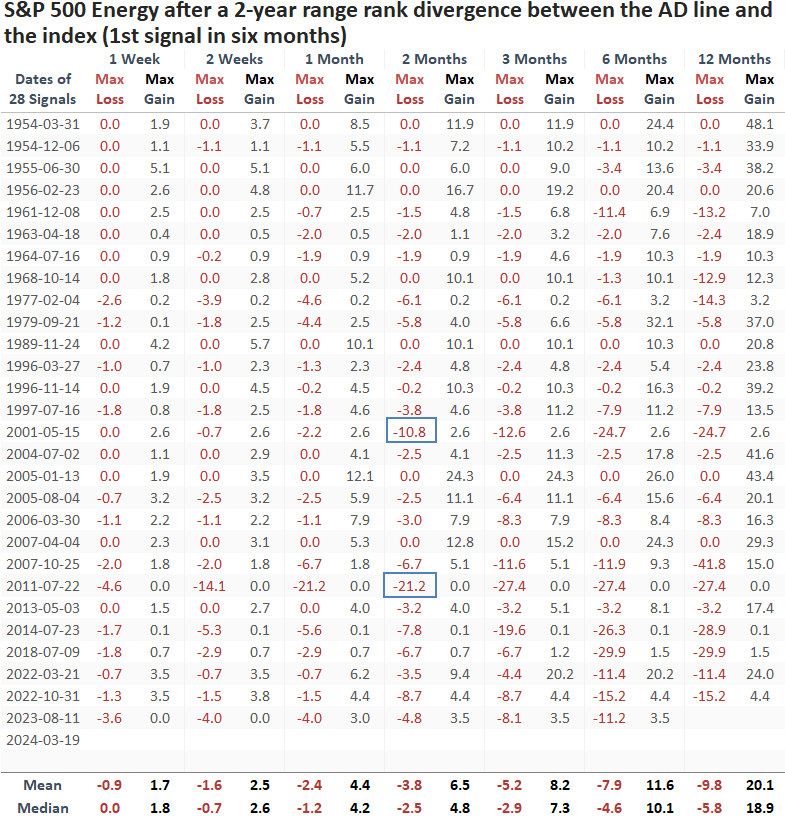
In just two instances over the following two months, the maximum loss exceeded -10%, a remarkable anomaly given the sector's typically volatile nature. 

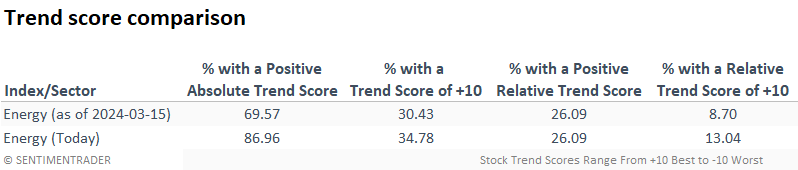
Absolute and relative trends

While absolute and relative trend scores for energy ETFs remain uninspiring, both are improving, especially relative trends, with the equal-weighted energy sector jumping seven points over five sessions. 

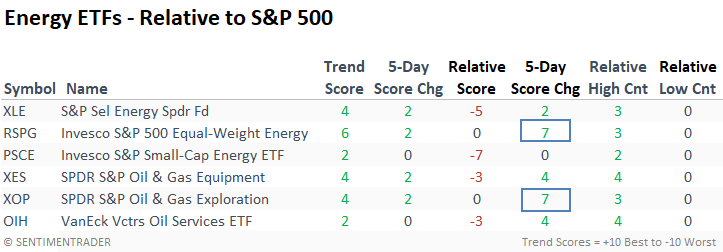
Since my breadth thrust report last week, absolute trend scores for the energy sector stocks have improved, while relative scores have held fairly steady. 

What the research tells us...

The energy sector continues to fly under the radar, showing improvement from price and participation-based measures. The latest indicator to highlight this improvement is the grandaddy of market breadth indicators, the advance-decline line. With the AD line closing at a new multi-year high, the energy sector may soon narrow the gap if history rhymes. While absolute and relative trends for sector ETFs are improving, and some energy stocks look compelling, an underweight allocation is advisable. i.e., the sector remains a rent versus a buy-and-hold group.

PRODUCTS
SentimenTrader
Trading Tools
Indicators & Data API
‍
Strategies & Scanner
‍
Research Reports
FREE
RESOUrCES
Simple Backtest
Calculator
Simple Seasonality
Calculator
The Kelly Criterion
Calculator
Sentiment Geo Map
‍
Public Research Reports
‍
Education
Sentiment Indicators
‍
Technical Indicators
‍
Pricing
Bundle pricing
‍
FAQ
‍
Announcements
‍
COMPANY
‍
About
‍
In the News
‍
Testimonials
‍
Client Success Stories
CONTACT
‍
General Inquiries
‍
Media Inquiries
‍
Financial Professionals Inquiries
‍
© 2026 Sundial Capital Research Inc. All rights reserved.
Setsail Marketing
TermsPrivacyAffiliate Program
Risk Disclosure: The information and tools provided are for research and analytical purposes only and are not intended as investment advice. Market analysis involves uncertainty, and outcomes may differ from expectations. Users should conduct their own due diligence and consider their individual circumstances before making any financial decisions. Past performance is not necessarily indicative of future results.

Hypothetical Performance Disclosure: Hypothetical performance results have many inherent limitations, some of which are described below. No representation is being made that any account will or is likely to achieve profits or losses similar to those shown; in fact, there are frequently sharp differences between hypothetical performance results and the actual results subsequently achieved by any particular trading program. One of the limitations of hypothetical performance results is that they are generally prepared with the benefit of hindsight. In addition, hypothetical trading does not involve financial risk, and no hypothetical trading record can completely account for the impact of financial risk of actual trading. for example, the ability to withstand losses or to adhere to a particular trading program in spite of trading losses are material points which can also adversely affect actual trading results. There are numerous other factors related to the markets in general or to the implementation of any specific trading program which cannot be fully accounted for in the preparation of hypothetical performance results and all which can adversely affect trading results.

Testimonial Disclosure: Testimonials appearing on this website may not be representative of other clients or customers and is not a guarantee of future performance or success.