Products
SentimenTrader Trading Tools
‍
Backtest Engine
My Trading Toolkit
Correlation Analysis
Seasonality
Indicators & Data API
‍
Proprietary Indicators & Charts
Market Data API
Strategies & Scanner
‍
50+ Trading Strategies
Smart Stock Scanner
Research Reports
‍
Research Solutions
Reports Library
Free Resources
Simple Backtest Calculator
Simple Seasonality Calculator
The Kelly Criterion Calculator
Sentiment Geo Map
Public Research Reports
Pricing
Company
About
In the News
Testimonials
Client Success Stories
Contact
Log inLoginSign up
< BACK TO ALL REPORTS

The end of short-term selling for the world's most important index

Jason Goepfert
2022-02-02
In the short-term, the S&P 500 finally closed above its 10-day moving average. But longer-term they still have to deal with inflation.

Finally, a short-term break for stocks

Buyers just couldn't catch a break. Finally, on Monday, the S&P 500 index closed above its 10-day average for the first time in 17 consecutive sessions. 

The S&P finally crossed above its 10-day average

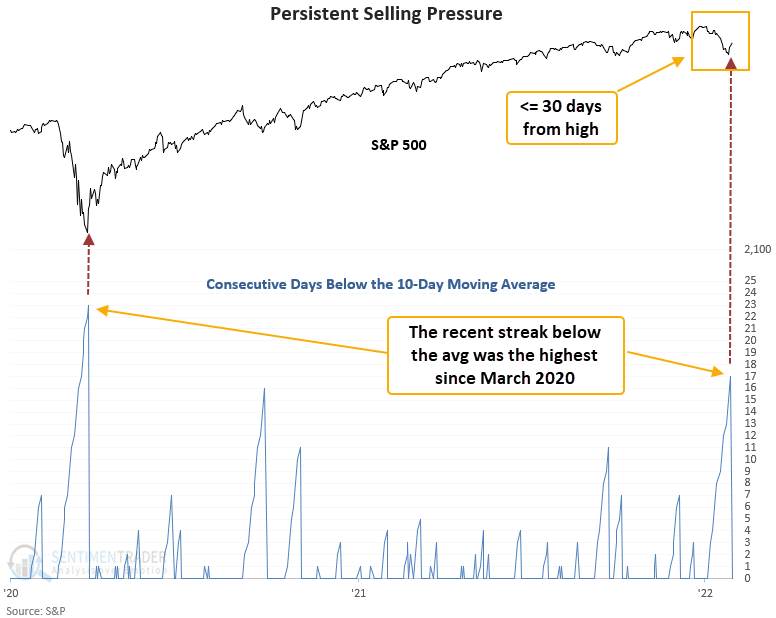
Dean assessed the outlook for the S&P 500 when the index closes above its 10-day average after trading below the average for 17 consecutive days or more. He further filtered the signals to look for times when stocks were not too far removed from a new high at the time.

This signal triggered 20 other times over the past 84 years.

Stat box

The SPY S&P 500 ETF has suffered an average daily outflow of more than $2 billion per day over the past 10 days. According to our Backtest Engine, the only periods that compare are January 2008, February 2018, and February 2020.


When inflation is higher than yields, watch out

Jay looked at the rate of inflation versus what investors can earn on a 10-year Treasury note, and what that means for stocks.

By subtracting the current yield on 10-year treasuries from the 12-month % change in CPI, investors can get a handle on whether the environment is favorable for stocks. 

The chart below displays value C above on a month-end basis since 1914. The dark blue horizontal line is drawn at the 0.60 level. 

Inflation is much higher than Treasury yields

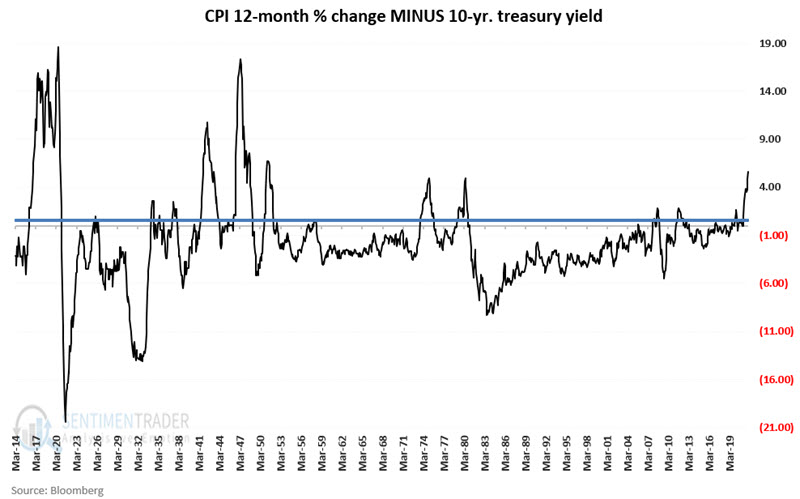
The growth of $1 invested in the Dow Jones Industrial Average ONLY during those months when the previous month's inflation is 0.6 points or higher than 10-year treasury yields was terrible. When the opposite condition was in effect, stocks performed very well.

PRODUCTS
SentimenTrader
Trading Tools
Indicators & Data API
‍
Strategies & Scanner
‍
Research Reports
FREE
RESOUrCES
Simple Backtest
Calculator
Simple Seasonality
Calculator
The Kelly Criterion
Calculator
Sentiment Geo Map
‍
Public Research Reports
‍
Pricing
Bundle pricing
‍
Announcements
‍
FAQ
COMPANY
‍
About
‍
In the News
‍
Testimonials
‍
Client Success Stories
CONTACT
‍
General Inquiries
‍
Media Inquiries
‍
Financial Professionals Inquiries
‍
© 2025 Sundial Capital Research Inc. All rights reserved.
Setsail Marketing
TermsPrivacyAffiliate Program
Risk Disclosure: Futures and forex trading contains substantial risk and is not for every investor. An investor could potentially lose all or more than the initial investment. Risk capital is money that can be lost without jeopardizing ones’ financial security or life style. Only risk capital should be used for trading and only those with sufficient risk capital should consider trading. Past performance is not necessarily indicative of future results.

Hypothetical Performance Disclosure: Hypothetical performance results have many inherent limitations, some of which are described below. No representation is being made that any account will or is likely to achieve profits or losses similar to those shown; in fact, there are frequently sharp differences between hypothetical performance results and the actual results subsequently achieved by any particular trading program. One of the limitations of hypothetical performance results is that they are generally prepared with the benefit of hindsight. In addition, hypothetical trading does not involve financial risk, and no hypothetical trading record can completely account for the impact of financial risk of actual trading. for example, the ability to withstand losses or to adhere to a particular trading program in spite of trading losses are material points which can also adversely affect actual trading results. There are numerous other factors related to the markets in general or to the implementation of any specific trading program which cannot be fully accounted for in the preparation of hypothetical performance results and all which can adversely affect trading results.

Testimonial Disclosure: Testimonials appearing on this website may not be representative of other clients or customers and is not a guarantee of future performance or success.