
The end of optimism

Key points:
- Smart Money investors are now betting on a rally more than Dumb Money investors
- This is the first time we've seen this sentiment shift in more than 90 days, one of the longest streaks since 1998
- After similar behavior, stocks did well over the next six months, especially the Nasdaq 100
Sentiment has shifted drastically
Sentiment is the least optimistic it's been in a while.
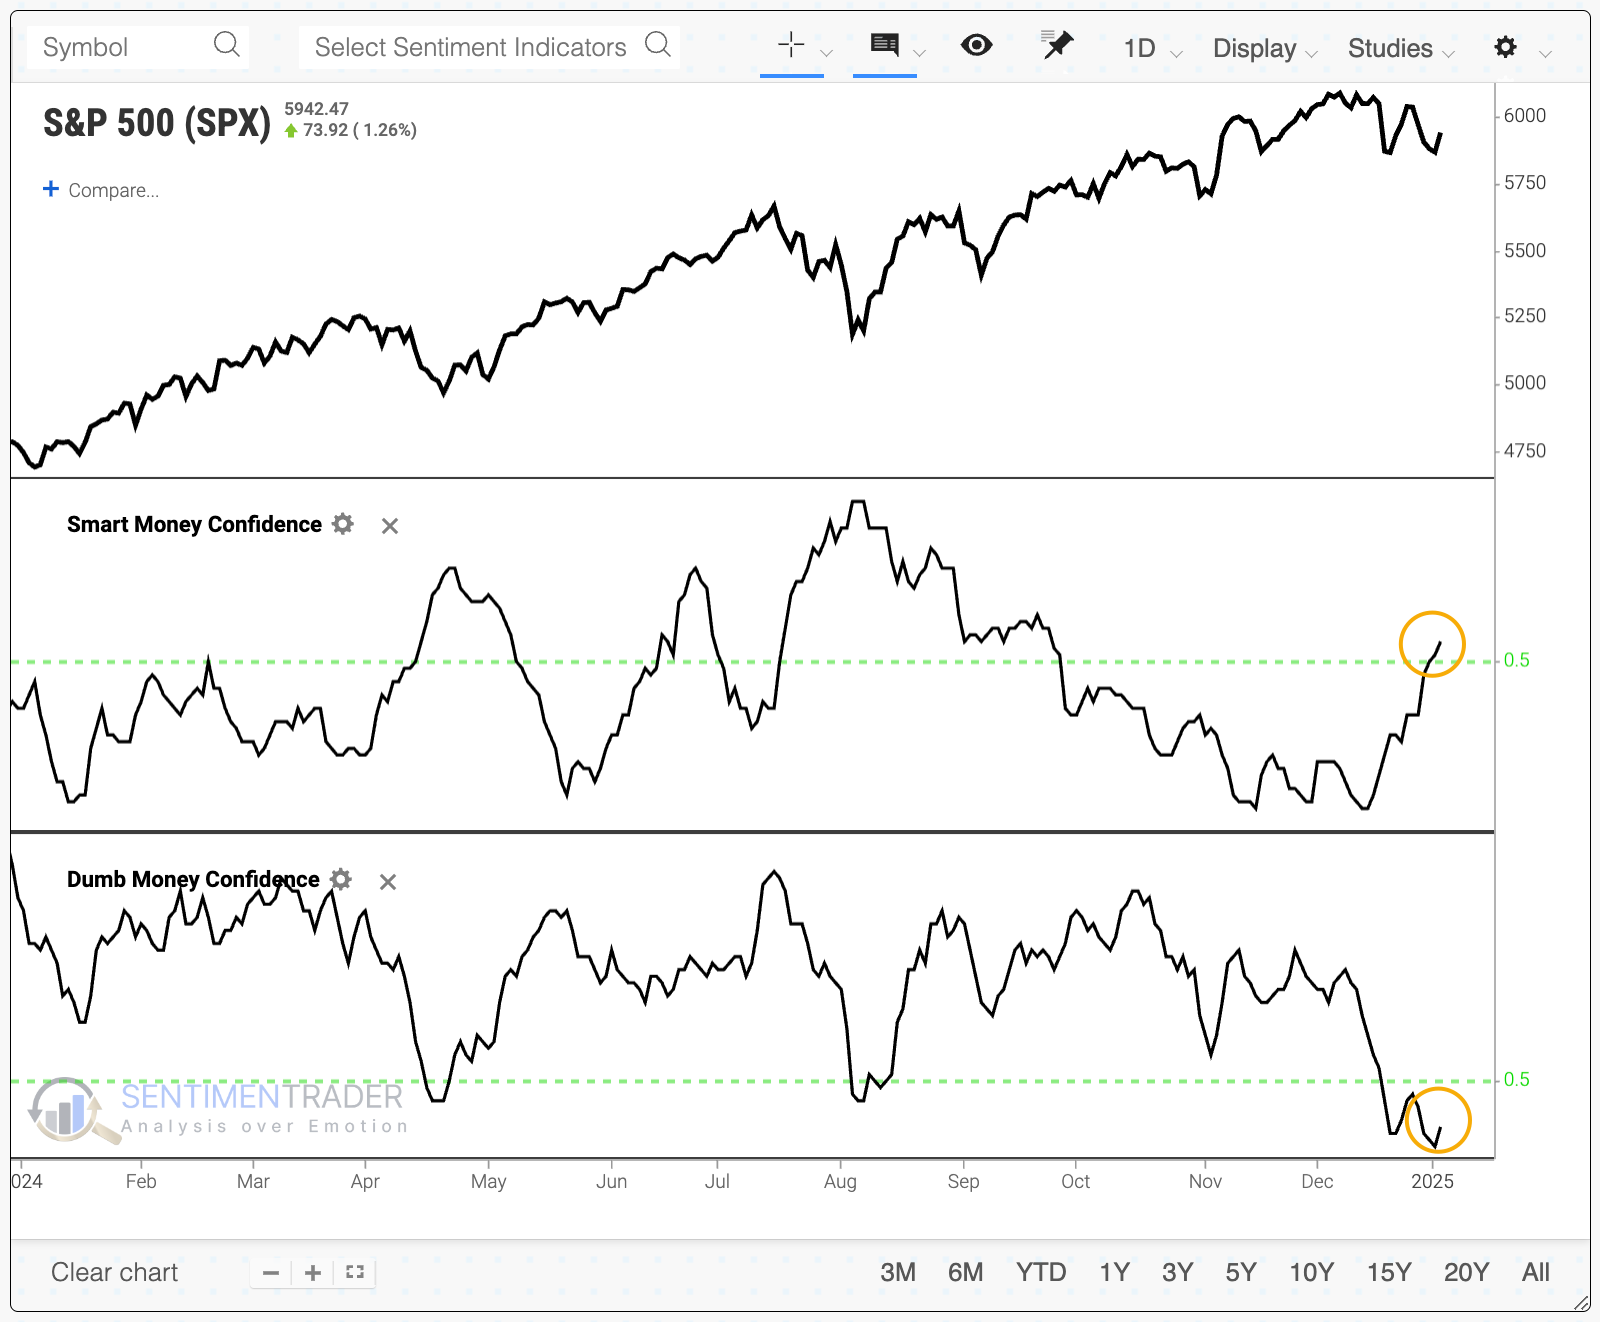
At around 40%, Dumb Money Confidence is around its lowest level in two years. And for the first time in months, more than half of "smart money" indicators are banking on higher stock prices while less than half of "dumb money" ones are.
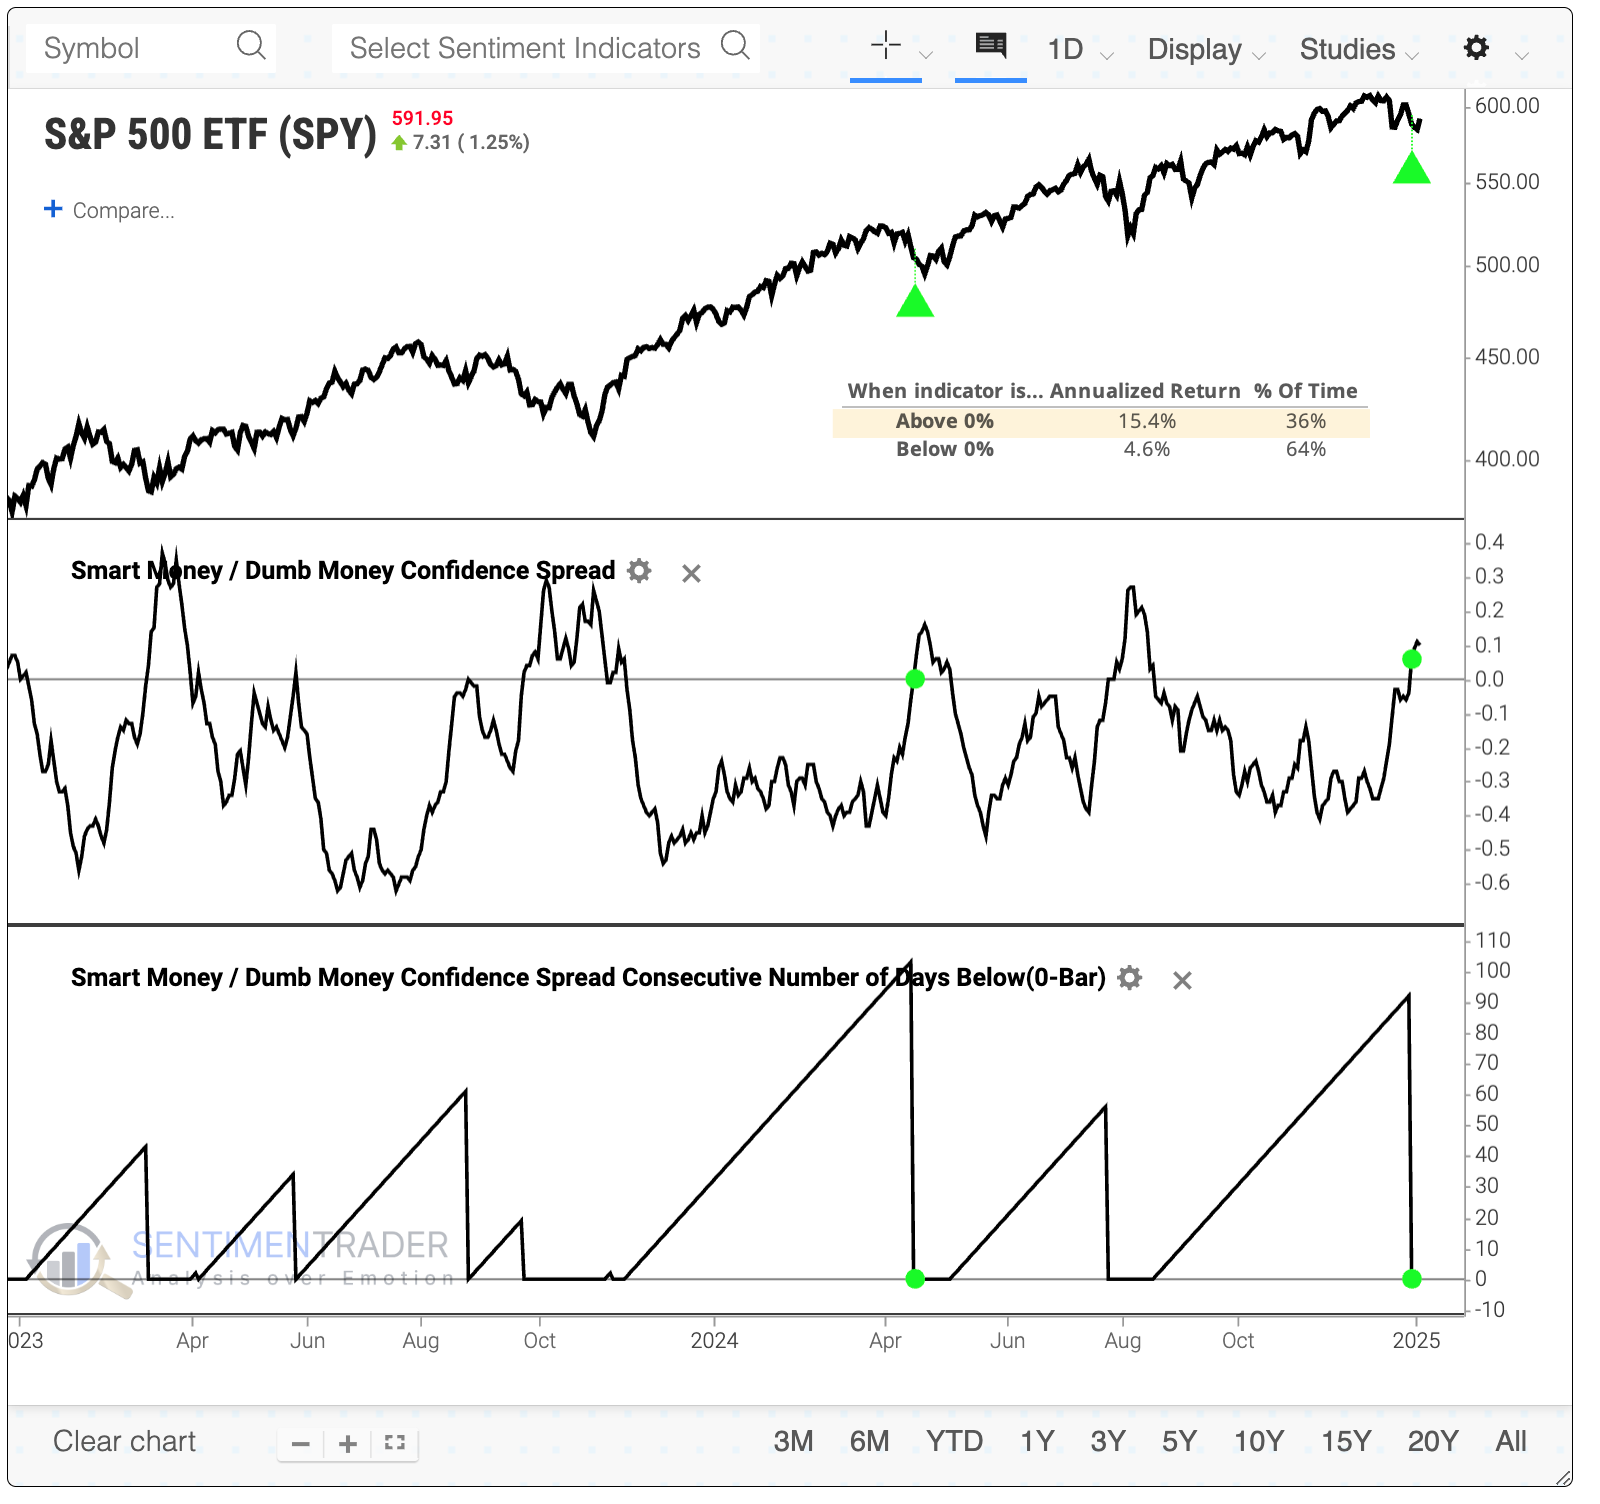
The shift in sentiment has moved the Smart Money / Dumb Money Confidence Spread above the zero line for the first time in more than 90 sessions. The chart below shows that when the spread is positive, the S&P 500 has returned an annualized +15.4% versus only +4.6% when the spread is negative. When this was triggered last April, the S&P 500 fell a bit more, then soon headed to new highs.
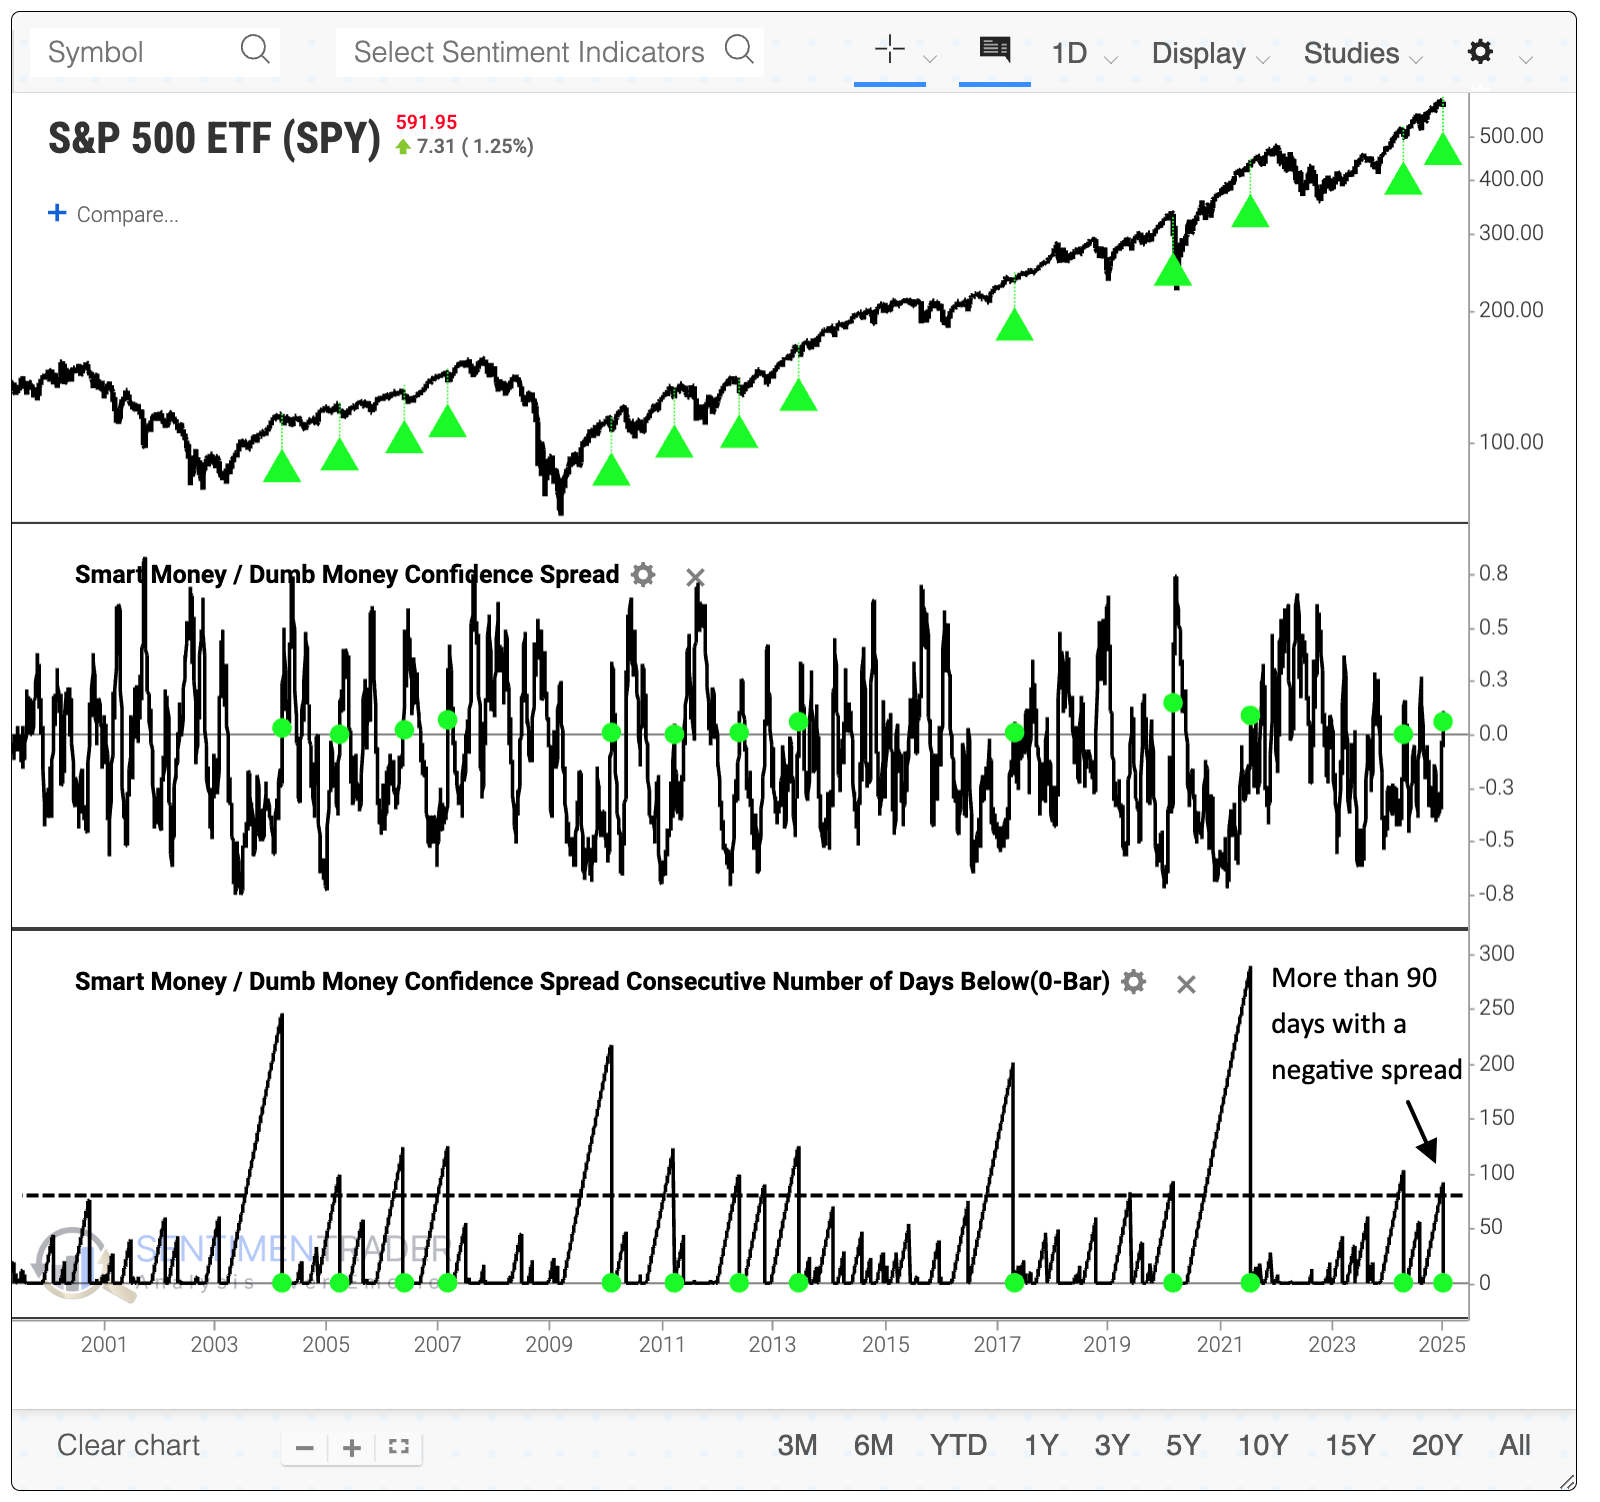
The end of the streak of at least 90 days with a negative spread was one of the longest since we began computing these models in 1998. In those 27 years, there have been 13 streaks of 90 or more days with a negative spread.
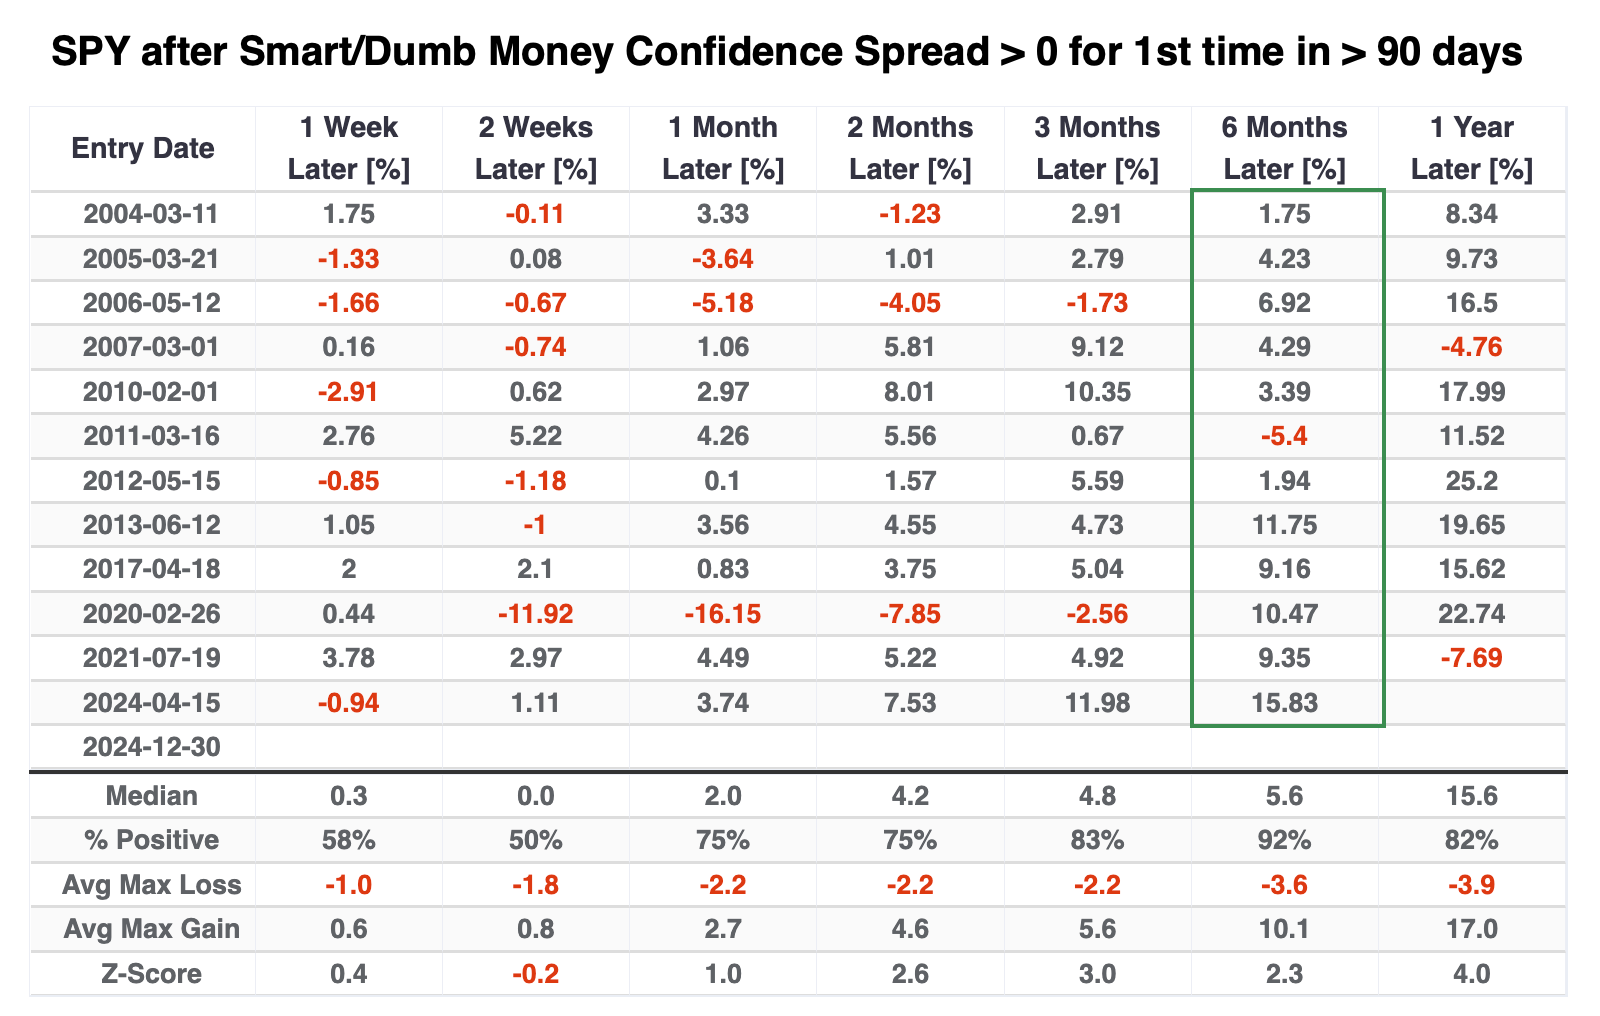
Good six-month returns for stocks
The table below shows returns in SPY after the end of a streak of at least 90 days with a negative spread. Short-term returns were mixed, with a horrid loss during the 2020 pandemic and a smattering of other minor losses. However, they tended to reverse in the months ahead - six months later, there was only one small loss, which was more than erased in the months afterward.
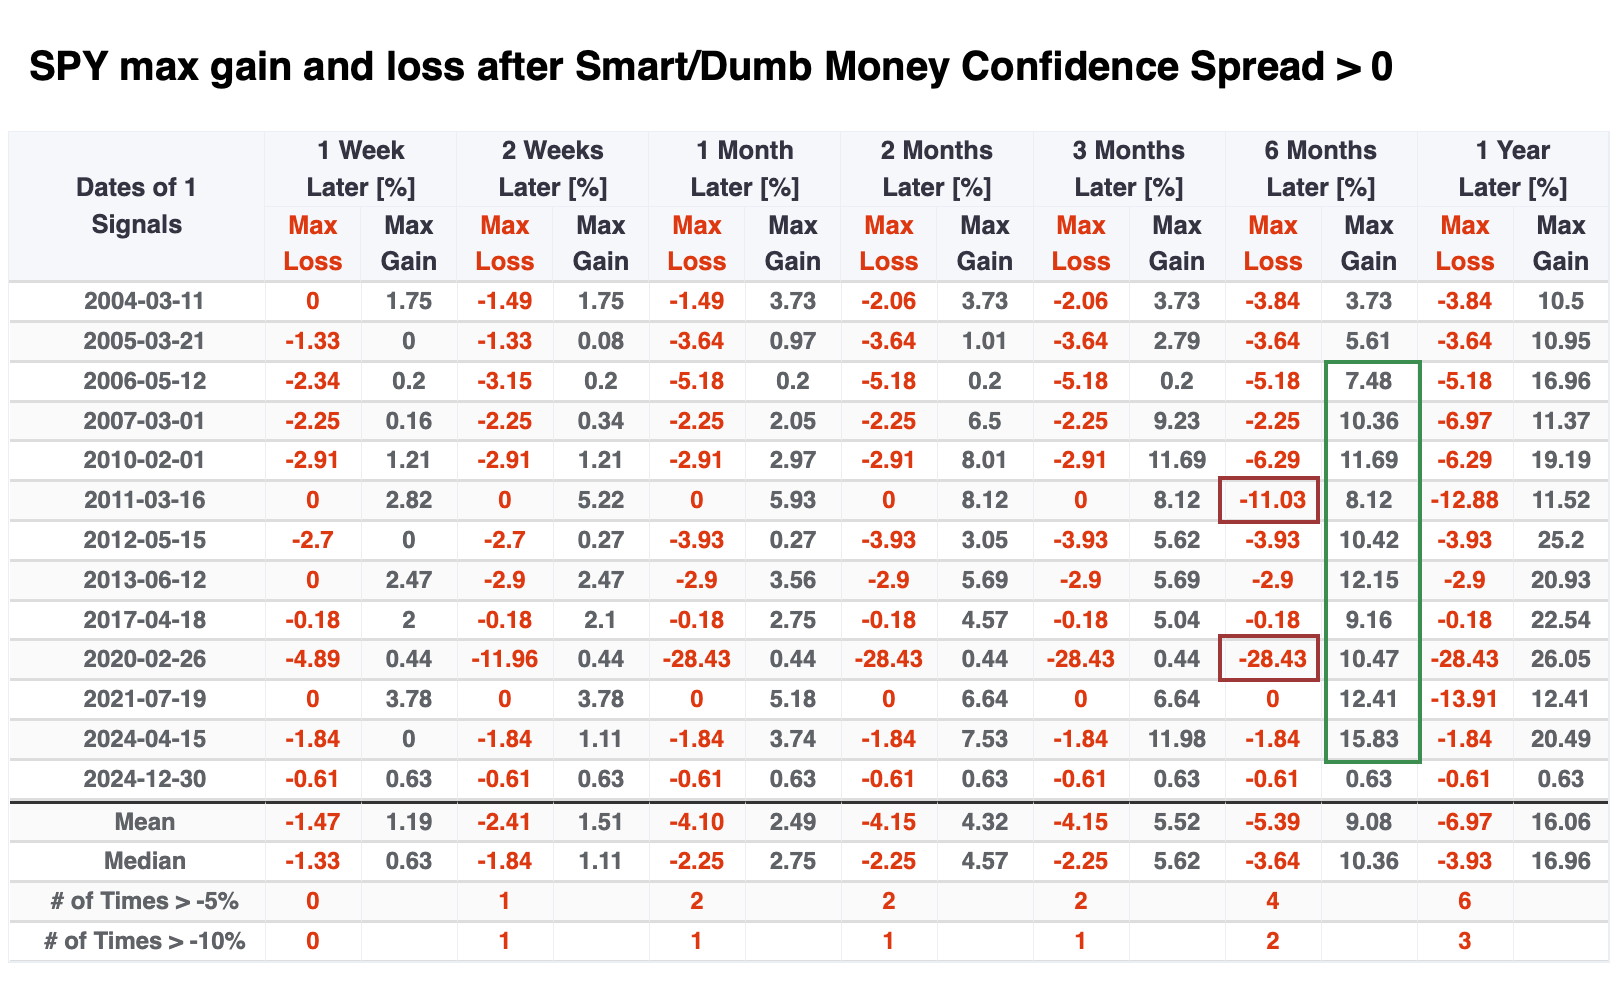
Below is a table showing maximum gains and losses across time frames. There are a lot of numbers, but the bottom line is that within the following six months, there were only two drawdowns larger than -6.5% compared to ten rallies of at least +6.5%.
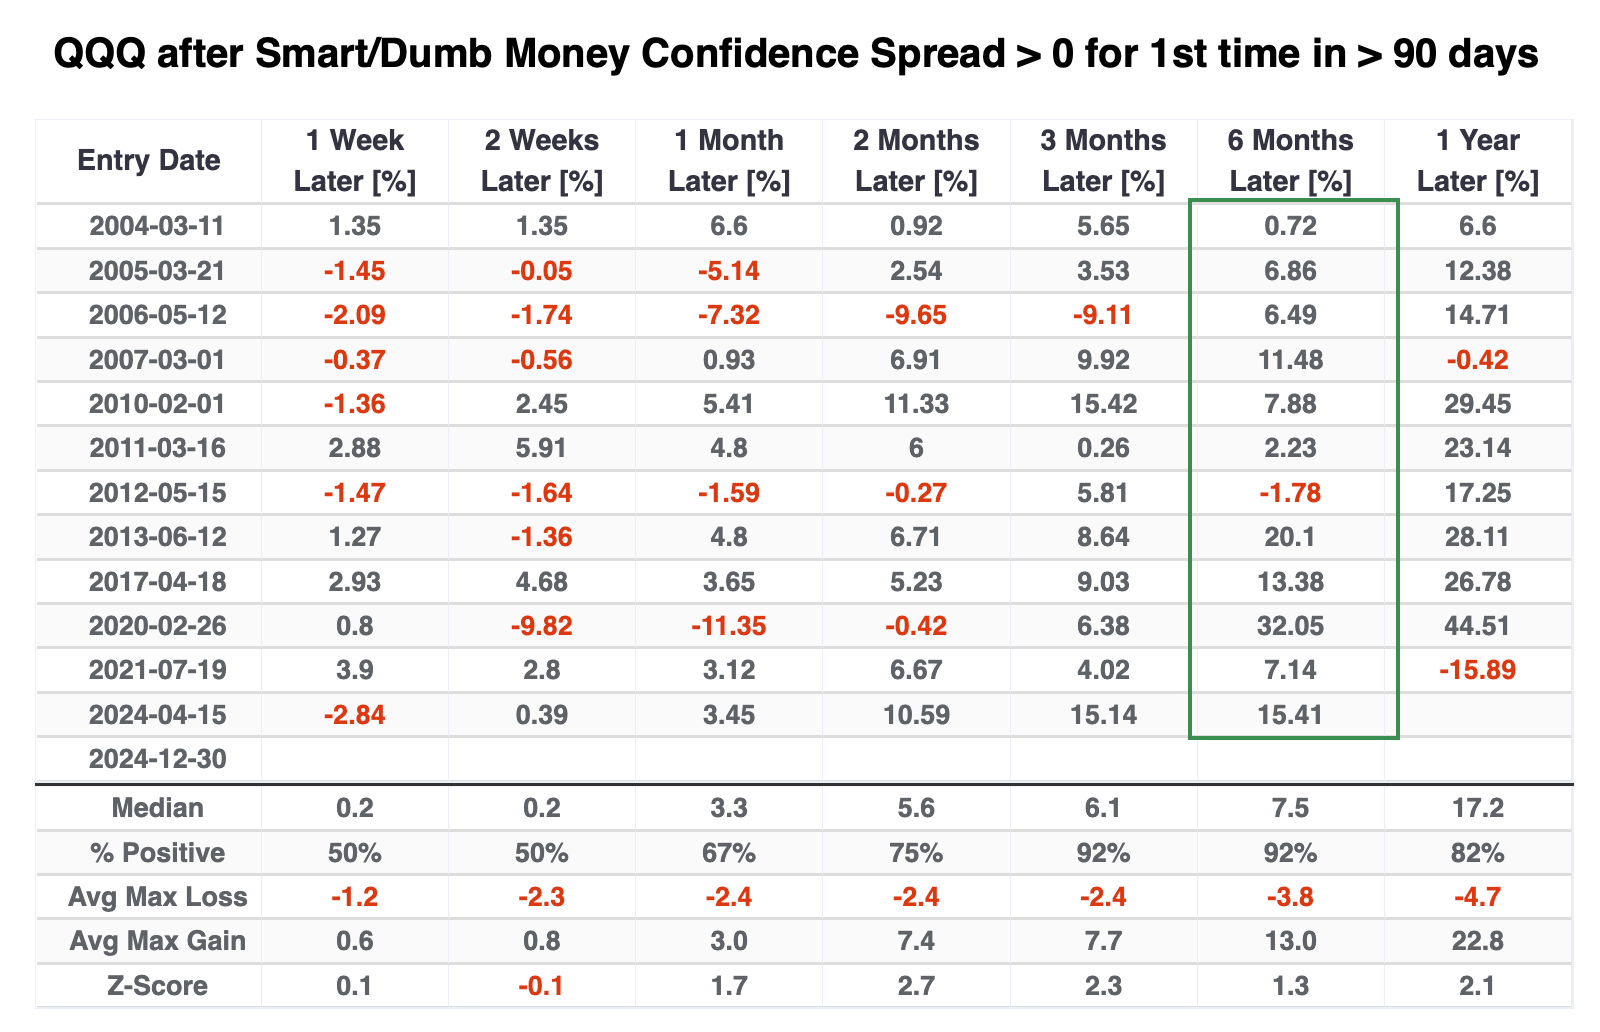
If we look at the other major U.S. equity ETFs after these signals, the best performer was QQQ, which tracks the large technology stocks in the Nasdaq 100. Thanks to a tremendous tailwind over the past two decades, the fund showed a median gain of +7.5% over the next six months with a single small loss. Its risk/reward ratio was tilted heavily toward "reward."
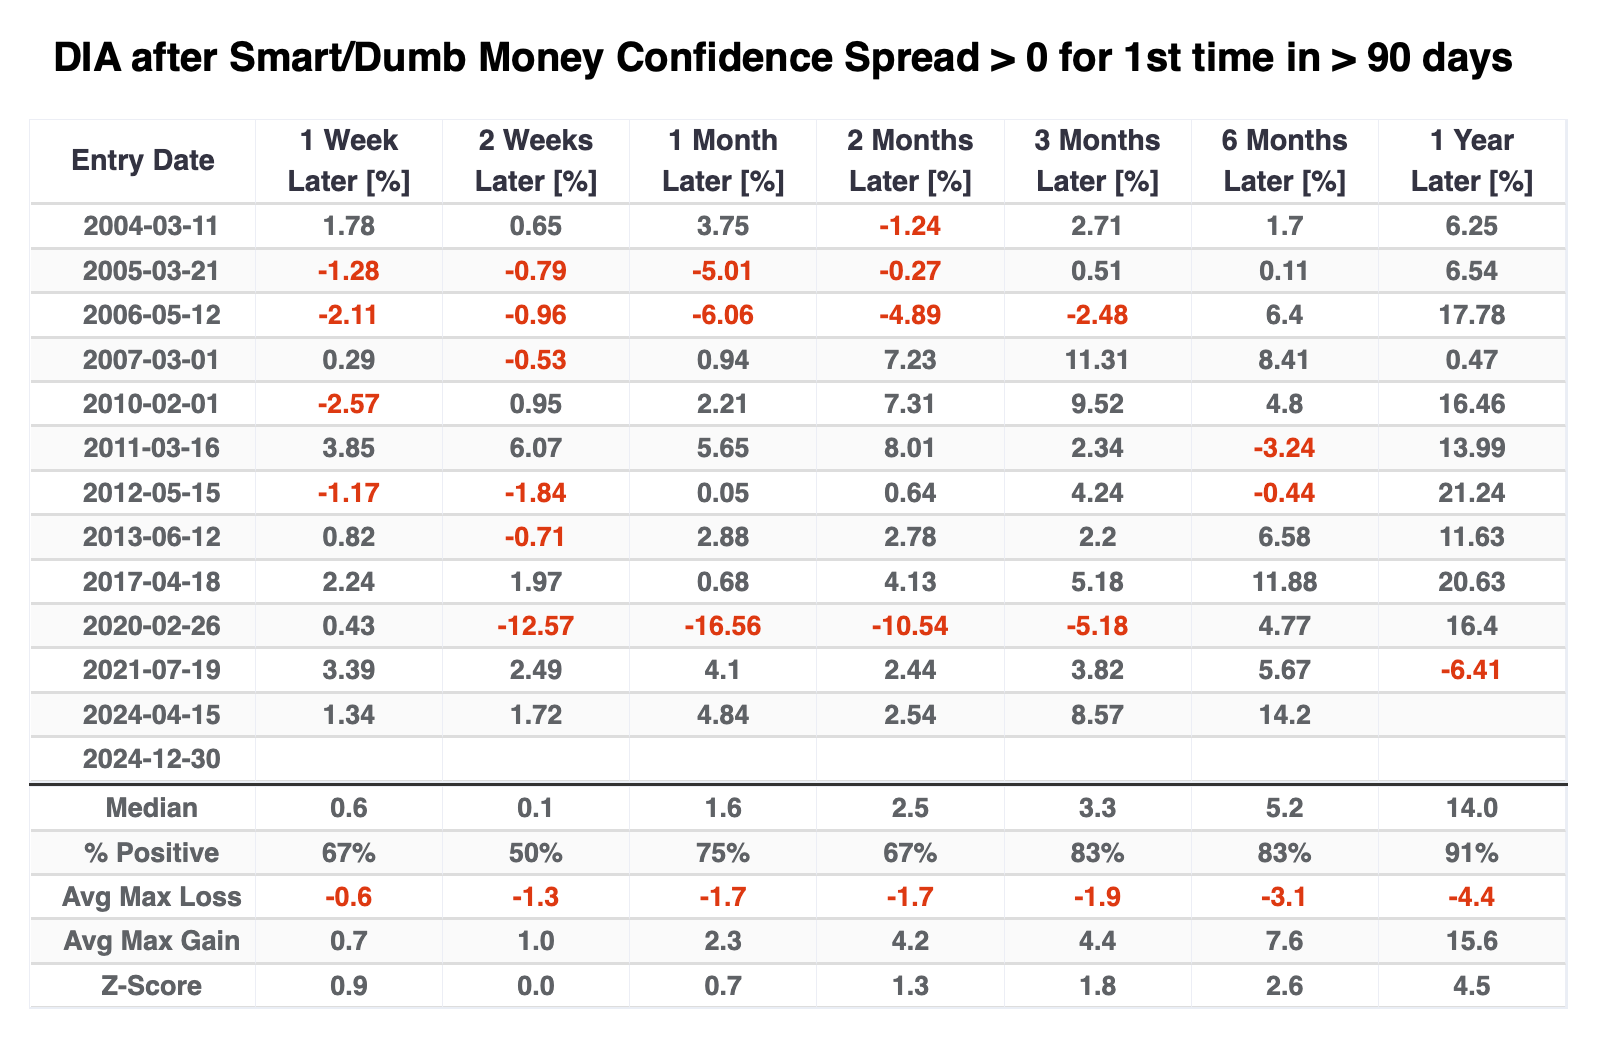
The DIA fund, focused on the venerable Dow Jones Industrial Average, suffered a couple of small losses over the next six months, both of which were aggressively erased in the months afterward. It enjoyed only two double-digit gains six months later, but that's generally the tradeoff for what could be considered a more conservative index.
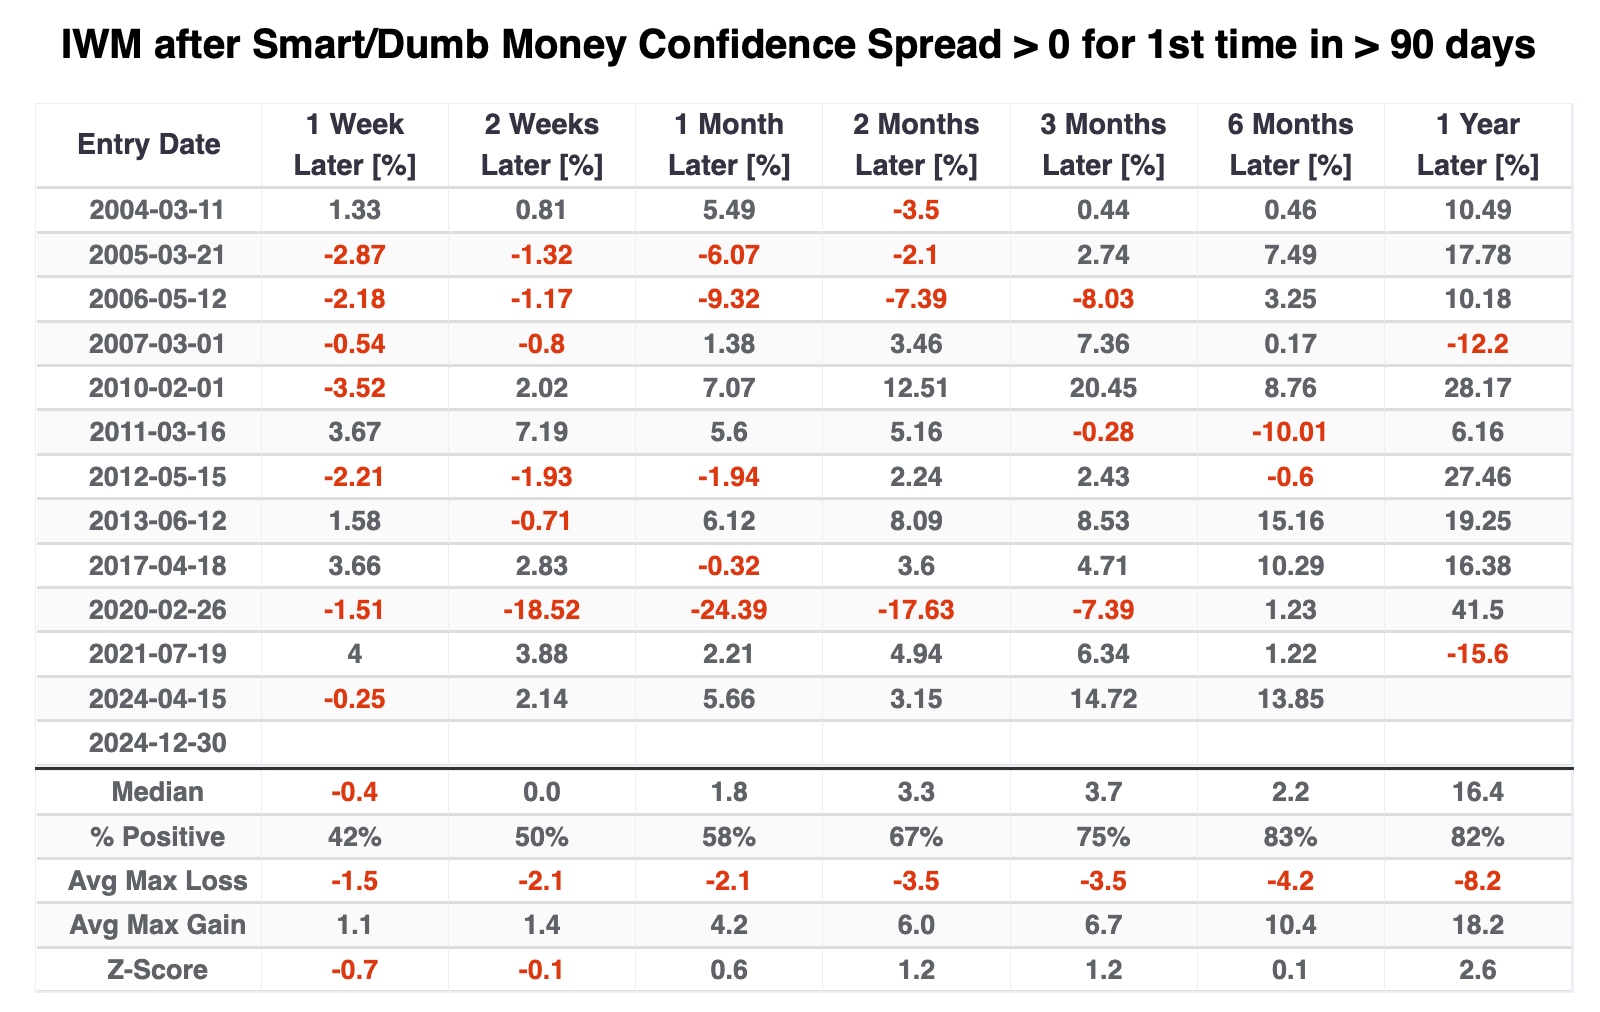
The small-cap Russell 2000 fund, IWM, didn't fare as well, especially over shorter time frames. Over the next six months, it suffered a couple of losses, only one of which was meaningful, but its median return was an unimpressive +2.2%.
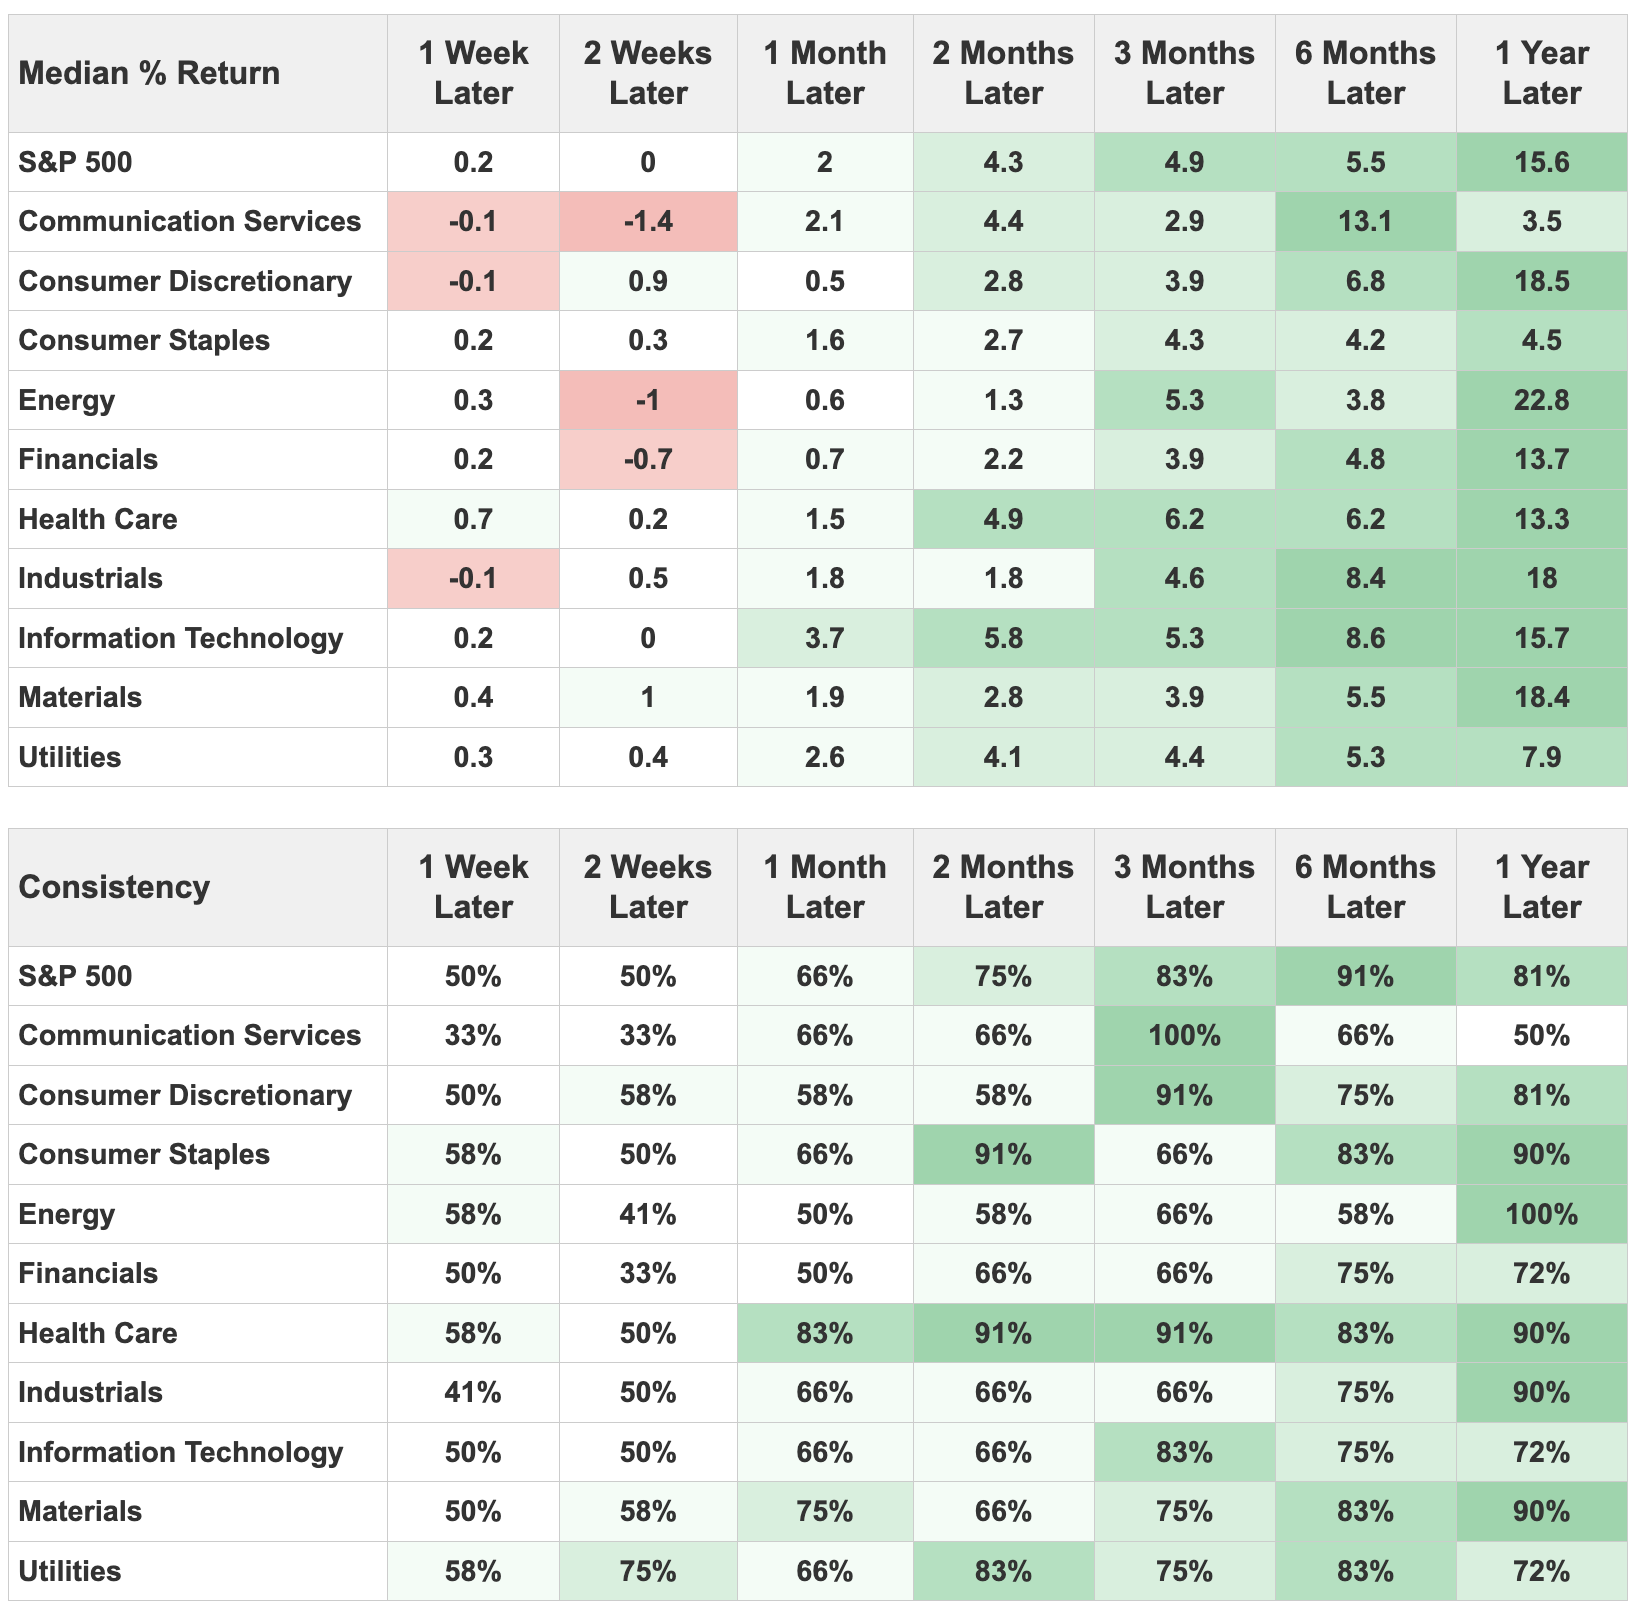
If you run this test on Backtest Engine 2.0 (click here, then click the Run Backtest button), you can view the Major Sectors tab and see how the S&P's primary sectors performed after the signals. Even though the big tech stocks that dominate the Nasdaq 100 did exceptionally well, the broader information technology sector was mediocre. Interestingly, the most consistent winners over the next several months were health care, consumer staples, and utilities - the most defensive sectors.
What the research tells us...
Sentiment has shifted to one of the most significant degrees in months. Even though the S&P 500, dominated by the largest stocks, has held up well, the average stock has been struggling to a surprising degree. That has weighed on sentiment, and most of the core measures we follow are now back to neutral, at least.
When the spread between Smart and Dumb Money Confidence climbs above zero after months below, it tells us that investors have reset their expectations after a prolonged period of optimism. That might seem like catnip for bears, and sometimes it was on shorter time frames, but momentum (and optimism) don't tend to be easily extinguished. After similar stretches, stocks showed a strong tendency to do well over the next six months.