
The downward trend in Treasury yields is likely to persist

Key points:
- Trend-following indicators for Treasury yields have progressively shifted from positive to negative
- Comparable trend configurations signaled a falling yield environment over the subsequent six months
- When yields eased, stocks tended to rally, while other assets displayed mixed to slightly adverse outcomes
Have Treasury yields peaked following an interest rate hiking cycle
Treasury bond yields across the curve have taken a noticeable turn lower. Whether due to signaling from the Federal Reserve regarding the path of the target rate or softer economic data, it's anyone's guess when it comes to a $27 trillion market. In all likelihood, it's a combination of several factors.
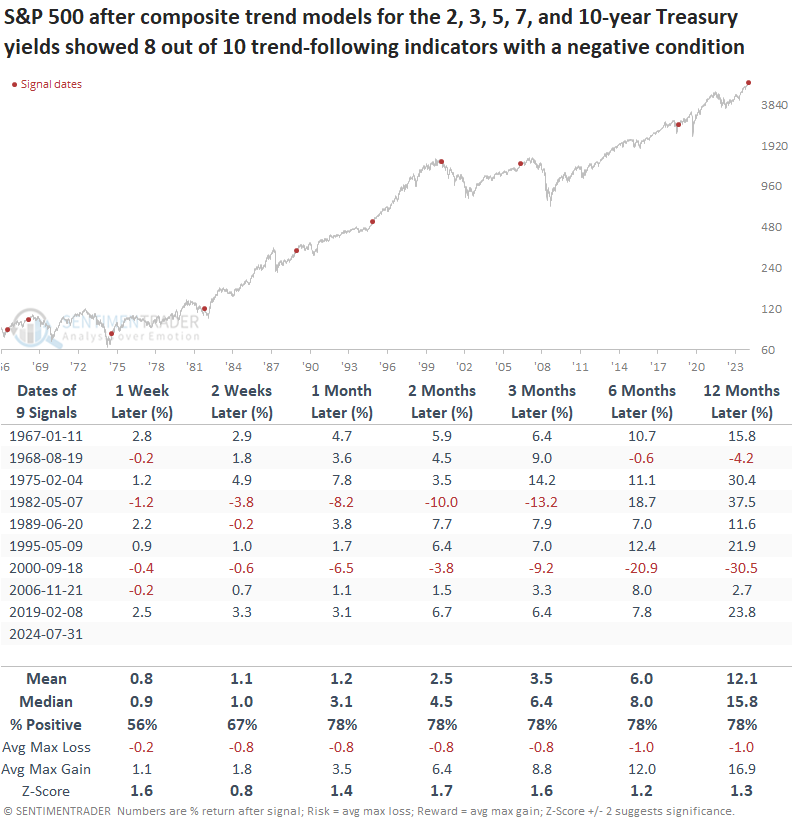
For the first time since the initiation and subsequent suspension of the Federal Reserve's interest rate hike cycle, trend-following composites for Treasury yields ranging from two to ten years have uniformly shifted to a negative condition for 8 out of 10 indicators.
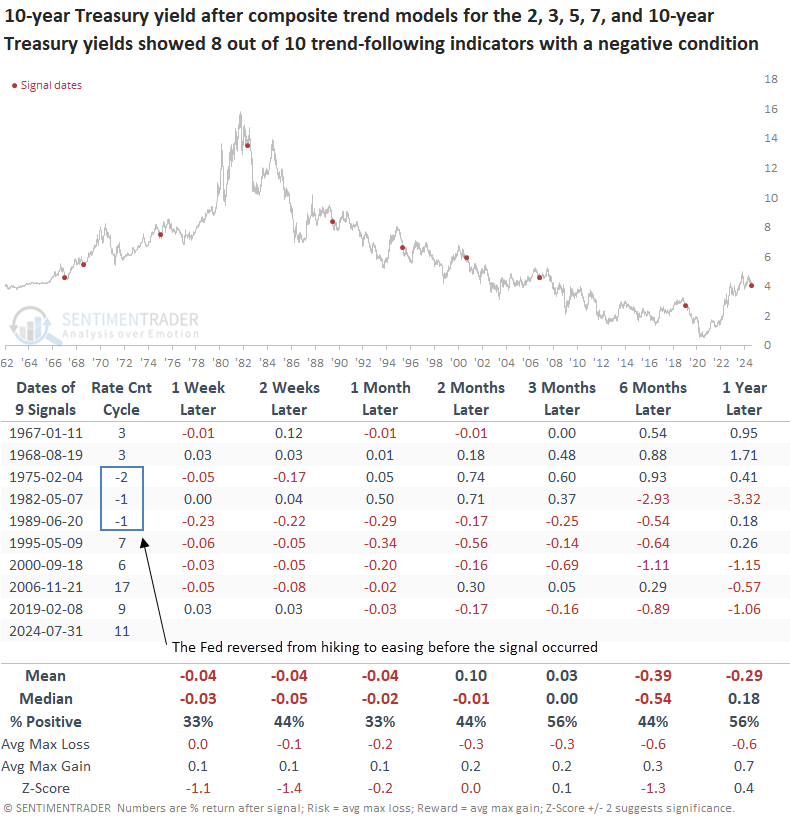
The previous instance occurred in February 2019 after the Federal Reserve increased the target rate nine times. Over the following six months, the 10-year yield fell 89 basis points, and the S&P 500 rallied 7.8%.
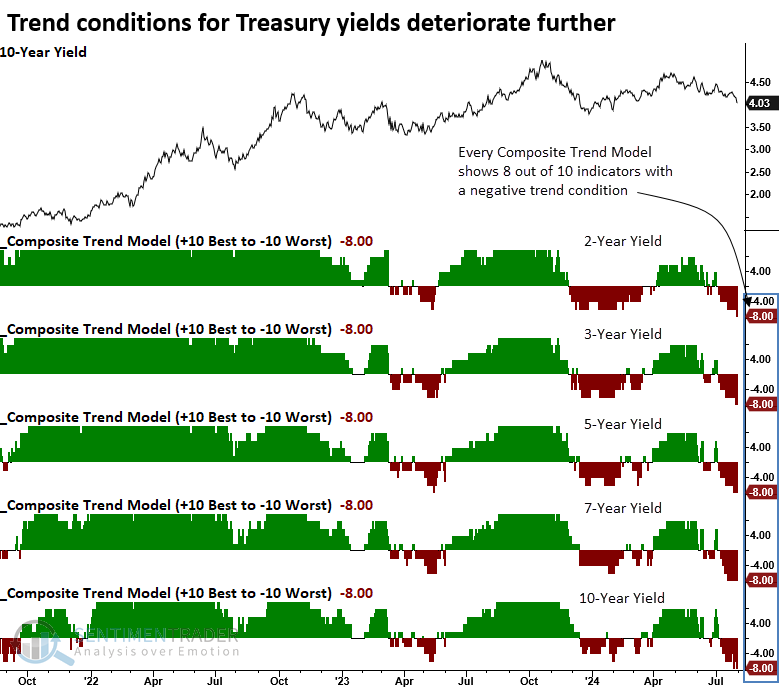
The composite contains ten trend-following indicators with durations ranging from medium to long term.
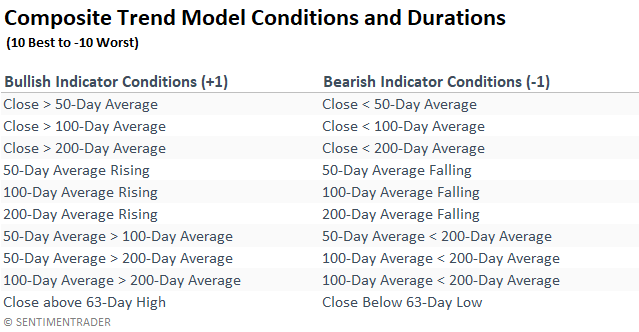
I included a condition in the study requiring three interest rate increases by the Federal Reserve to identify composite trend profiles similar to the current environment. i.e., the signals had to occur after a tightening cycle.
Comparable trend conditions preceded a falling 10-year Treasury yield
Following precedents when 8 out of 10 trend-following indicators exhibited a negative condition for Treasury yields ranging from two to ten years, the 10-year Treasury bond yield tended to decline over the subsequent six months. That was especially the case since 1982.
Before the secular peak in yields in 1981, composite trend conditions similar to those we see today did not lead to a falling yield environment. Instead, they usually signified a bottom.
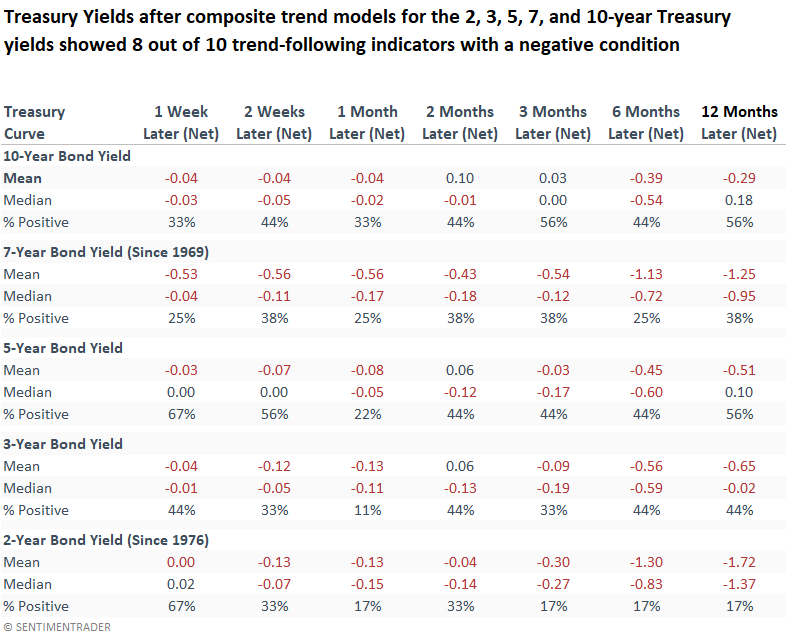
Treasury yields across the curve exhibited a fairly consistent downward bias over the subsequent six months.
What about stocks?
Stocks benefitted from lower yields, with the S&P 500 showing a steady upward trend. At some point over the next six months, the world's most benchmarked index rallied in all but one instance, September 2000.
Consumer-oriented sectors exhibited solid returns in the subsequent six months, likely helped by the softening in interest rates. In contrast, Financials faced relative challenges.

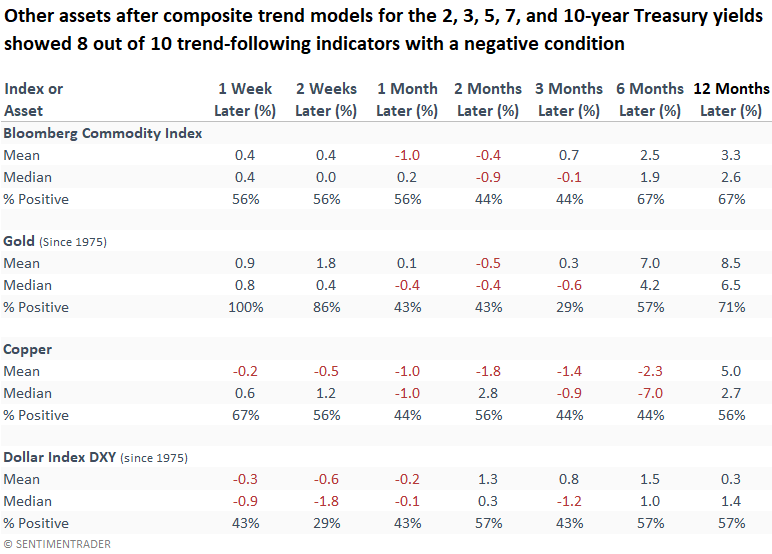
Other assets
Aside from a momentary boost in gold, potentially supported by a softer dollar, there's not much to get excited about in other asset classes.
What the research tells us...
Treasury yields have declined. Consequently, 8 of 10 trend-following indicators in composites for Treasury yields ranging from two to ten years display a negative condition. Similar trend profiles following a Federal Reserve interest rate hiking cycle suggest Treasury bond yields ease further over the following six months. The more favorable interest rate environment produced a bullish outlook for stocks. The September 2000 precedent is the only instance that coincided with a significant market peak. So, while there are certainly some macro concerns to keep an eye on, history says to give the market the benefit of the doubt and buy the dip.