
The Dow Industrials' historic multi-timeframe momentum

Key points:
- The Dow Jones Industrial Average has risen more than 60% of the time across daily, weekly, monthly, and yearly time frames
- This performance ranks among the best during the past 124 years
- Other bouts of extreme positive momentum preceded further gains, but the two closest precedents suggest long-term caution
A historic run for the most venerable index
The Dow Utilities index has been on fire. We've already seen how that usually works for a group of stocks that generally exhibit lower volatility.
It's not just defensive stocks like utilities that have been doing well, though. Many others have been holding up, including industrials, among the most cyclical sectors.
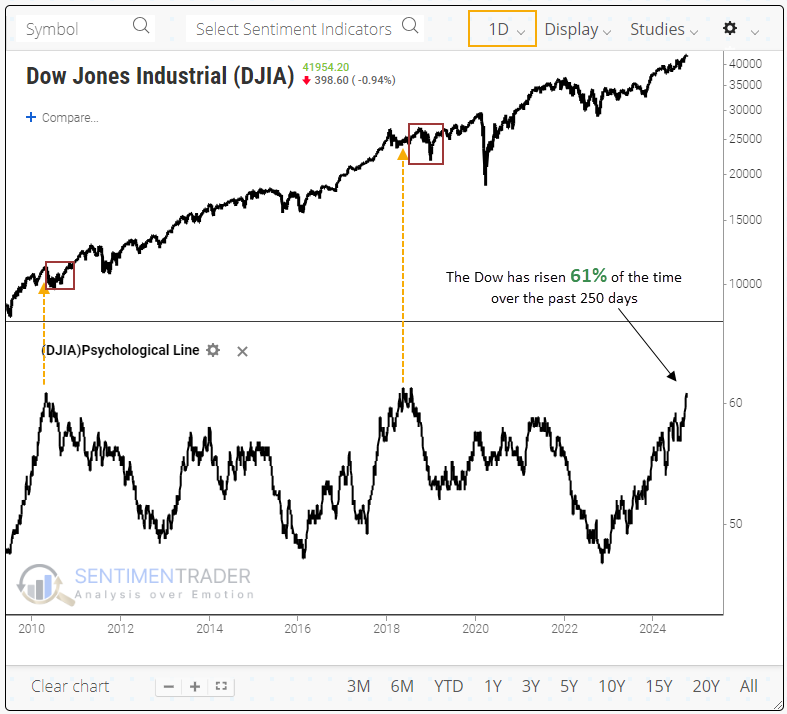
Over the past 250 trading days, the Dow Industrials have advanced 152 times or just under 61% of the time. The only times it enjoyed this much consistency were in April 2010 and May 2018, both of which preceded around six months of chop.
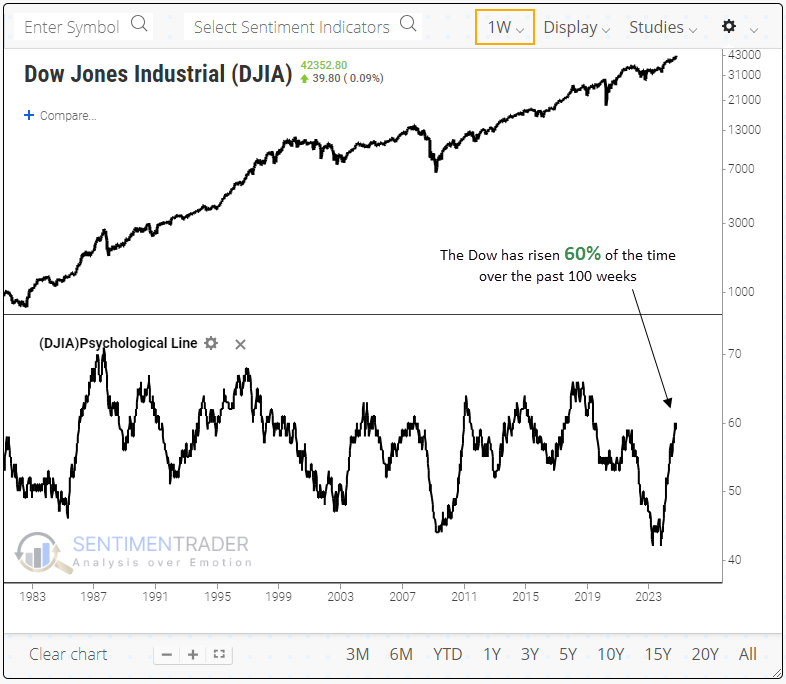
If we stretch our time frames, the Dow has also risen a little over 60% of the time during the past 100 weeks. That's not all that extreme relative to the past 40 years, though it's climbing the ranks after a miserable stretch in 2022.
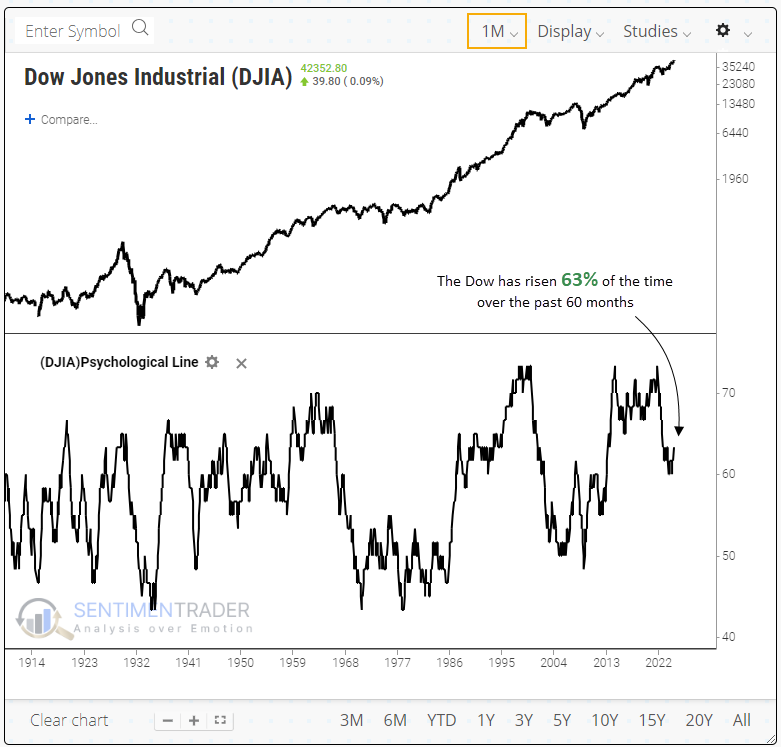
When we zoom out even further, the Dow has advanced in 63% of the months over the past 60 months (five years). Again, it's not the most extreme it's been, but on the high end over the past 124 years.
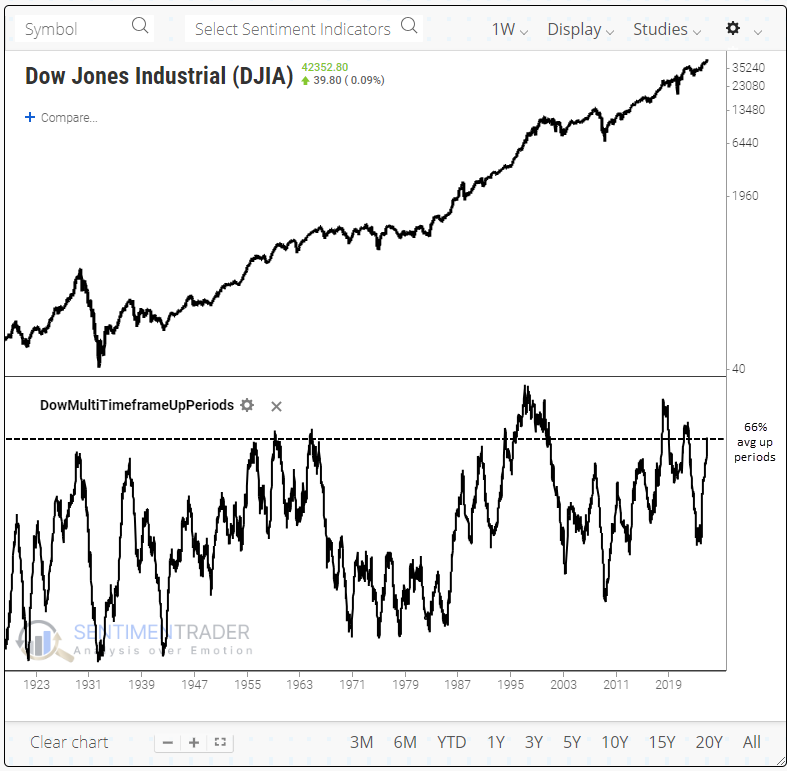
It's not shown on a chart, but the Dow Industrials have also risen during 80% of the years over the past 15. So, the venerable index shows impressive and persistent momentum on daily, weekly, monthly, and yearly time frames. The chart below shows an average of the up periods across the four time frames.
Because the momentum isn't isolated to a time frame or two, the current level is historically extreme, ranking in the top 6% of all readings since 1900. If we exclude the 1995-2000 bubble, the current reading would rank in the top 2% all-time.
No exhaustion
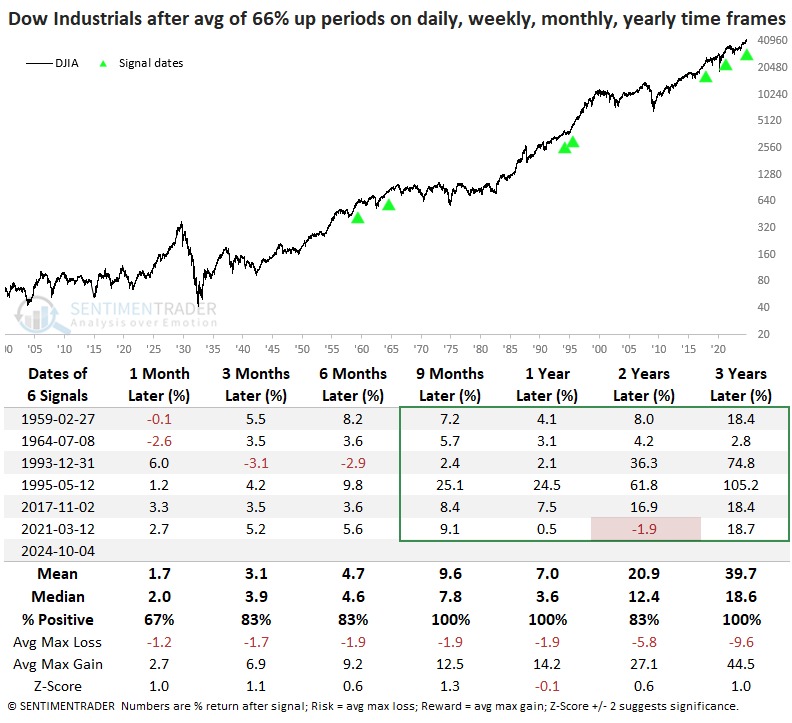
Unlike some sectors, like utilities, bouts of extreme upside momentum in the Dow Industrials were not a sign of exhaustion-quite the opposite, actually. The table below shows other times when the average of up periods across time frames exceeded 66%. There were only a handful of precedents, but losses were rare. The Dow's returns were especially impressive over the following nine months.
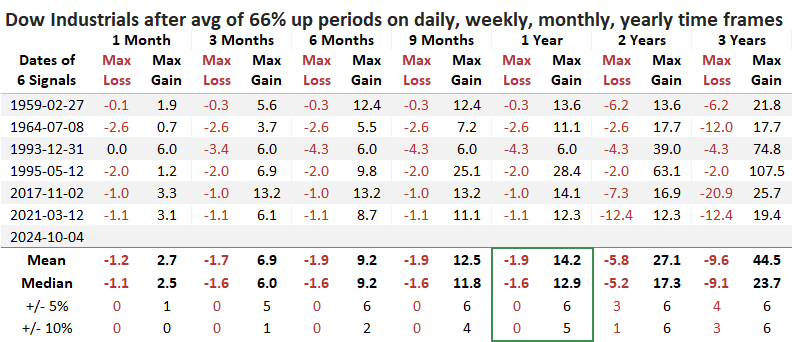
The table of maximum gains and losses across time frames shows that during the following year, the Dow didn't lose more than -5% after any of the signals, while five of them gained more than +10%.
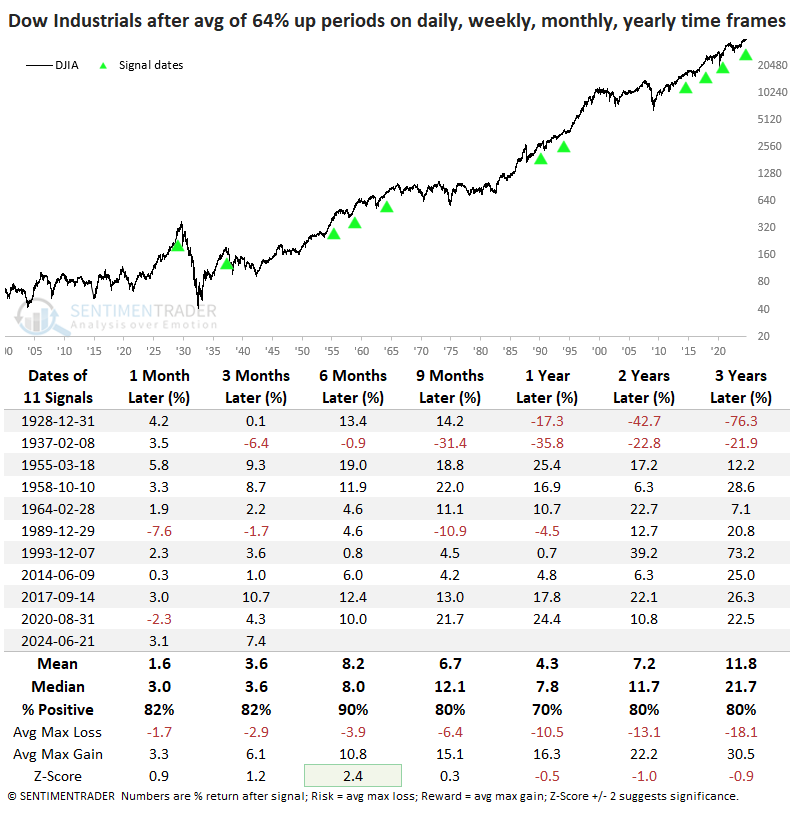
The smaller the sample size, the harder it is to have confidence in the conclusions, so the table below relaxes the parameters to look for those times when 64% of the four time periods were positive.
Again, returns were mostly positive going forward, though it did trigger near tragic peaks in 1929 and 1937. During modern markets, there was only one isolated loss during the 1990 recession.
A truly exceptional stretch
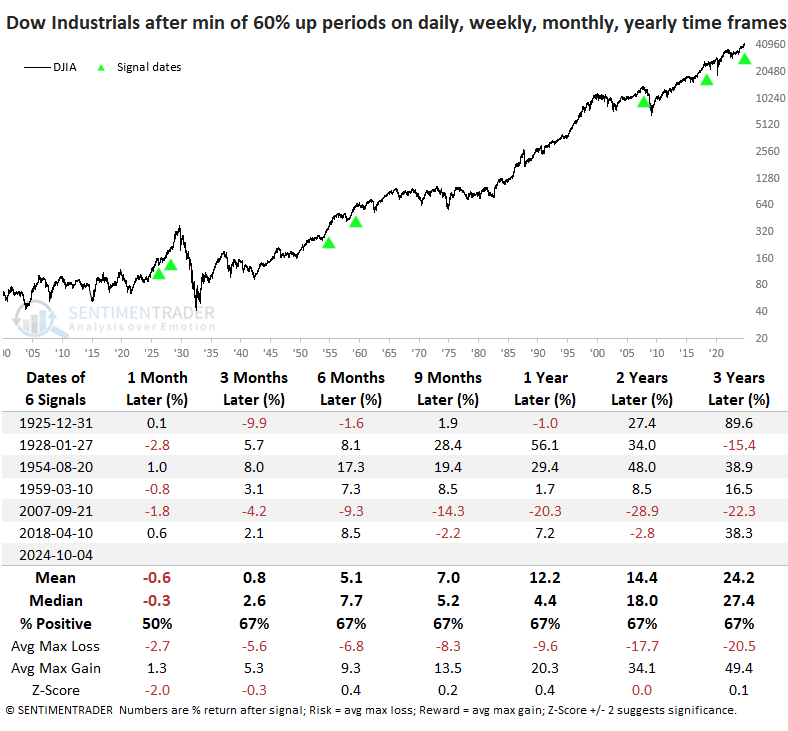
Looked at another way, the Dow has risen at least 60% of the time during all four time periods studied. Again, this is exceptionally rare. The table below shows us that it's happened only six times, most of which differ from the signals in the above tables. Returns after these weren't as pristine, primarily due to the global financial crisis in 2008. The last signal from April 2018 also preceded mediocre returns at best.
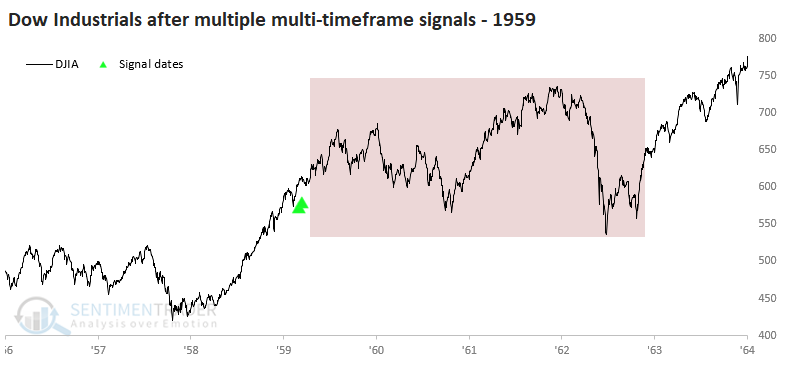
When we combine both studies, there were almost no precedents. There were only two times in 124 years when the Dow rose at least 60% of the time across all four time frames, and its average percentage of rising periods was 66% or higher.
When the signals were triggered in 1959, the Dow continued rising for several months. But then it entered a period of wide swings that frustrated bulls and bears alike. It made no progress either way until starting a new sustained trend in 1963.
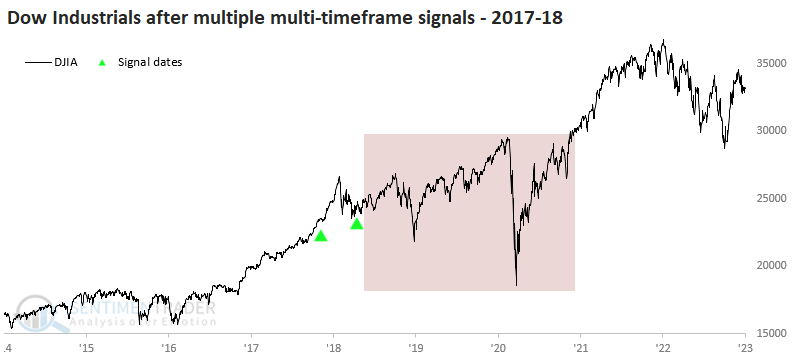
The only other period with multiple signals in a compressed time frame was 2017-18. Once again, the Dow continued to rise for months but then fell into a funk that lasted for years, finally breaking out with a sustained trend after the pandemic surge.
What the research tells us...
Momentum is a powerful force - usually. It depends on context, measurement criteria, and sector. The broader the index, the more probable that momentum will continue. The more niche and defensive, the more unlikely it will. While the Dow Industrial Average is not a broad index, it is one of the oldest and most studied in the world, and momentum is an absolute force.
The buying pressure the index has enjoyed across time frames is truly historic. And, for the most part, this has been a good sign, at least for another 6-9 months. After that, the precedents dwindle further, especially those that show sustained gains. The 1995-2000 period is the only one that managed a prolonged, impressive continuation of the momentum, and bulls need to hope that the AI revolution is comparable to the internet bubble.