Products
SentimenTrader Trading Tools
‍
Backtest Engine
My Trading Toolkit
Correlation Analysis
Seasonality
Market Prediction
Indicators & Data API
‍
Proprietary Indicators & Charts
Market Data API
Strategies & Scanner
‍
50+ Trading Strategies
Smart Stock Scanner
Smart Option Scanner
Research Reports
‍
Research Solutions
Reports Library
Free Resources
Simple Backtest Calculator
Simple Seasonality Calculator
The Kelly Criterion Calculator
Sentiment Geo Map
Public Research Reports
Education
Sentiment Indicators
Technical Indicators
Pricing
Company
About
In the News
Testimonials
Client Success Stories
Contact
Log inLoginSign up
< BACK TO ALL REPORTS

The dollar's big counter trend rally

Jason Goepfert
2023-03-01
The U.S. dollar rallied strongly over the past month, which has upended some of the trends in other markets that began in October. Similar rallies in the buck showed a strong tendency to fail, which also tended to precede gains in U.S. and emerging market stocks, as well as gold.

Key points:

  • Over the past month, the U.S. dollar has jumped more than 3%
  • That comes on the heels of what had been a 9-month low
  • Similar rallies in the dollar showed a strong tendency to fail, with positive implications for other markets

Strong counter-trend rallies in the dollar tend to fail

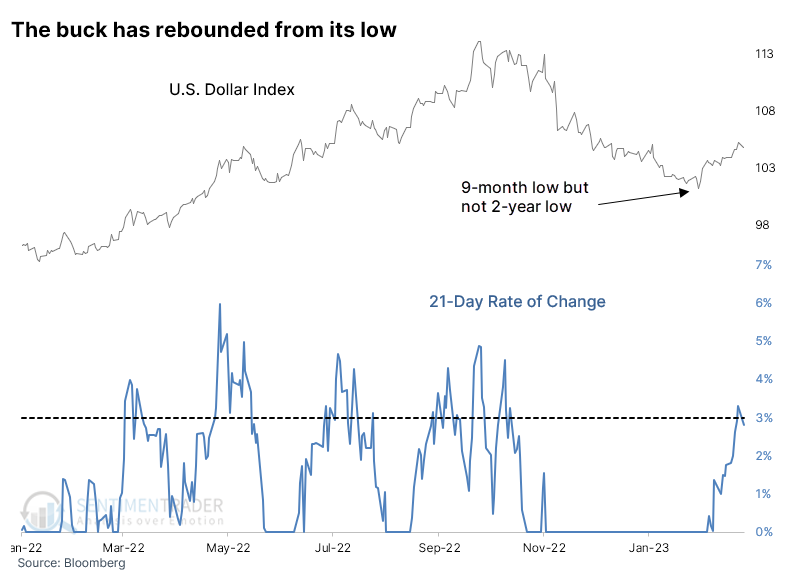
Investors have had a renewed focus on the U.S. dollar in recent weeks, which has helped to upend some trends in place since October.

The dollar has enjoyed a strong rebound over the past several weeks, with a 21-day rate of change of more than 3%. The rally is coming on the heels of at least a 9-month low in the dollar, but not a 2-year low. Meaning, it has been a counter-trend rally that was not within a prolonged downtrend.

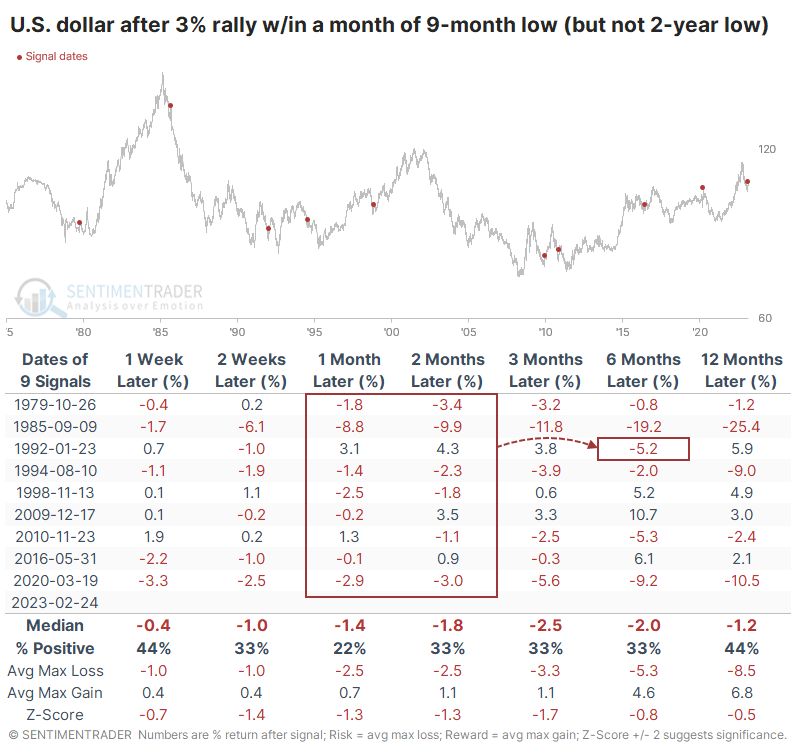
After similar rebounds, the dollar struggled to hold its gains. It sported a negative return after all but one signal either one or two months later. The only exception was in 1992; that rally petered out in the months ahead.

A dollar counter-trend rally's impact on other markets

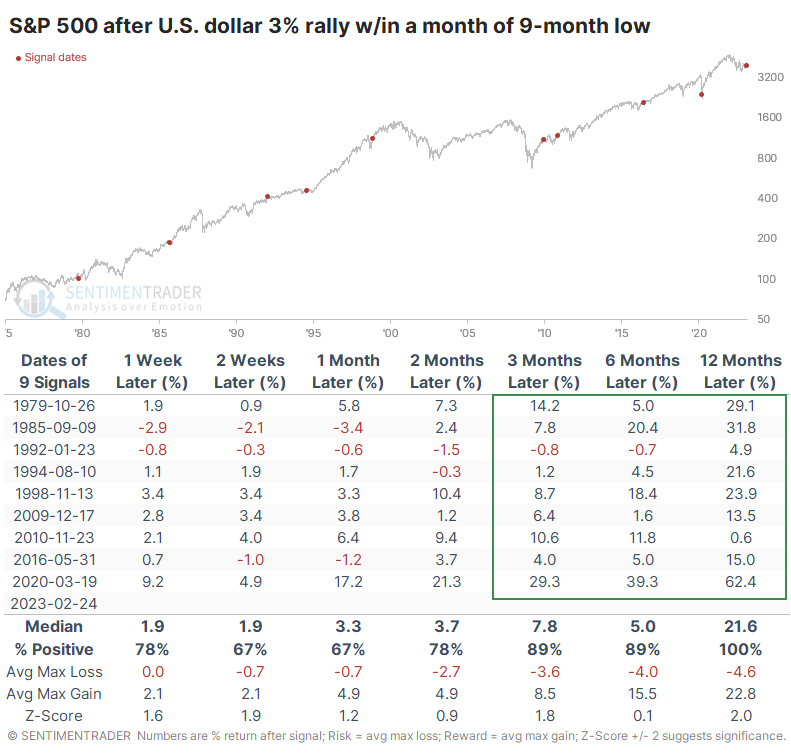
For the S&P 500, the failure of the dollar to follow through on its counter-trend rallies was a good sign. Over the next 3-12 months, there were no losses of any magnitude, and a year later, the index sported a positive return every time. The maximum gain within the next year averaged more than five times the average drawdown.

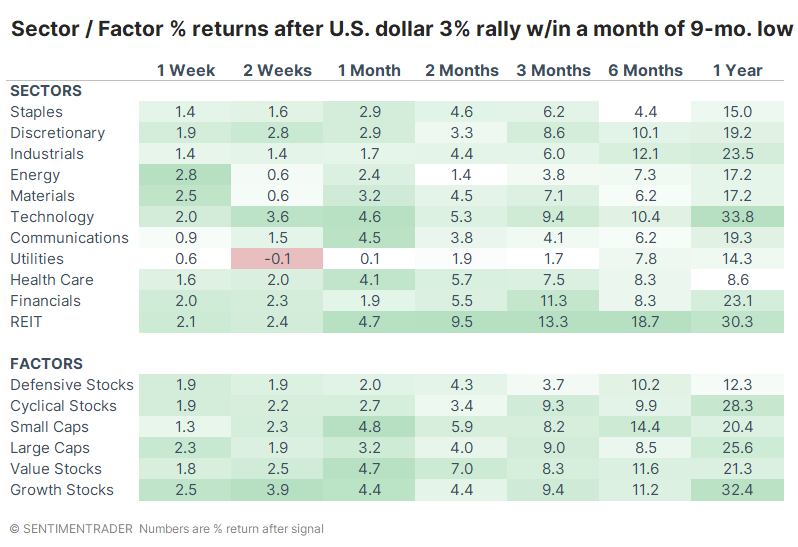
Technology, Financials, REITs, and Industrials enjoyed the strongest returns among sectors and factors.

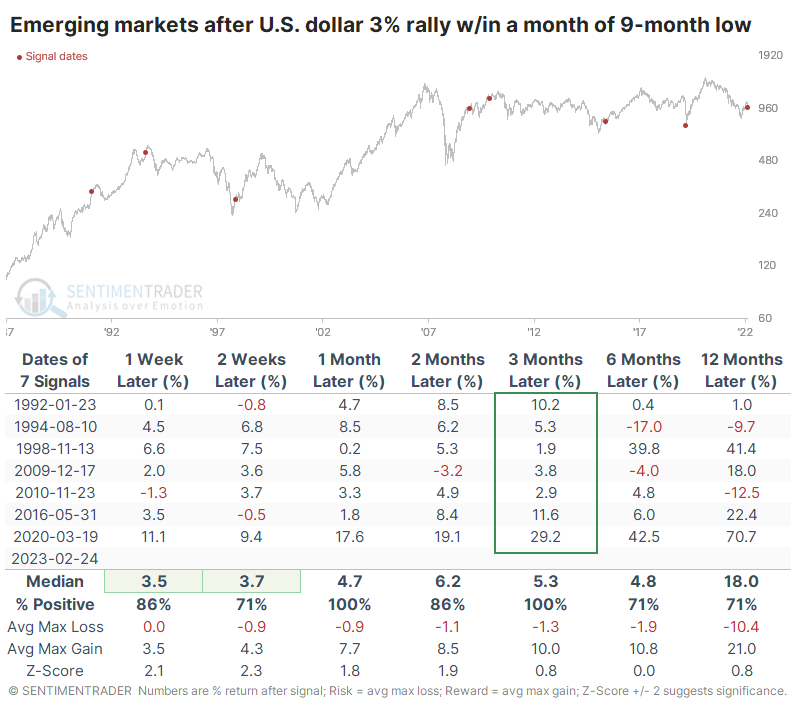
There were two fewer signals for Emerging Market stocks due to limited data. Over the next three months, all signals showed a positive return, though two of those fell hard in the months ahead.

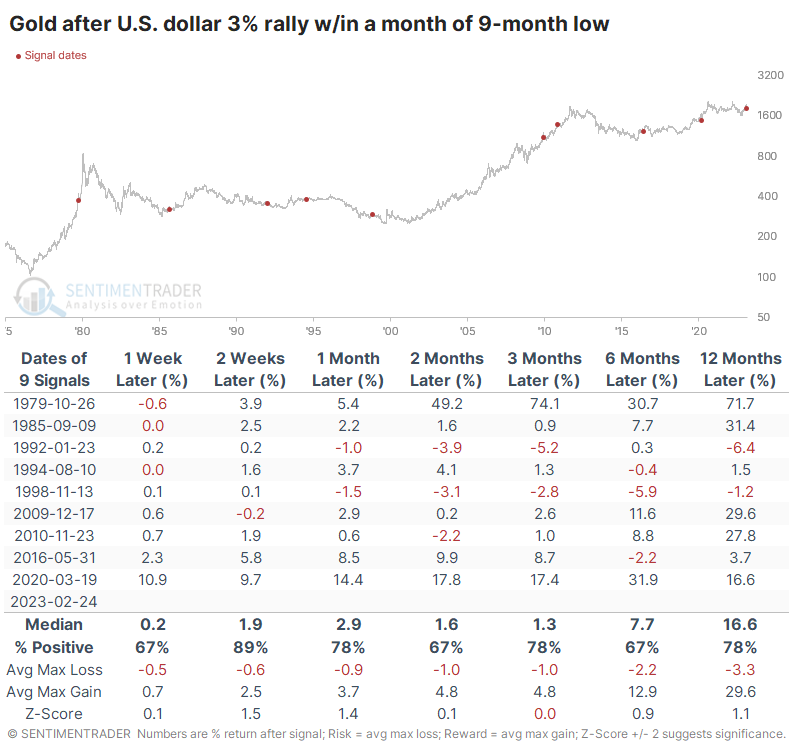
If the dollar struggles, that usually means good things for gold. While there were some losses, gold rallied over the next few months after 7 of the 9 signals. For the most part, gold did quite well, with mostly limited losses and potentially substantial gains.

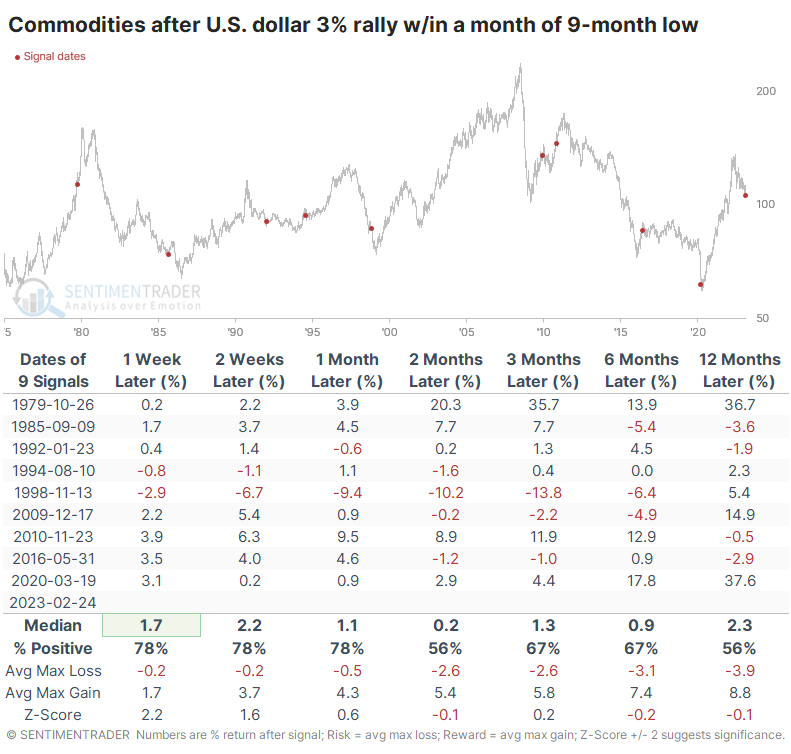
Commodities, in general, also tended to rebound, though it was primarily loaded in the short term.

What the research tells us...

In recent weeks, many trends in place across markets since October have reversed. Some of that has been driven by a rebounding U.S. dollar, which has a powerful impact on commodities and overseas returns. However, the type of rally the dollar has enjoyed appears to be counter-trend. Similar patterns had a strong tendency to reverse once again, leading to negative returns for the dollar and positive ones for most other markets.

PRODUCTS
SentimenTrader
Trading Tools
Indicators & Data API
‍
Strategies & Scanner
‍
Research Reports
FREE
RESOUrCES
Simple Backtest
Calculator
Simple Seasonality
Calculator
The Kelly Criterion
Calculator
Sentiment Geo Map
‍
Public Research Reports
‍
Education
Sentiment Indicators
‍
Technical Indicators
‍
Pricing
Bundle pricing
‍
FAQ
‍
Announcements
‍
COMPANY
‍
About
‍
In the News
‍
Testimonials
‍
Client Success Stories
CONTACT
‍
General Inquiries
‍
Media Inquiries
‍
Financial Professionals Inquiries
‍
© 2026 Sundial Capital Research Inc. All rights reserved.
Setsail Marketing
TermsPrivacyAffiliate Program
Risk Disclosure: The information and tools provided are for research and analytical purposes only and are not intended as investment advice. Market analysis involves uncertainty, and outcomes may differ from expectations. Users should conduct their own due diligence and consider their individual circumstances before making any financial decisions. Past performance is not necessarily indicative of future results.

Hypothetical Performance Disclosure: Hypothetical performance results have many inherent limitations, some of which are described below. No representation is being made that any account will or is likely to achieve profits or losses similar to those shown; in fact, there are frequently sharp differences between hypothetical performance results and the actual results subsequently achieved by any particular trading program. One of the limitations of hypothetical performance results is that they are generally prepared with the benefit of hindsight. In addition, hypothetical trading does not involve financial risk, and no hypothetical trading record can completely account for the impact of financial risk of actual trading. for example, the ability to withstand losses or to adhere to a particular trading program in spite of trading losses are material points which can also adversely affect actual trading results. There are numerous other factors related to the markets in general or to the implementation of any specific trading program which cannot be fully accounted for in the preparation of hypothetical performance results and all which can adversely affect trading results.

Testimonial Disclosure: Testimonials appearing on this website may not be representative of other clients or customers and is not a guarantee of future performance or success.