
The dollar suffers a historic decline and increasing pessimism

Key points:
- Optimism on the U.S. dollar has faded, and sour sentiment tends to precede poor returns
- The dollar's historic 5-day decline to a new low also tends to precede fragile returns
- Other assets, especially stocks, have benefitted from poor action in the dollar
Sentiment is souring on the dollar after historic decline
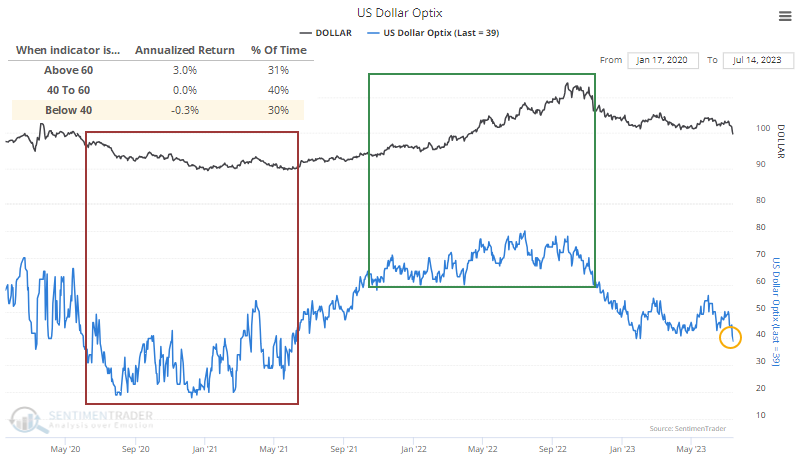
The U.S. dollar is losing ground quickly, and traders are giving up. For the first time in two years, the dollar's Optimism Index has dropped below 40.
But sentiment on trending assets like currencies and some commodities doesn't work as well as it does in a "bouncy" market like stocks. For the most part, when sentiment is poor on a currency, it tends to keep declining, and vice-versa. We can see that in the chart below - the buck's annualized return with an Optimism Index (Optix) below 40 was -0.3%.
During strong uptrends, sentiment tends to get high and stay high. During downtrends, pessimism is rampant, and the currency tends to sink. At some point, sentiment becomes so extreme that the trend reverses, but we're far from that point now. That's the general pattern with how sentiment works, but it tends to be exacerbated for currencies, with sentiment getting stuck at mediocre extremes for longer.
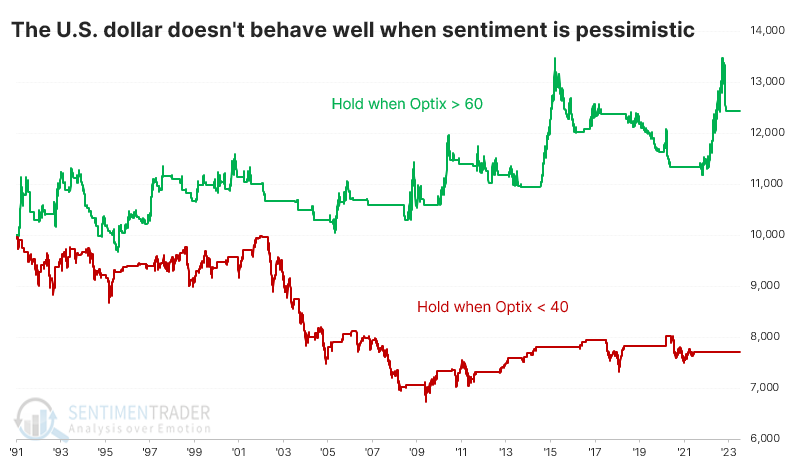
We can see this another way in the equity curve lines below. It simply buys and holds the dollar for the next trading day when the Optix is above 60 (green line) or below 40 (red line). Over the past 32 years, $10,000 grew to $12,435 when Optix was above 60 but fell to $7,702 when Optix was below 40. Neither result is adequate for a trading program; it's just meant to show that using mediocre extremes as a mean-reversion strategy was unsuccessful.
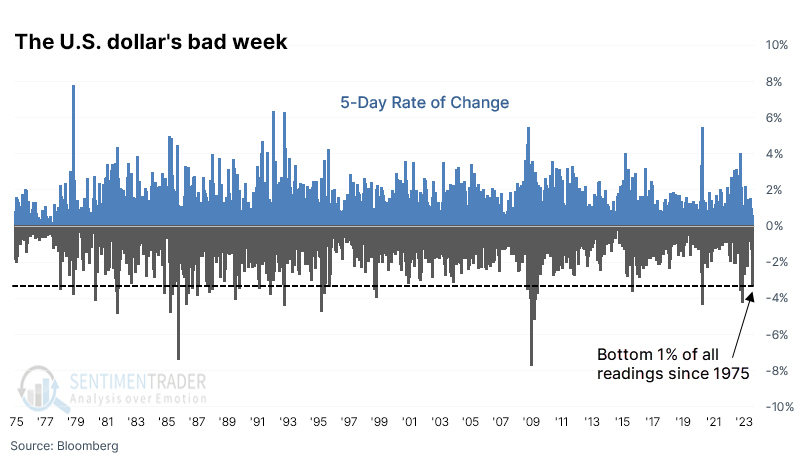
It's hard to blame dollar bulls for losing faith after a 5-day stretch that was one of the worst in years. The dollar dropped more than 3% over five days while skidding to its lowest level in over a year at the same time.
Big declines tend to precede more losses
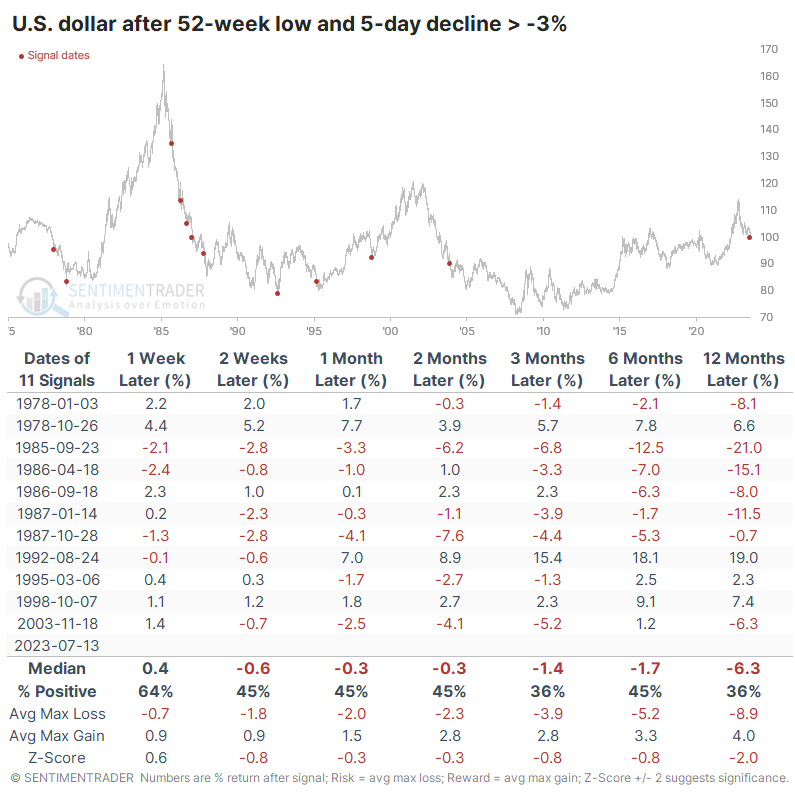
The combination of a historic one-week decline and a 52-week low has not been kind to the buck. It rebounded over the next three months only 36% of the time with more risk than reward. A few signals marked exhaustion points, though two didn't trigger until the dollar had already suffered a multi-year decline.
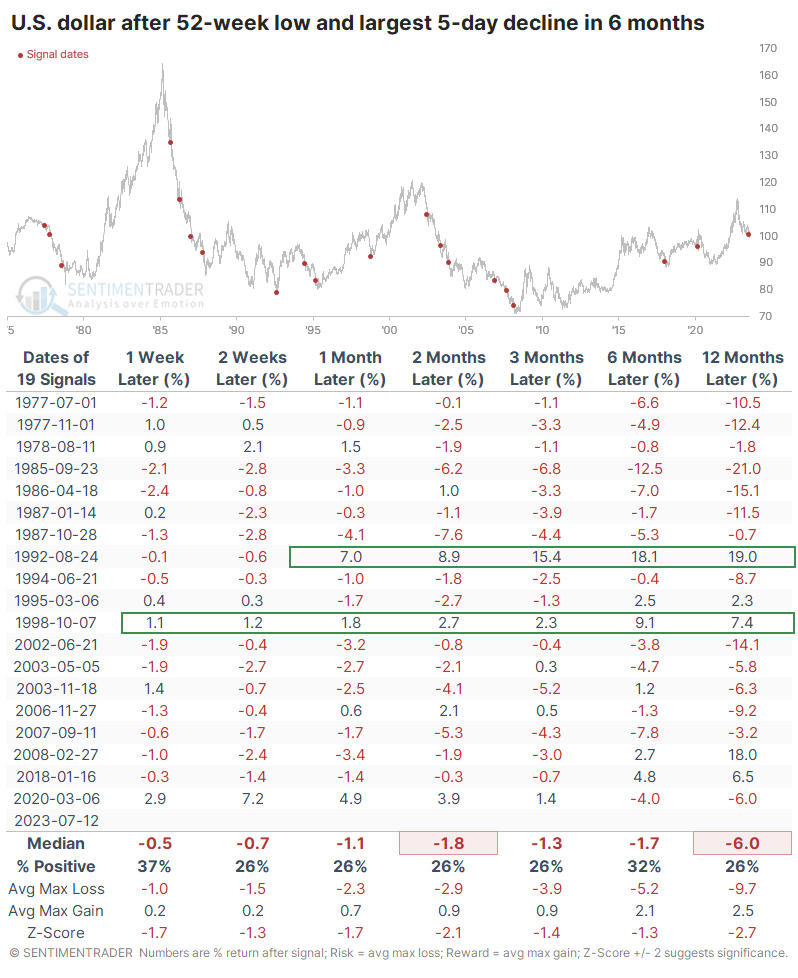
Let's relax the parameters and look at 52-week lows, but with a one-week loss that was the worst in at least six months. Using a 3% loss was too strict based on the dollar's relatively subdued volatility.
These results were even worse. Over the next 2-12 weeks, the buck rallied only 26% of the time, with risk about two to three times greater than reward. Out of 19 precedents, only 2 showed gains across most time frames. All the others were pretty consistent losers. Only four signals managed more reward than risk over the next three months.
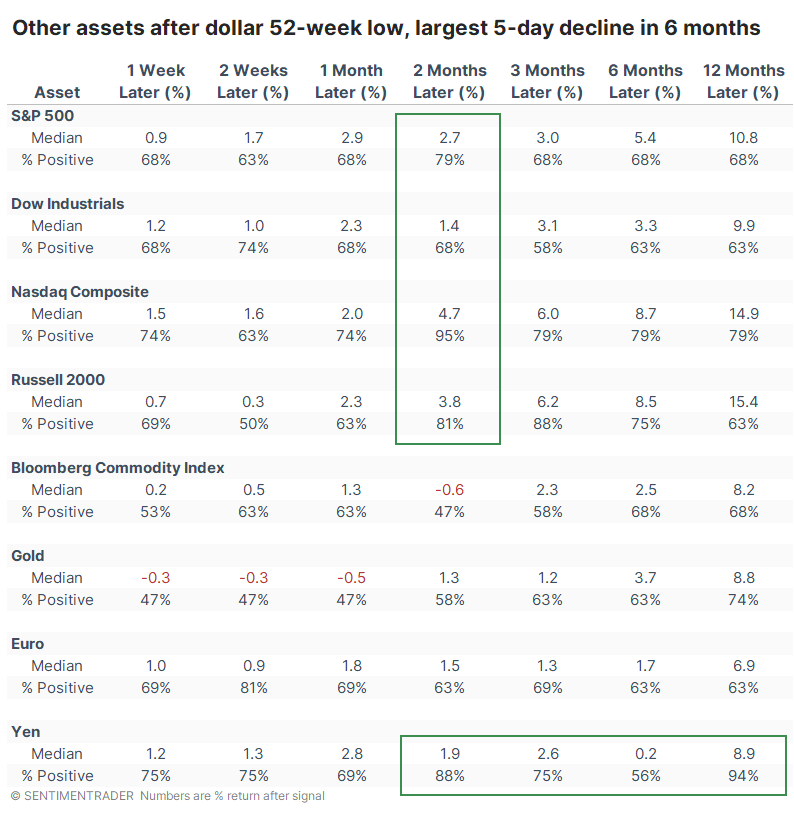
Among other assets, stocks tended to do quite well after the dollar suffered. All the major indexes rallied well, with the most consistent gains in the Nasdaq Composite and Russell 2000. It's not shown in the table, but since 1990, the MSCI Emerging Markets Index showed a median return of +12.2% over the next three months with 9 winners out of 12 signals and only one loss larger than -4%.
What the research tells us...
Sentiment on the U.S. dollar has soured thanks to a historic decline over a recent one-week stretch. It's not yet to the point that could be considered extreme, and mediocre readings of pessimism in currencies tend to lead to further declines. That has certainly been the case with the dollar, as have significant declines to new lows. Other assets tend to respond well to these big declines in the dollar, especially stocks and (of course) other currencies.