Products
SentimenTrader Trading Tools
‍
Backtest Engine
My Trading Toolkit
Correlation Analysis
Seasonality
Market Prediction
Indicators & Data API
‍
Proprietary Indicators & Charts
Market Data API
Strategies & Scanner
‍
50+ Trading Strategies
Smart Stock Scanner
Smart Option Scanner
Research Reports
‍
Research Solutions
Reports Library
Free Resources
Simple Backtest Calculator
Simple Seasonality Calculator
The Kelly Criterion Calculator
Sentiment Geo Map
Public Research Reports
Education
Sentiment Indicators
Technical Indicators
Pricing
Company
About
In the News
Testimonials
Client Success Stories
Contact
Log inLoginSign up
< BACK TO ALL REPORTS

The Dollar Index shifts from a bearish to a bullish trend

Dean Christians
2023-09-15
A trading system that uses a price channel breakout methodology triggered a new buy signal for the Dollar Index (DXY). After similar alerts, the DXY saw an increase 79% of the time over the subsequent three months. Stocks and energy commodities tend to rally while precious metals languish.

Key points:

  • A trend-following breakout system triggered a new buy signal for the Dollar Index (DXY) 
  • After similar breakouts, the DXY shows a strong tendency to rally further over the following year
  • Stocks and energy-related commodities rally while precious metals struggle

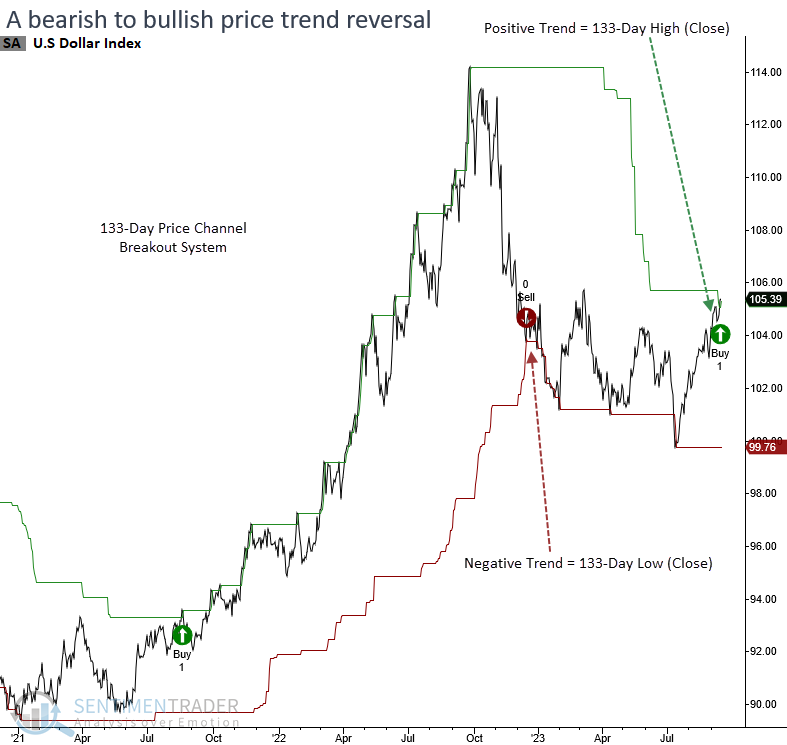
A bullish breakout for the Dollar Index (DXY)

A trend-following system for the Dollar Index (DXY) reversed from bearish to bullish, ushering in a new uptrend for the world's reserve currency. The system uses a price channel breakout methodology made famous by Richard Donchian, a pioneer in the managed futures industry. 

After historical testing, I determined that a 133-day high or low breakout provided the optimal timeframe for a Dollar Index (DXY) trading system.

The previous buy signal occurred in August 2021, which led to a substantial gain in the Dollar Index over the subsequent year.

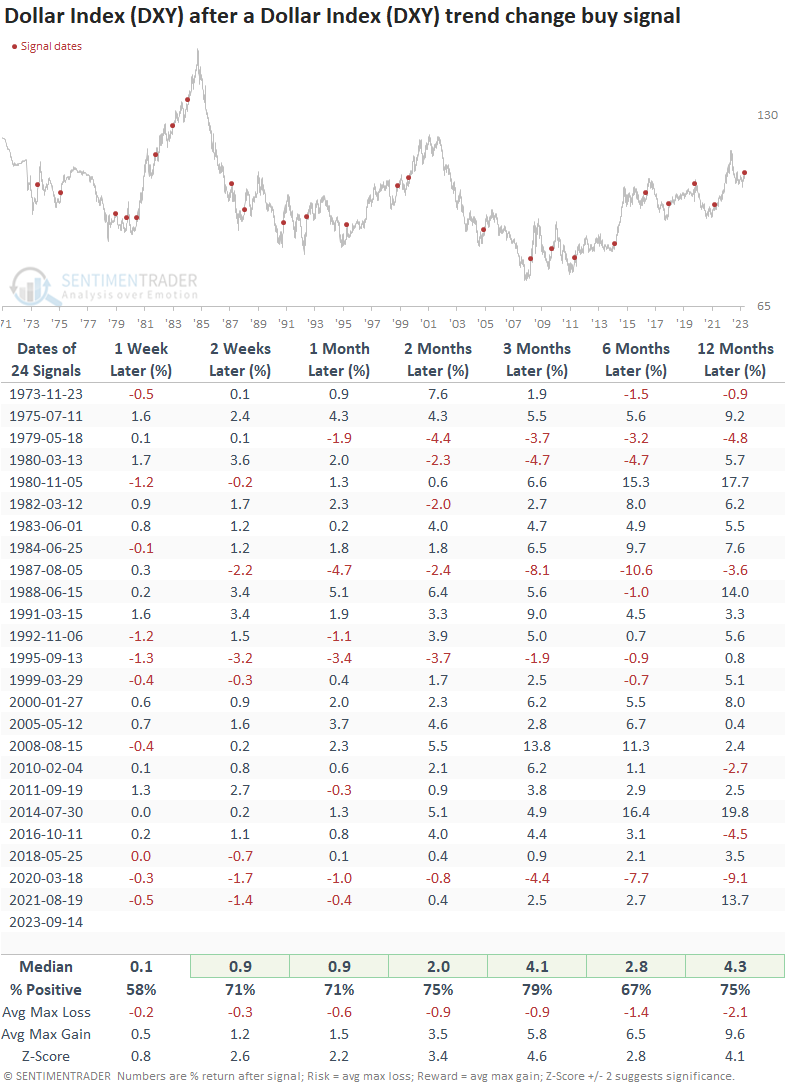
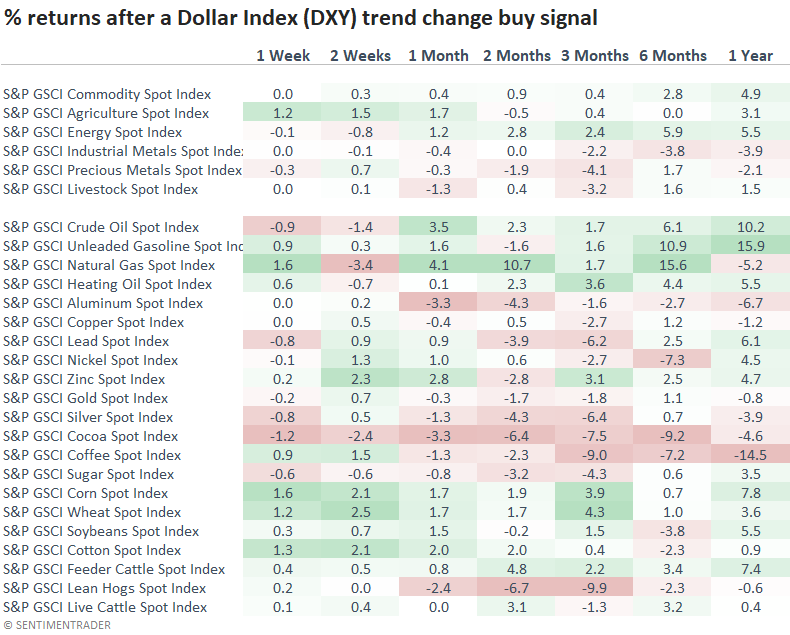
Similar breakout signals preceded positive returns for the Dollar Index

As clearly indicated by the outlook table, currencies typically exhibit a strong tendency to follow the direction of breakout signals. At some point in the first six months, the Dollar Index (DXY) experienced gains in all but one preceding instance. 

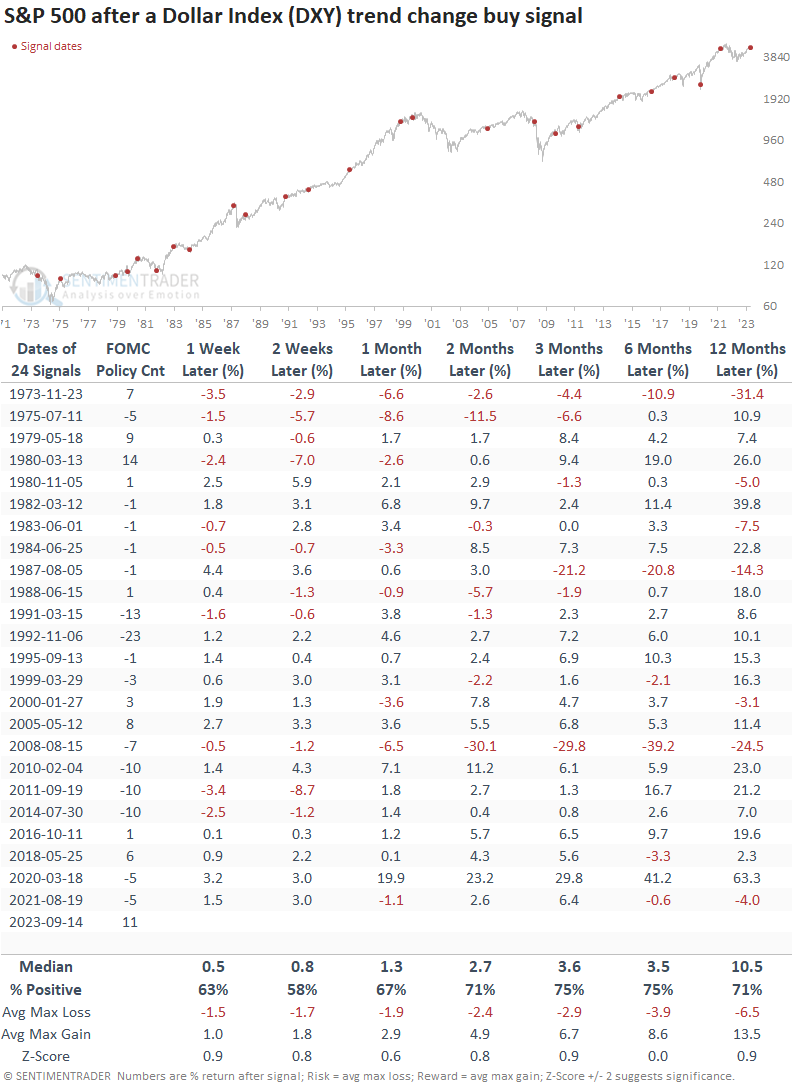
Stocks rally when the Dollar Index breaks out

The bullish trend change in the Dollar Index does not mark an unfavorable environment for stocks unless the S&P 500 is in a clearly defined downtrend like 1973 and 2008, which is not the case now.

Signals associated with an FOMC tightening cycle also display positive returns over all time frames. Except for 1973, every precedent showed a positive return at some point in the first three months.

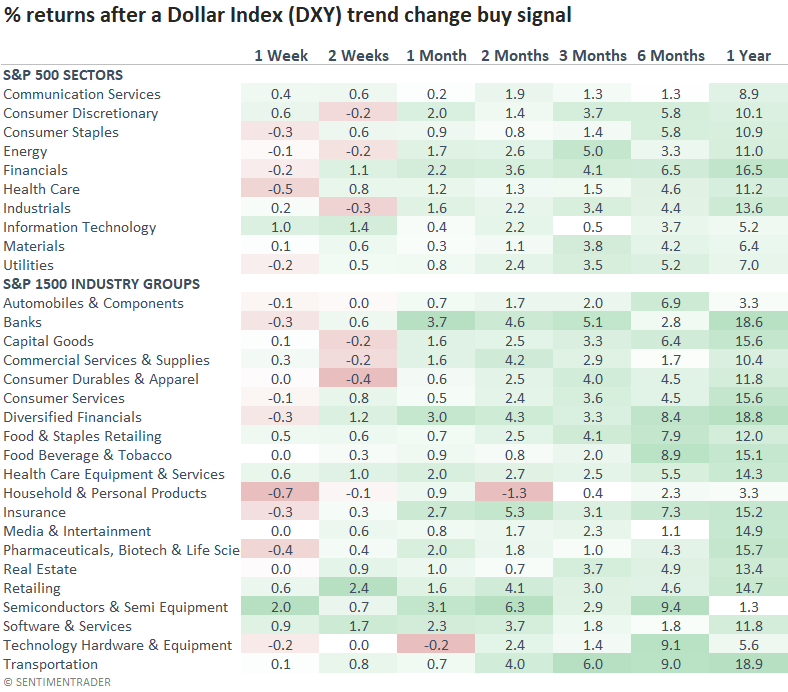
Most sectors and industries show weak results in the first few weeks. Despite a brief lull, the overall outlook for medium and long-term returns is solid. The lackluster returns in Technology suggest companies in that sector, which derive a large percentage of revenues globally, could struggle as an increase in the dollar becomes a headwind.

Keep an eye on energy and avoid precious metals

Should a broad-based commodity index see further gains, bullish trends in energy-related commodities could be the primary contributing factor.

When should we be concerned about the dollar?

When the Dollar Index (DXY) experiences a surge of 10% or more in the preceding 26 weeks, the S&P 500 and sectors tied to commodities tend to react negatively. 

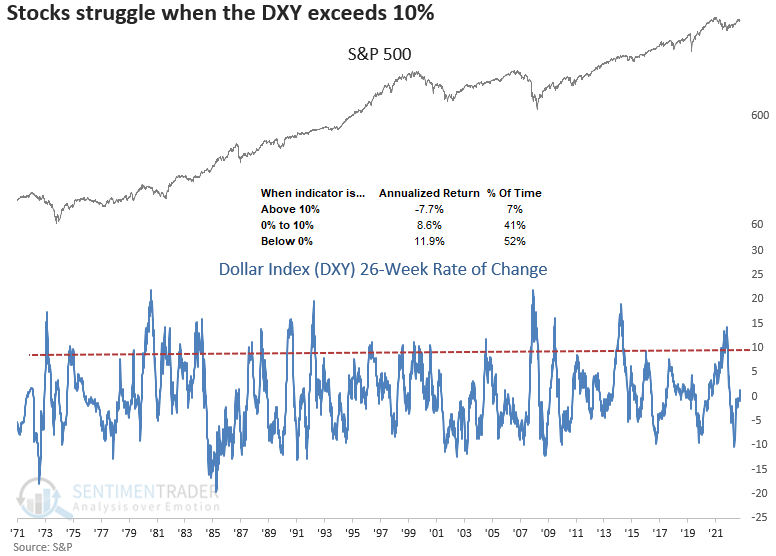
What the research tells us...

The Dollar Index has embarked on a new uptrend based on a trend-following breakout system. After similar trend change signals, the Dollar Index and stocks tend to rally over the subsequent year. The energy group displays the best outlook within the commodity complex, aligning with current trends. Technology, a recent relative winner amongst sectors, could struggle on a go-forward basis, given that the sector derives a significant percentage of revenues from overseas. With the 26-week rate of change for the Dollar Index well below 10%, the DXY shouldn't present an imminent headwind for the S&P 500.

PRODUCTS
SentimenTrader
Trading Tools
Indicators & Data API
‍
Strategies & Scanner
‍
Research Reports
FREE
RESOUrCES
Simple Backtest
Calculator
Simple Seasonality
Calculator
The Kelly Criterion
Calculator
Sentiment Geo Map
‍
Public Research Reports
‍
Education
Sentiment Indicators
‍
Technical Indicators
‍
Pricing
Bundle pricing
‍
FAQ
‍
Announcements
‍
COMPANY
‍
About
‍
In the News
‍
Testimonials
‍
Client Success Stories
CONTACT
‍
General Inquiries
‍
Media Inquiries
‍
Financial Professionals Inquiries
‍
© 2026 Sundial Capital Research Inc. All rights reserved.
Setsail Marketing
TermsPrivacyAffiliate Program
Risk Disclosure: The information and tools provided are for research and analytical purposes only and are not intended as investment advice. Market analysis involves uncertainty, and outcomes may differ from expectations. Users should conduct their own due diligence and consider their individual circumstances before making any financial decisions. Past performance is not necessarily indicative of future results.

Hypothetical Performance Disclosure: Hypothetical performance results have many inherent limitations, some of which are described below. No representation is being made that any account will or is likely to achieve profits or losses similar to those shown; in fact, there are frequently sharp differences between hypothetical performance results and the actual results subsequently achieved by any particular trading program. One of the limitations of hypothetical performance results is that they are generally prepared with the benefit of hindsight. In addition, hypothetical trading does not involve financial risk, and no hypothetical trading record can completely account for the impact of financial risk of actual trading. for example, the ability to withstand losses or to adhere to a particular trading program in spite of trading losses are material points which can also adversely affect actual trading results. There are numerous other factors related to the markets in general or to the implementation of any specific trading program which cannot be fully accounted for in the preparation of hypothetical performance results and all which can adversely affect trading results.

Testimonial Disclosure: Testimonials appearing on this website may not be representative of other clients or customers and is not a guarantee of future performance or success.