
The dollar and commodities heading for an inflection point

Key points
- The U.S. Dollar has been rallying, and seasonality remains favorable - sort of
- However, a seemingly unrelated indicator is flashing a warning sign for the year ahead
- This warning sign is unfavorable for the dollar BUT favorable for commodities as an asset class, particularly the grain markets
The U.S. Dollar has shown strength…not unexpectedly
U.S. Dollar futures have been trading in a range for most of 2024, as apparent in the chart below.
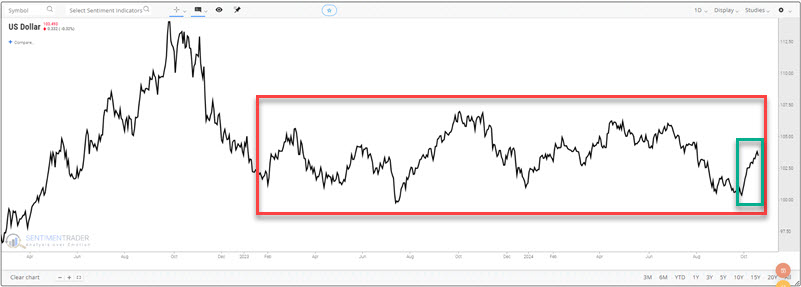
The dollar has bounced sharply off the September 2024 low (see the smaller green box in the chart above). This is not entirely surprising, given the dollar's seasonal pattern in the chart below. There appears to be a potential continued upside.
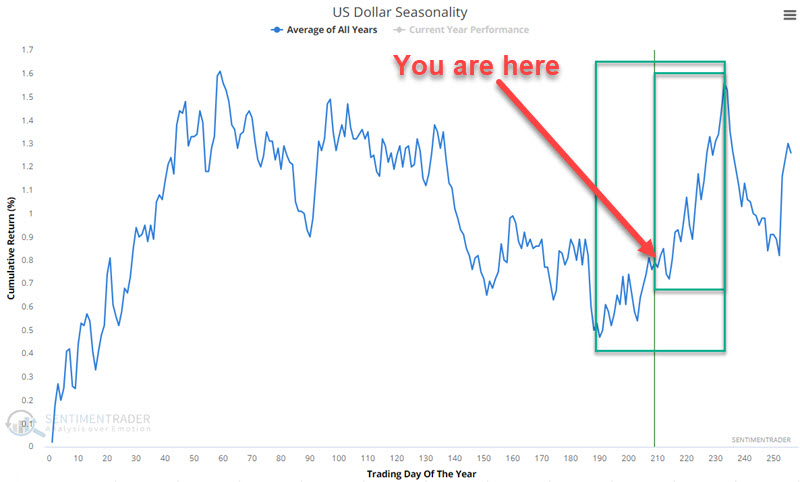
There are two caveats here. First, seasonality is not a roadmap, and it should never be assumed that any market, ETF, or index will follow the annual average exactly. Also, if we look at historical performance from the current trading day of the year (#209) through TDY #233 (i.e., the smaller green box in the chart above), we get some mixed results. The chart below displays the hypothetical growth of $1 in the dollar only from TDY #209 through #233 every year since 1985.
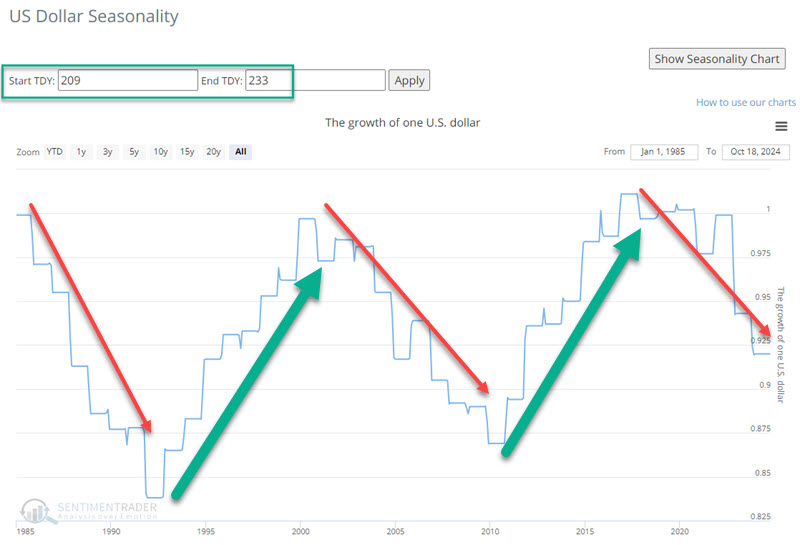
Notice the tendency for performance to be good or bad for several years at a time - and the downtrend in recent years. What does it all mean? As long as price action remains strong, it makes sense to look favorably on the U.S. Dollar based on the favorable seasonal trend. At the same time, a trader long the dollar might consider a fairly tight trailing stop to lock in accumulated profits.
Gold Optix flashes a warning for the dollar
Historically, the gold and the U.S. Dollar have trended to trade inversely. However, the last several months have been a huge exception, with both markets rallying strongly. This situation is not likely to last forever.
The chart below highlights all dates when our Gold Optix indicator was above 80% while the U.S. Dollar was above its 100-day moving average. The most recent signal occurred on 2024-10-18.
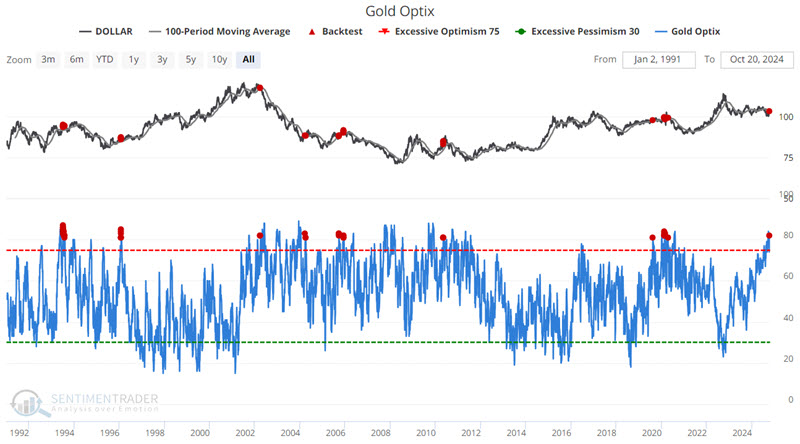
A close look at the chart above reveals that the dollar made little subsequent upside gains in all but one case (1996). The table below summarizes dollar performance following previous signals.
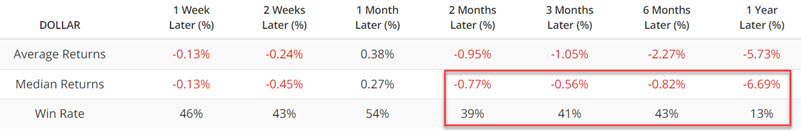
Results are subpar (negative Median Returns and Win Rates below 50%), particularly one year later, with a Win Rate of just 13% for the dollar. So again, at the moment, for the U.S. Dollar, the operative phrase is "Hope for the best, prepare for the worst." But the more time that passes, the greater the likelihood of dollar weakness. This has implications for commodities.
Commodities are a different story
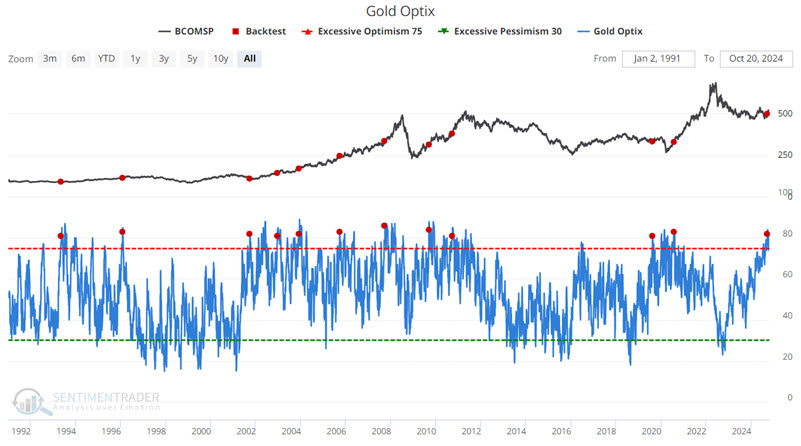
The Bloomberg Commodity Spot Price Index (BCOMSP) tracks a broad basket of commodities and measures the overall performance of commodities as an asset class. The chart below highlights all dates when our Gold Optix indicator was above 80% for the first time in twelve months versus BCOMSP. The most recent signal occurred on 2024-09-20.
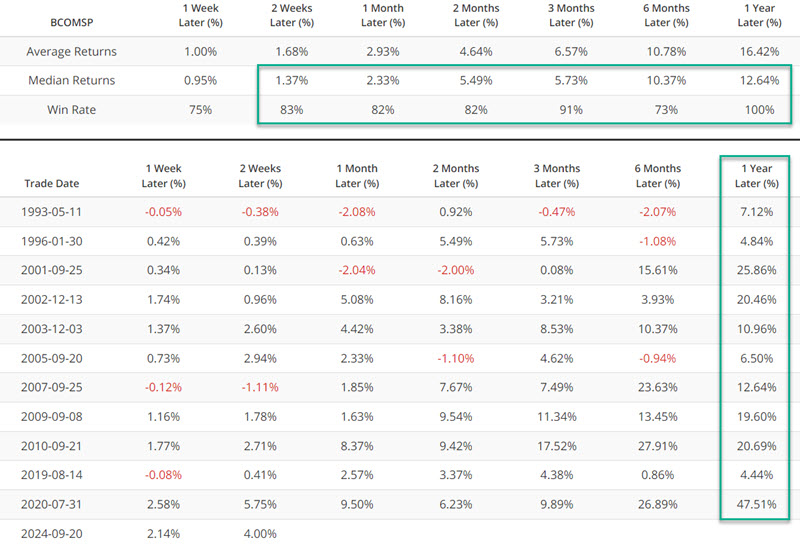
The table below summarizes subsequent BCOMSP performance and displays signal-by-signal results. The critical thing to note is the high win rates virtually across the board.
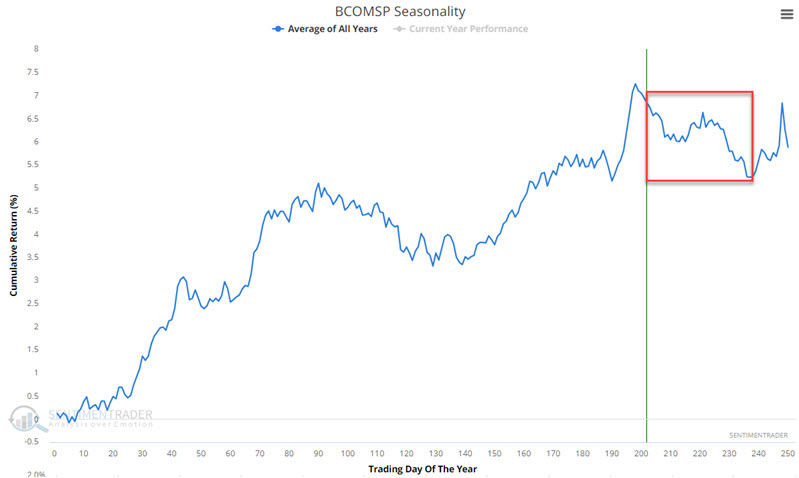
Meanwhile, commodities as an asset class have the same, though inverse, problem regarding seasonality as the U.S. Dollar. The chart below displays the annual seasonal trend for BCOMSP. As you can see, we are presently within one of the typically weaker periods of the year for commodities.
The chart below displays the hypothetical growth of $1 invested in BCOMSP only from the current day of the year (TDY #202) through TDY #237. This period extends through the close on 2024-11-22.
The results in the charts above suggest that traders bide their time and start looking for a buying opportunity during the second half of November 2024.
Focusing on the agricultural markets
The ag markets - soybeans, corn, and wheat - have shown significant weakness in recent years. As a trend follower by nature, I am typically hesitant to highlight potential "turnaround" situations. That said, alert traders might soon consider looking for a reversal of fortune in these beaten-down markets.
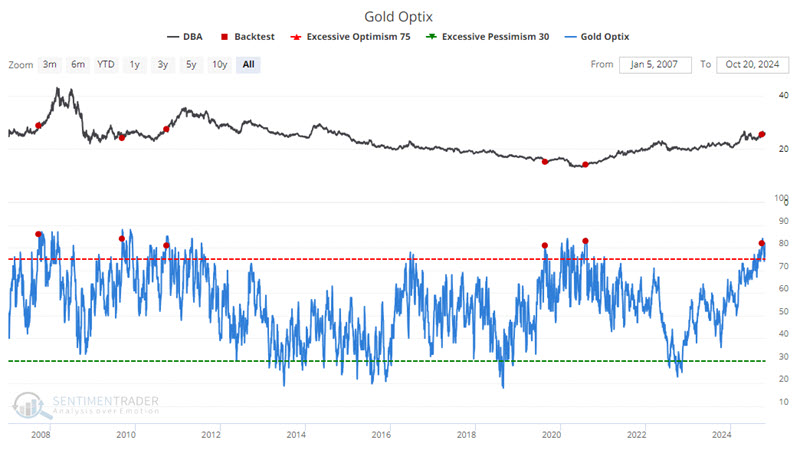
The Invesco DB Agriculture Fund (ticker DBA) is an ETF that tracks a basket of agricultural commodities and offers non-futures traders the opportunity to play the long side of the ag markets. The chart below highlights all dates when our Gold Optix indicator was above 80% for the first time in twelve months versus ticker DBA.

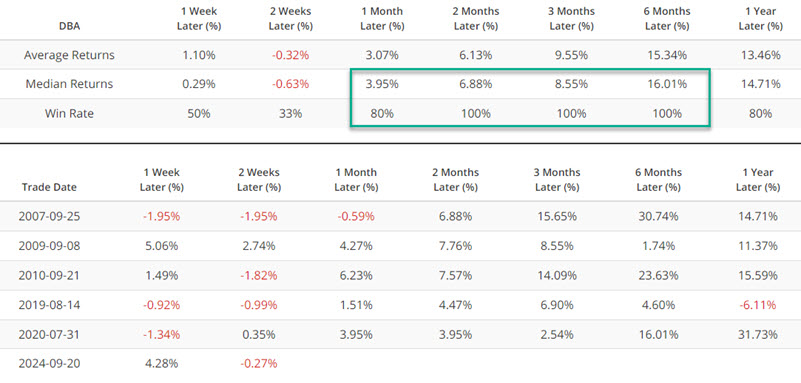
The table below summarizes subsequent DBA performance and displays signal-by-signal results. The most recent signal occurred on 2024-09-20. Note the tendency for positive performance two to six months after a signal.
What the research tells us…
Gold and commodities tend to have an inverse relationship to movements in the U.S. Dollar. The recent high readings from our Gold Optix indicator suggest the potential for strength in commodities - particularly grains - and weakness for the U.S. Dollar in the year ahead. At this point, alert traders should start paying close attention to price action in these markets to pursue trading opportunities. Just note that seasonality could remain a headwind into late November.