Products
SentimenTrader Trading Tools
‍
Backtest Engine
My Trading Toolkit
Correlation Analysis
Seasonality
Market Prediction
Indicators & Data API
‍
Proprietary Indicators & Charts
Market Data API
Strategies & Scanner
‍
50+ Trading Strategies
Smart Stock Scanner
Smart Option Scanner
Research Reports
‍
Research Solutions
Reports Library
Free Resources
Simple Backtest Calculator
Simple Seasonality Calculator
The Kelly Criterion Calculator
Sentiment Geo Map
Public Research Reports
Education
Sentiment Indicators
Technical Indicators
Pricing
Company
About
In the News
Testimonials
Client Success Stories
Contact
Log inLoginSign up
< BACK TO ALL REPORTS

The divergence between energy stocks and crude oil suggests near-term caution

Dean Christians
2022-11-28
Energy stocks and crude oil have diverged by one of the most meaningful amounts in over a decade. After similar patterns, the energy sector and oil outlook appear unfavorable in the near term.

Key points:

  • The energy sector is near the upper end of its recent range, with crude oil at the bottom of its range
  • After similar divergences, energy stocks weakened in the near term
  • Crude oil could see further downside over the next few weeks

Energy stocks are ignoring the significant deterioration in the price of crude oil 

Crude oil closed at a new 63-day low on Friday and is now over 38% below its 252-day high. At the same time, the S&P 500 energy sector closed less than 3% below its respective 252-day high. 

With limited historical cases of the energy sector being down less than 3%, as crude oil is down more than 38% from a high, I'm going to use a range rank methodology to identify divergences.

I will rank the current close relative to all other closing prices over the last 63 days for the S&P 500 energy sector and crude oil. On Friday, the energy sector closed in the 90th percentile, whereas crude oil fell to the lowest possible level, 0%. 

A divergence between the energy sector and crude oil of this magnitude is rare, with the last instance occurring over a decade ago. 

I screened out repeats by requiring the energy sector rank to fall below 45% before a new signal could occur again.

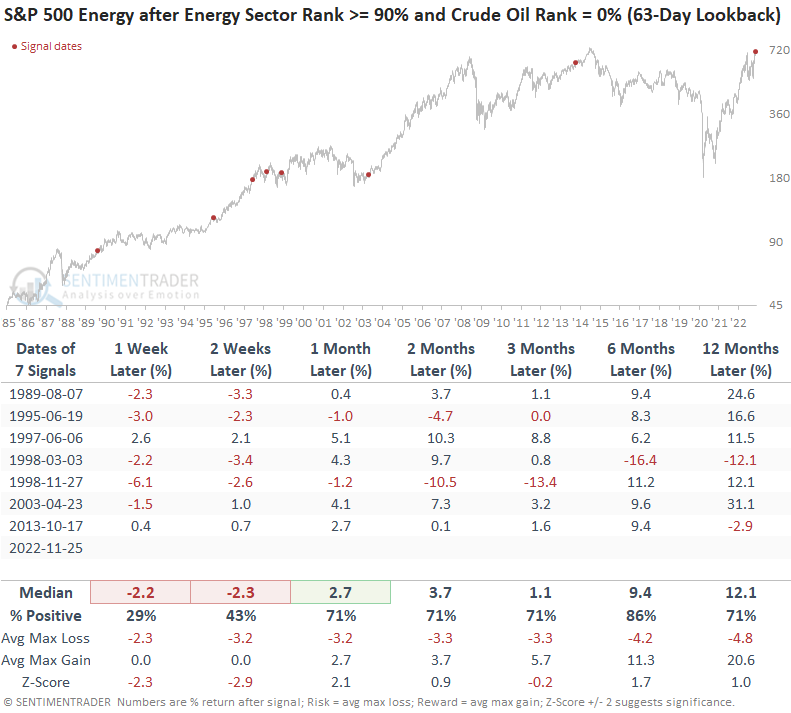
Similar divergences preceded negative returns for energy stocks 

When the energy sector ignores the deterioration in crude oil prices, energy stocks tend to weaken in the near term. The catch-down in the energy sector appears to be nothing more than a consolidation within an uptrend, with one notable exception. The 1997-98 Asian contagion period led to a broad trading range. Could the Chinese government's Covid lockdown policy create a similar scenario?

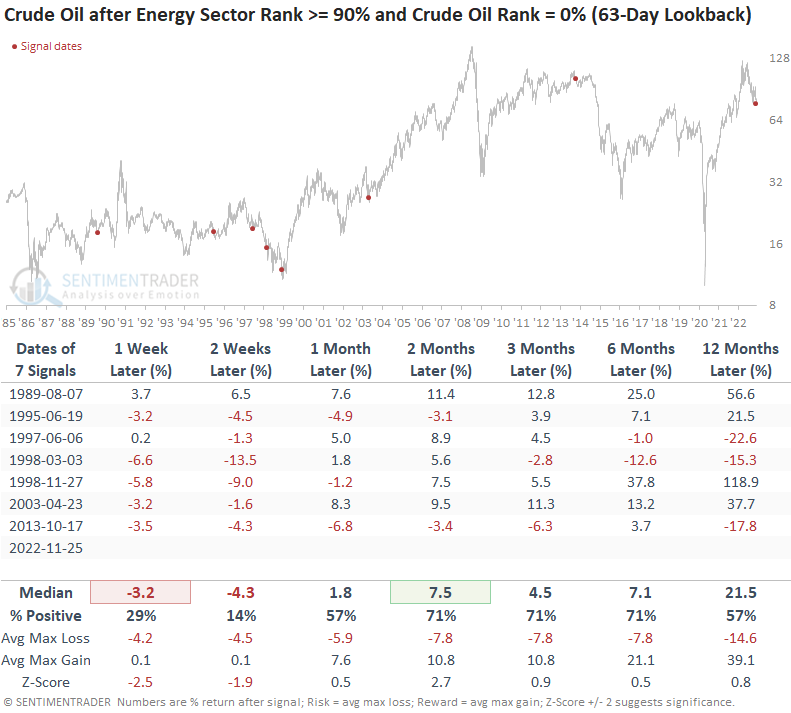
Similar divergences preceded negative returns for crude oil

The weak price trend backdrop for crude oil tends to accelerate further to the downside in the near term, especially two weeks later. As with the energy sector, oil tends to rebound with solid results two months later. Interestingly, the commodity was positive at the two-month mark in all three cases during the Asian contagion.

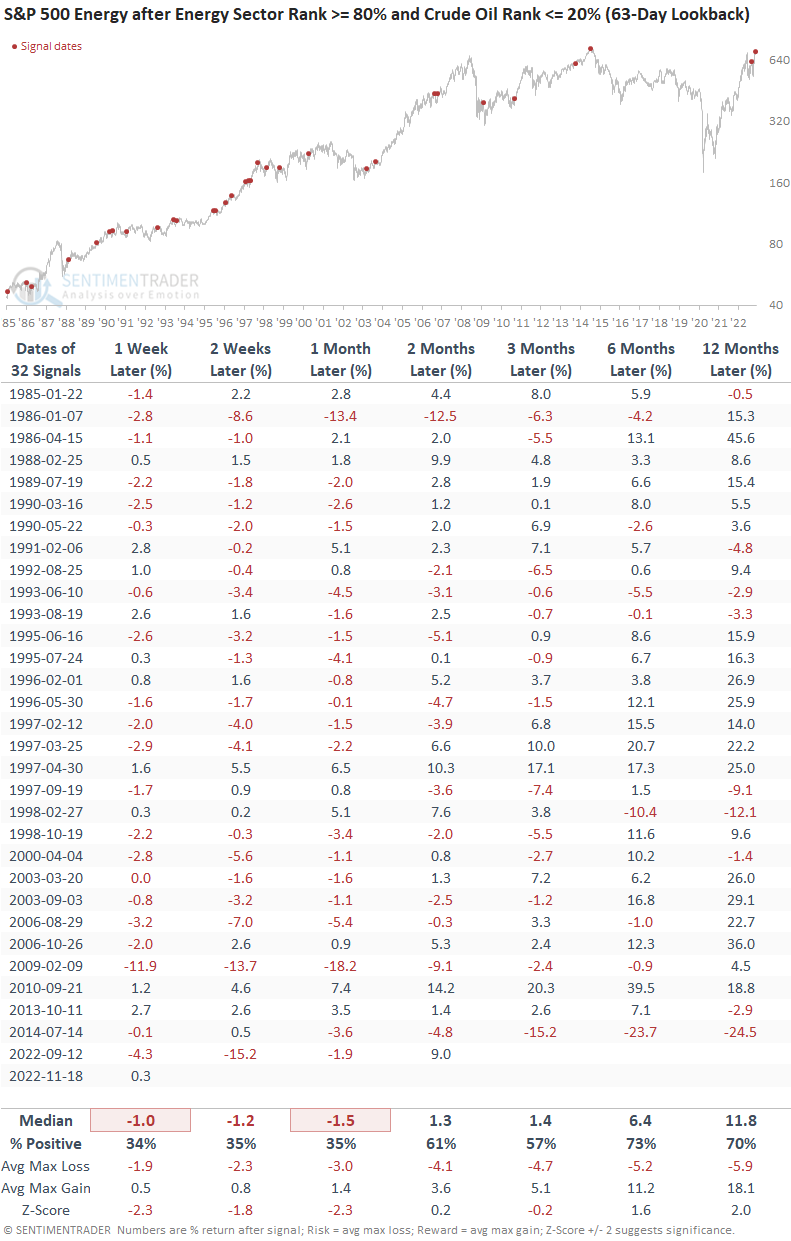
A larger sample size provides a similar message for energy stocks

Let's expand the sample size by adjusting the parameters to capture signals with a range rank of >= 80% and <= 20% over the last 63 days. The relaxed parameters provide a similar message; energy stocks could weaken over the next month.

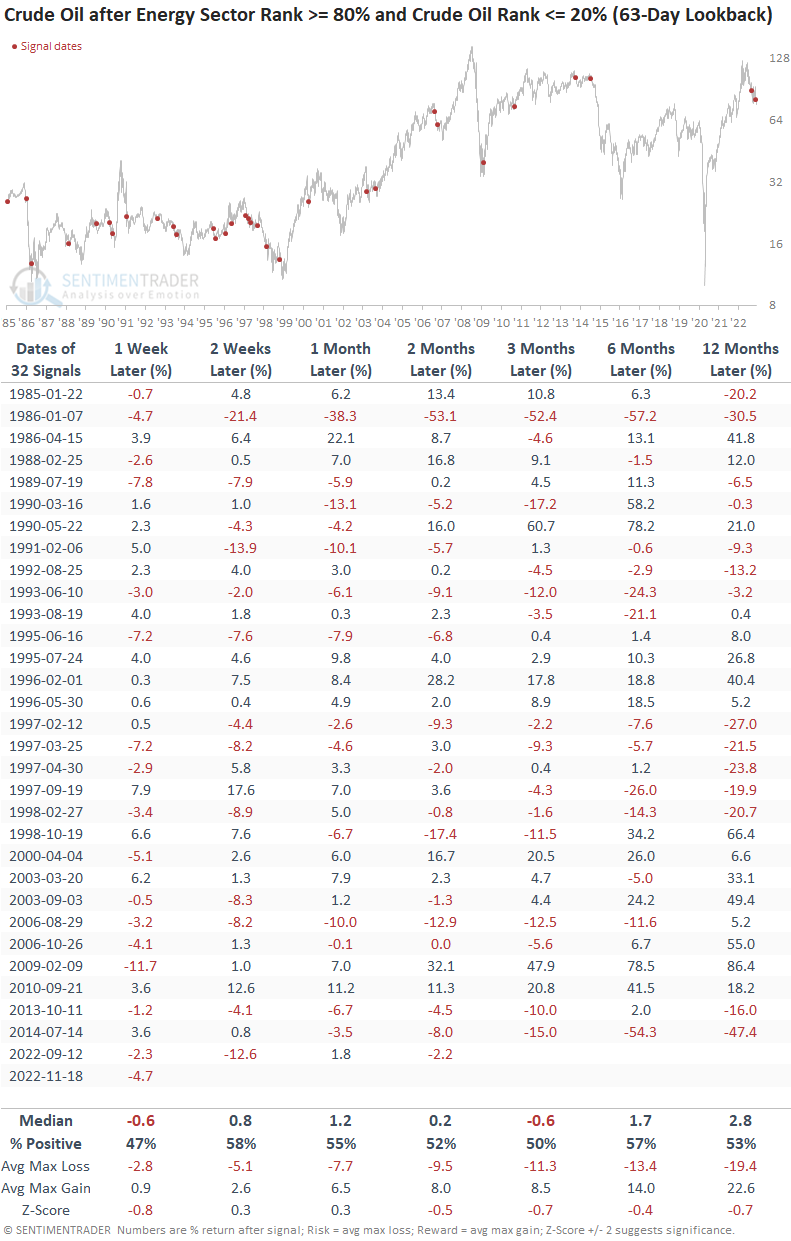
A larger sample size provides a somewhat different outlook for crude oil

When I apply the expanded sample size signal dates to crude oil, the near-term outlook for the commodity is stronger than the original study. However, the medium to long-term picture appears less favorable, with somewhat muted returns.

What the research tells us...

Energy stocks, which tend to outperform in the later stages of an economic expansion and during the initial stages of a contraction, have diverged from crude oil. The disconnect between the energy sector and oil is one of the most significant in over a decade. After similar signals, energy stocks and crude oil prices tend to weaken over the next few weeks. A larger sample size provides a similar negative outlook for the energy sector, with a slightly less pessimistic message for crude oil in the near term.

PRODUCTS
SentimenTrader
Trading Tools
Indicators & Data API
‍
Strategies & Scanner
‍
Research Reports
FREE
RESOUrCES
Simple Backtest
Calculator
Simple Seasonality
Calculator
The Kelly Criterion
Calculator
Sentiment Geo Map
‍
Public Research Reports
‍
Education
Sentiment Indicators
‍
Technical Indicators
‍
Pricing
Bundle pricing
‍
FAQ
‍
Announcements
‍
COMPANY
‍
About
‍
In the News
‍
Testimonials
‍
Client Success Stories
CONTACT
‍
General Inquiries
‍
Media Inquiries
‍
Financial Professionals Inquiries
‍
© 2026 Sundial Capital Research Inc. All rights reserved.
Setsail Marketing
TermsPrivacyAffiliate Program
Risk Disclosure: The information and tools provided are for research and analytical purposes only and are not intended as investment advice. Market analysis involves uncertainty, and outcomes may differ from expectations. Users should conduct their own due diligence and consider their individual circumstances before making any financial decisions. Past performance is not necessarily indicative of future results.

Hypothetical Performance Disclosure: Hypothetical performance results have many inherent limitations, some of which are described below. No representation is being made that any account will or is likely to achieve profits or losses similar to those shown; in fact, there are frequently sharp differences between hypothetical performance results and the actual results subsequently achieved by any particular trading program. One of the limitations of hypothetical performance results is that they are generally prepared with the benefit of hindsight. In addition, hypothetical trading does not involve financial risk, and no hypothetical trading record can completely account for the impact of financial risk of actual trading. for example, the ability to withstand losses or to adhere to a particular trading program in spite of trading losses are material points which can also adversely affect actual trading results. There are numerous other factors related to the markets in general or to the implementation of any specific trading program which cannot be fully accounted for in the preparation of hypothetical performance results and all which can adversely affect trading results.

Testimonial Disclosure: Testimonials appearing on this website may not be representative of other clients or customers and is not a guarantee of future performance or success.