
The DAX dashes to record highs

Key points:
- The German DAX is trading well above its long-term trend, with no technical weakness for months
- It has also enjoyed a historically high Sharpe ratio, though there are some lingering divergences among its stocks
- Similar behavior preceded more gains during the 1980s and 90s, but the index has struggled mightily since then
Hovering well above trend
German stocks have been among the world's hottest for weeks. Investors haven't much cared despite what seems like political discord and economic turmoil.
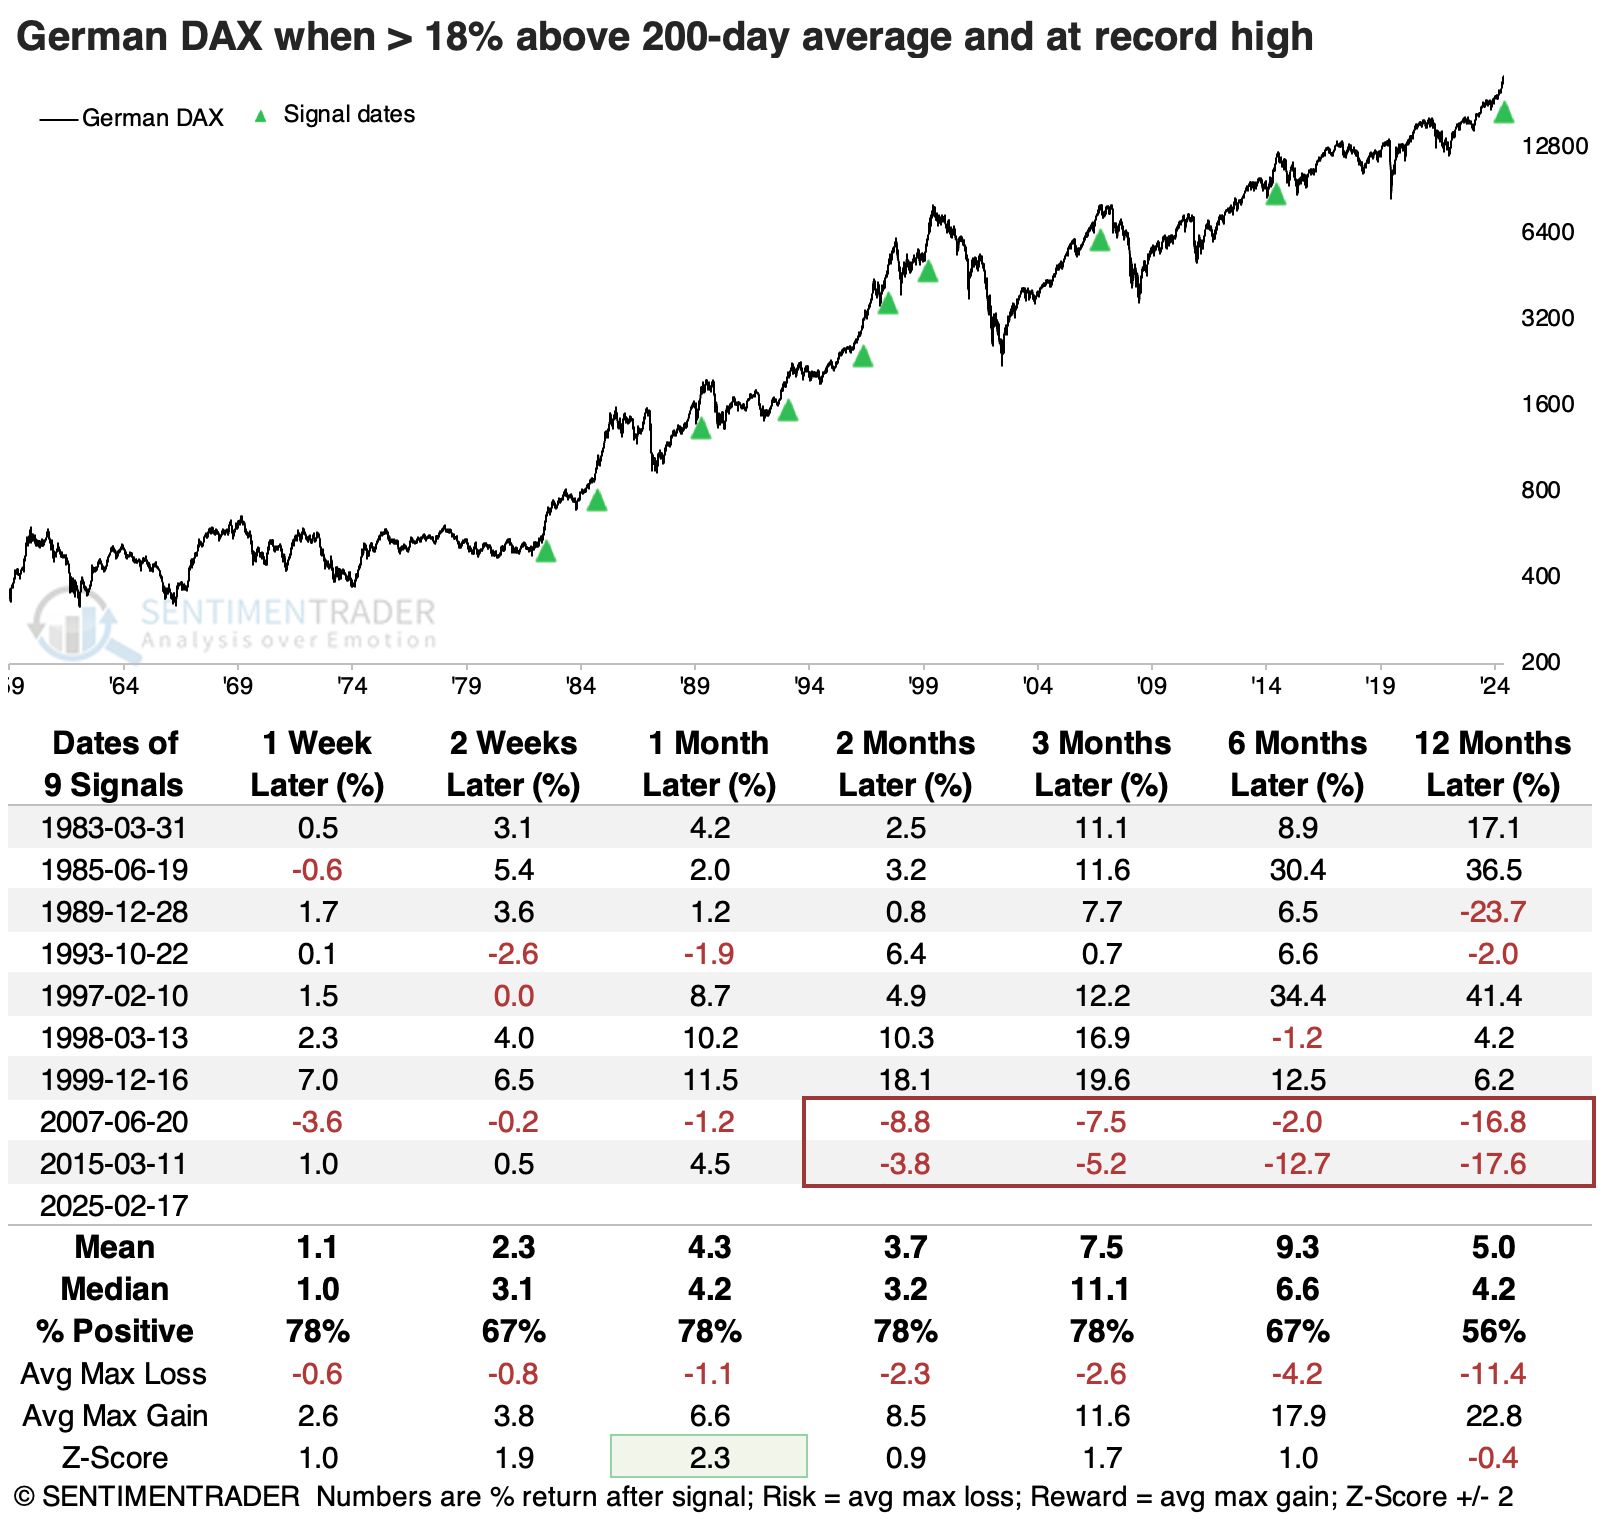
The benchmark DAX index has been nearly unstoppable, rising more than 18% above its long-term 200-day moving average. The only other times in the past 20 years it has done this and hit a record high simultaneously were in 2007 and 2015. Not the best times for AEZV (the Google Translate acronym for Angst Etwas Zu Verpassen, or Fear Of Missing Out).
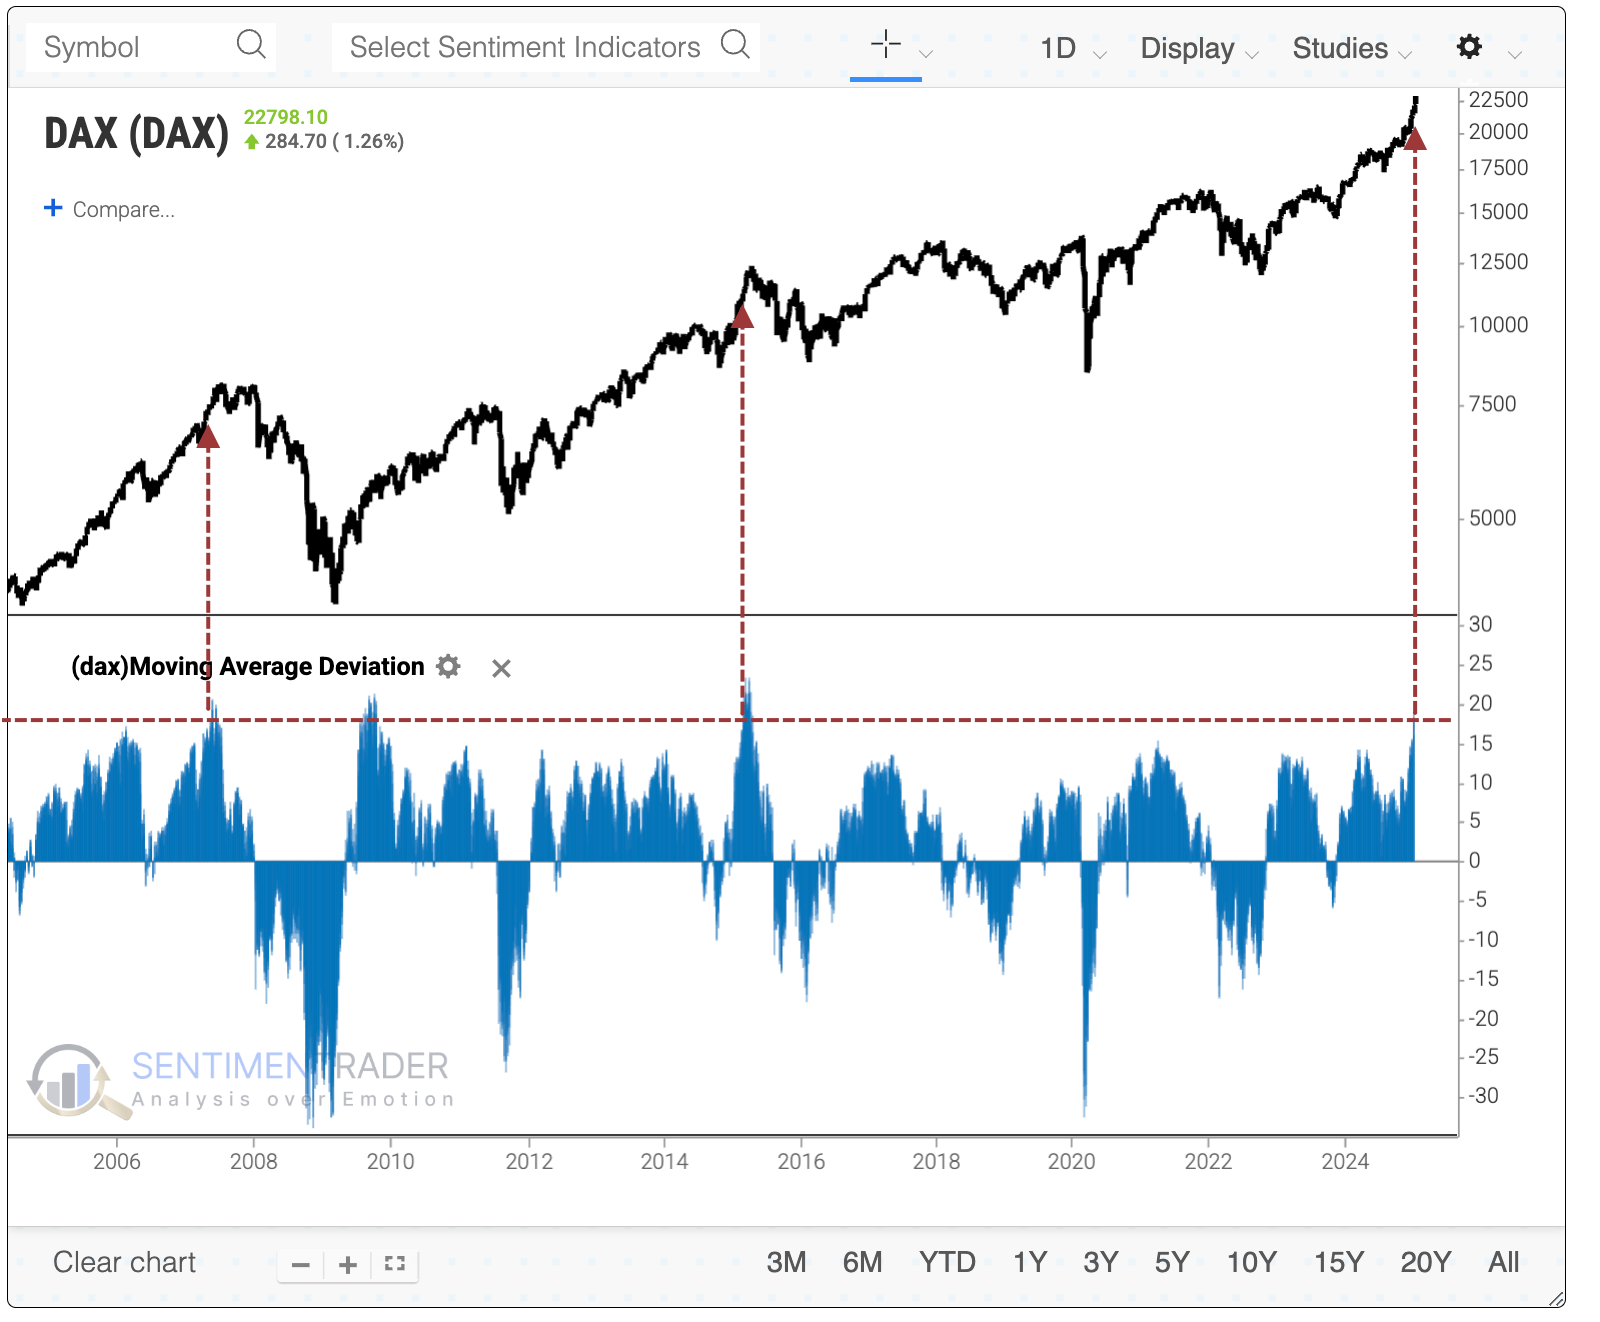
The good news for those optimistic about the DAX's prospects is that the last two instances were among the worst of the bunch. Before those signals, the DAX responded well after being so extended from its long-term trendline. Over the following two to three months, it rallied further every time (again, except for the two most recent occurrences).
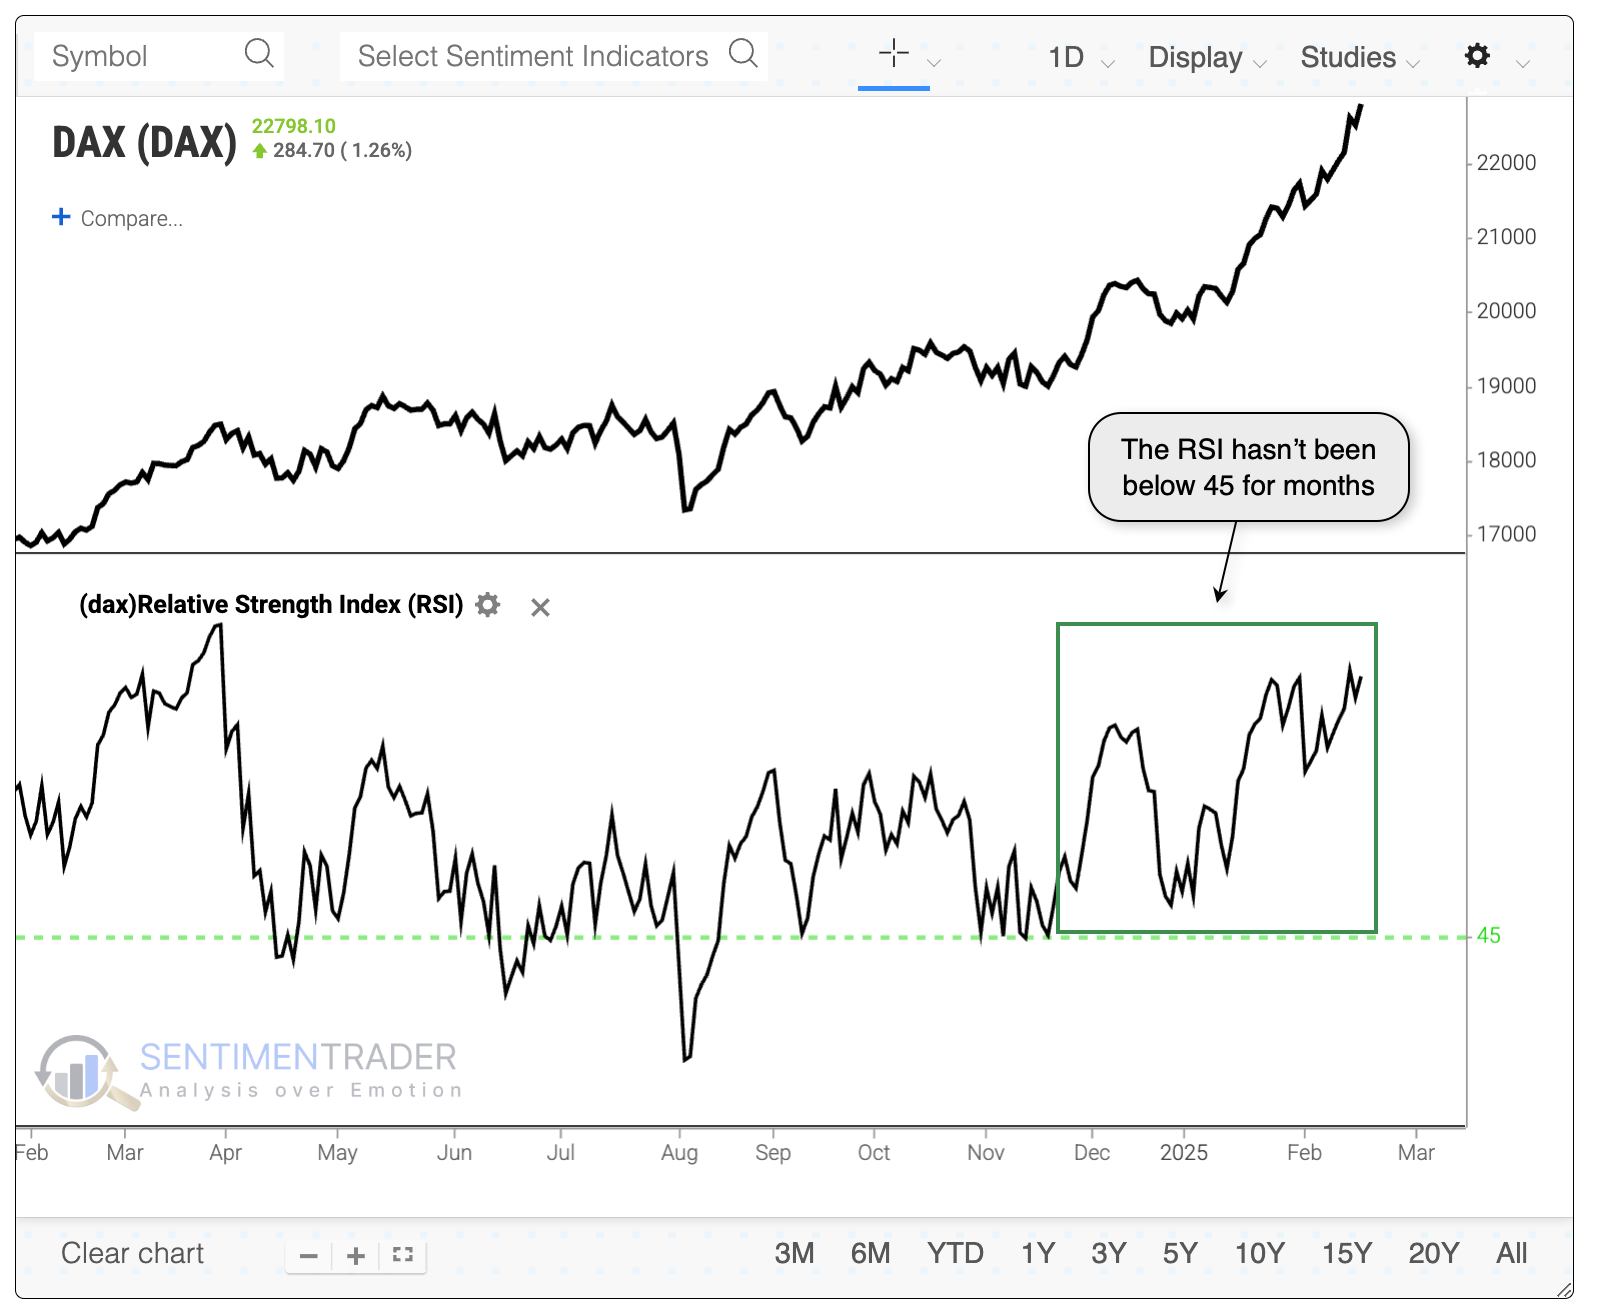
Relative strength shows no weakness
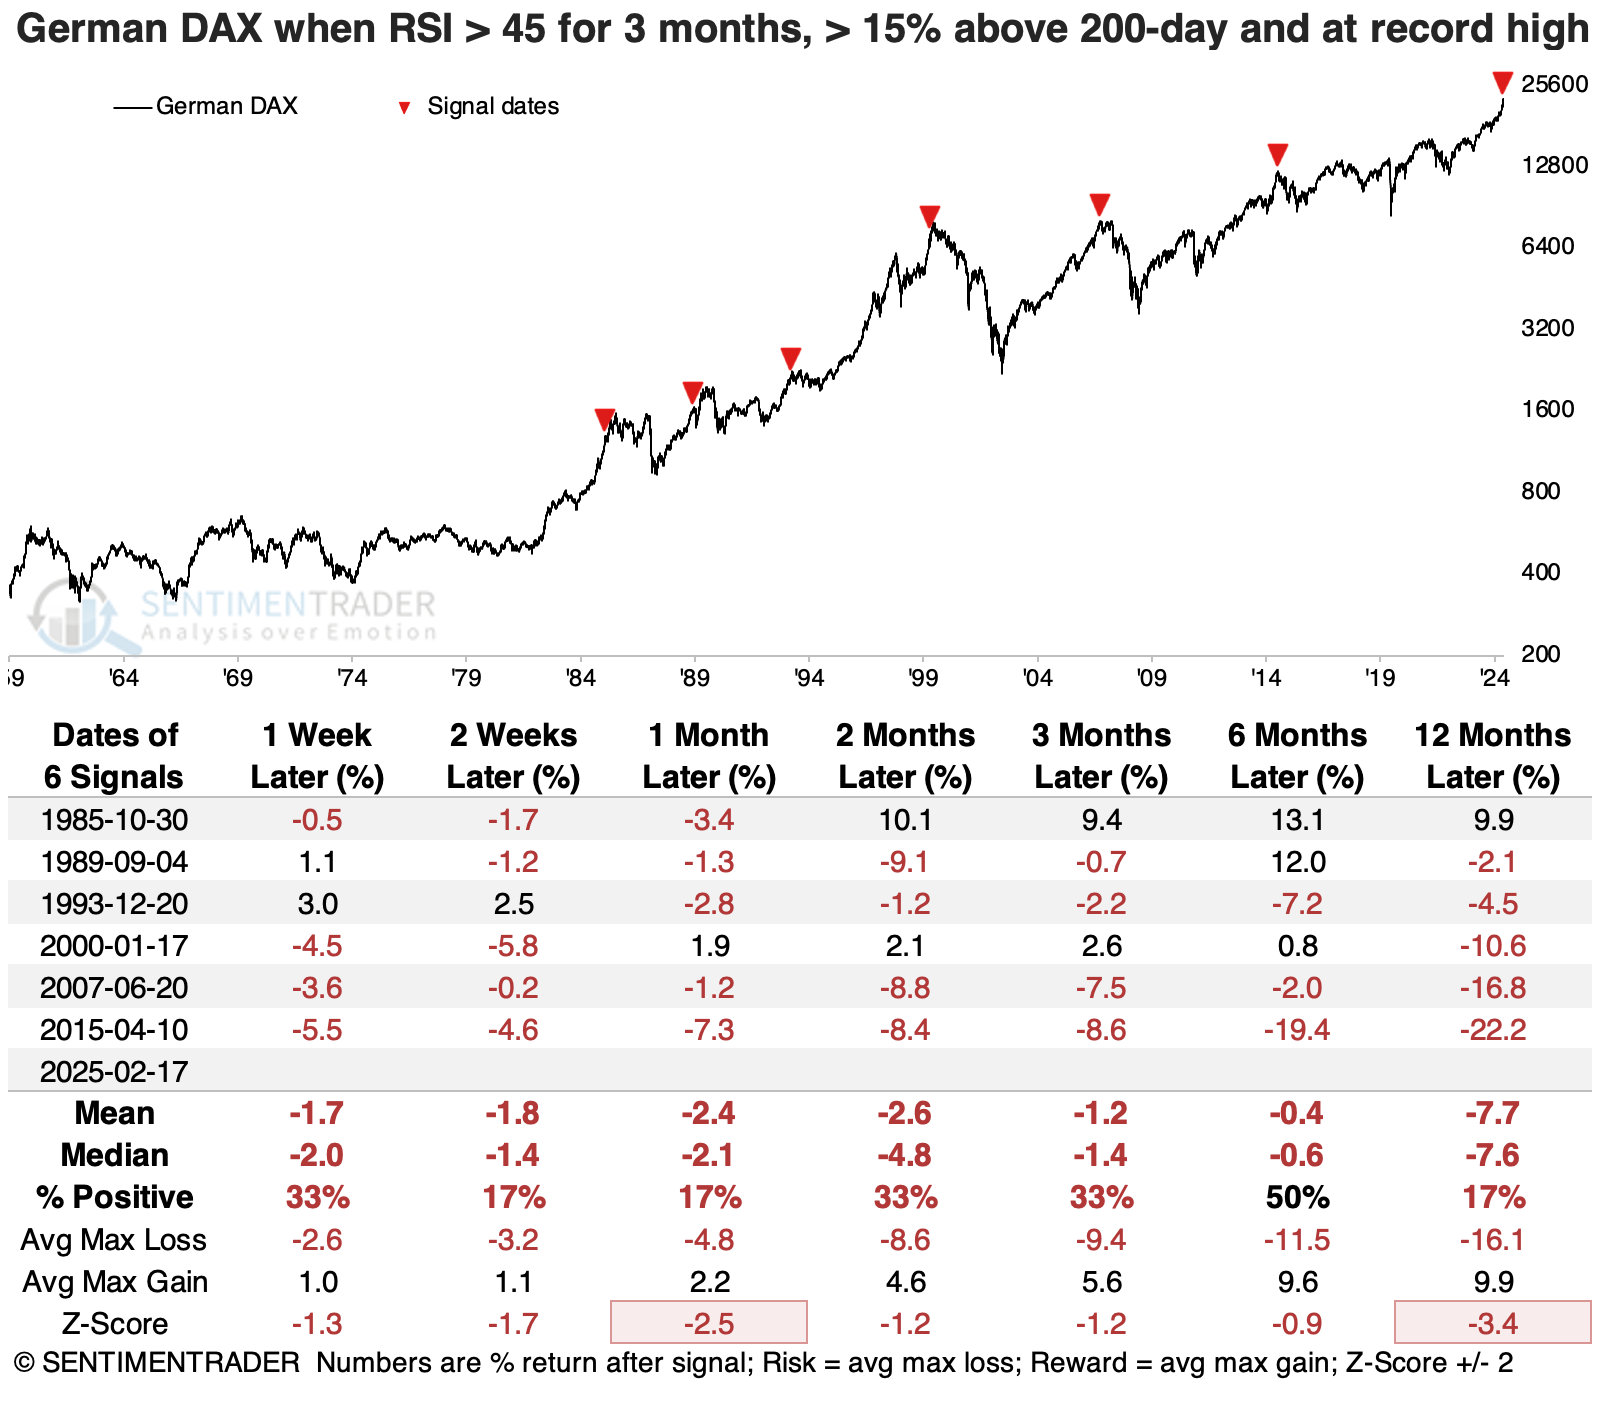
Another sign of momentum many technicians use is the Relative Strength Index (RSI). It can be used as an overbought/oversold oscillator, but it is often interpreted as momentum when pinned above or below a threshold. And that indicator hasn't dipped below 45 for months.
Other times it was pinned above 45 for at least three months, the DAX tended to do quite well...except when it was also at a new high at the time. Instead of indicating returning momentum from oversold conditions, these signals mostly coincided with blow-off peaks, at least over the short- to medium-term.
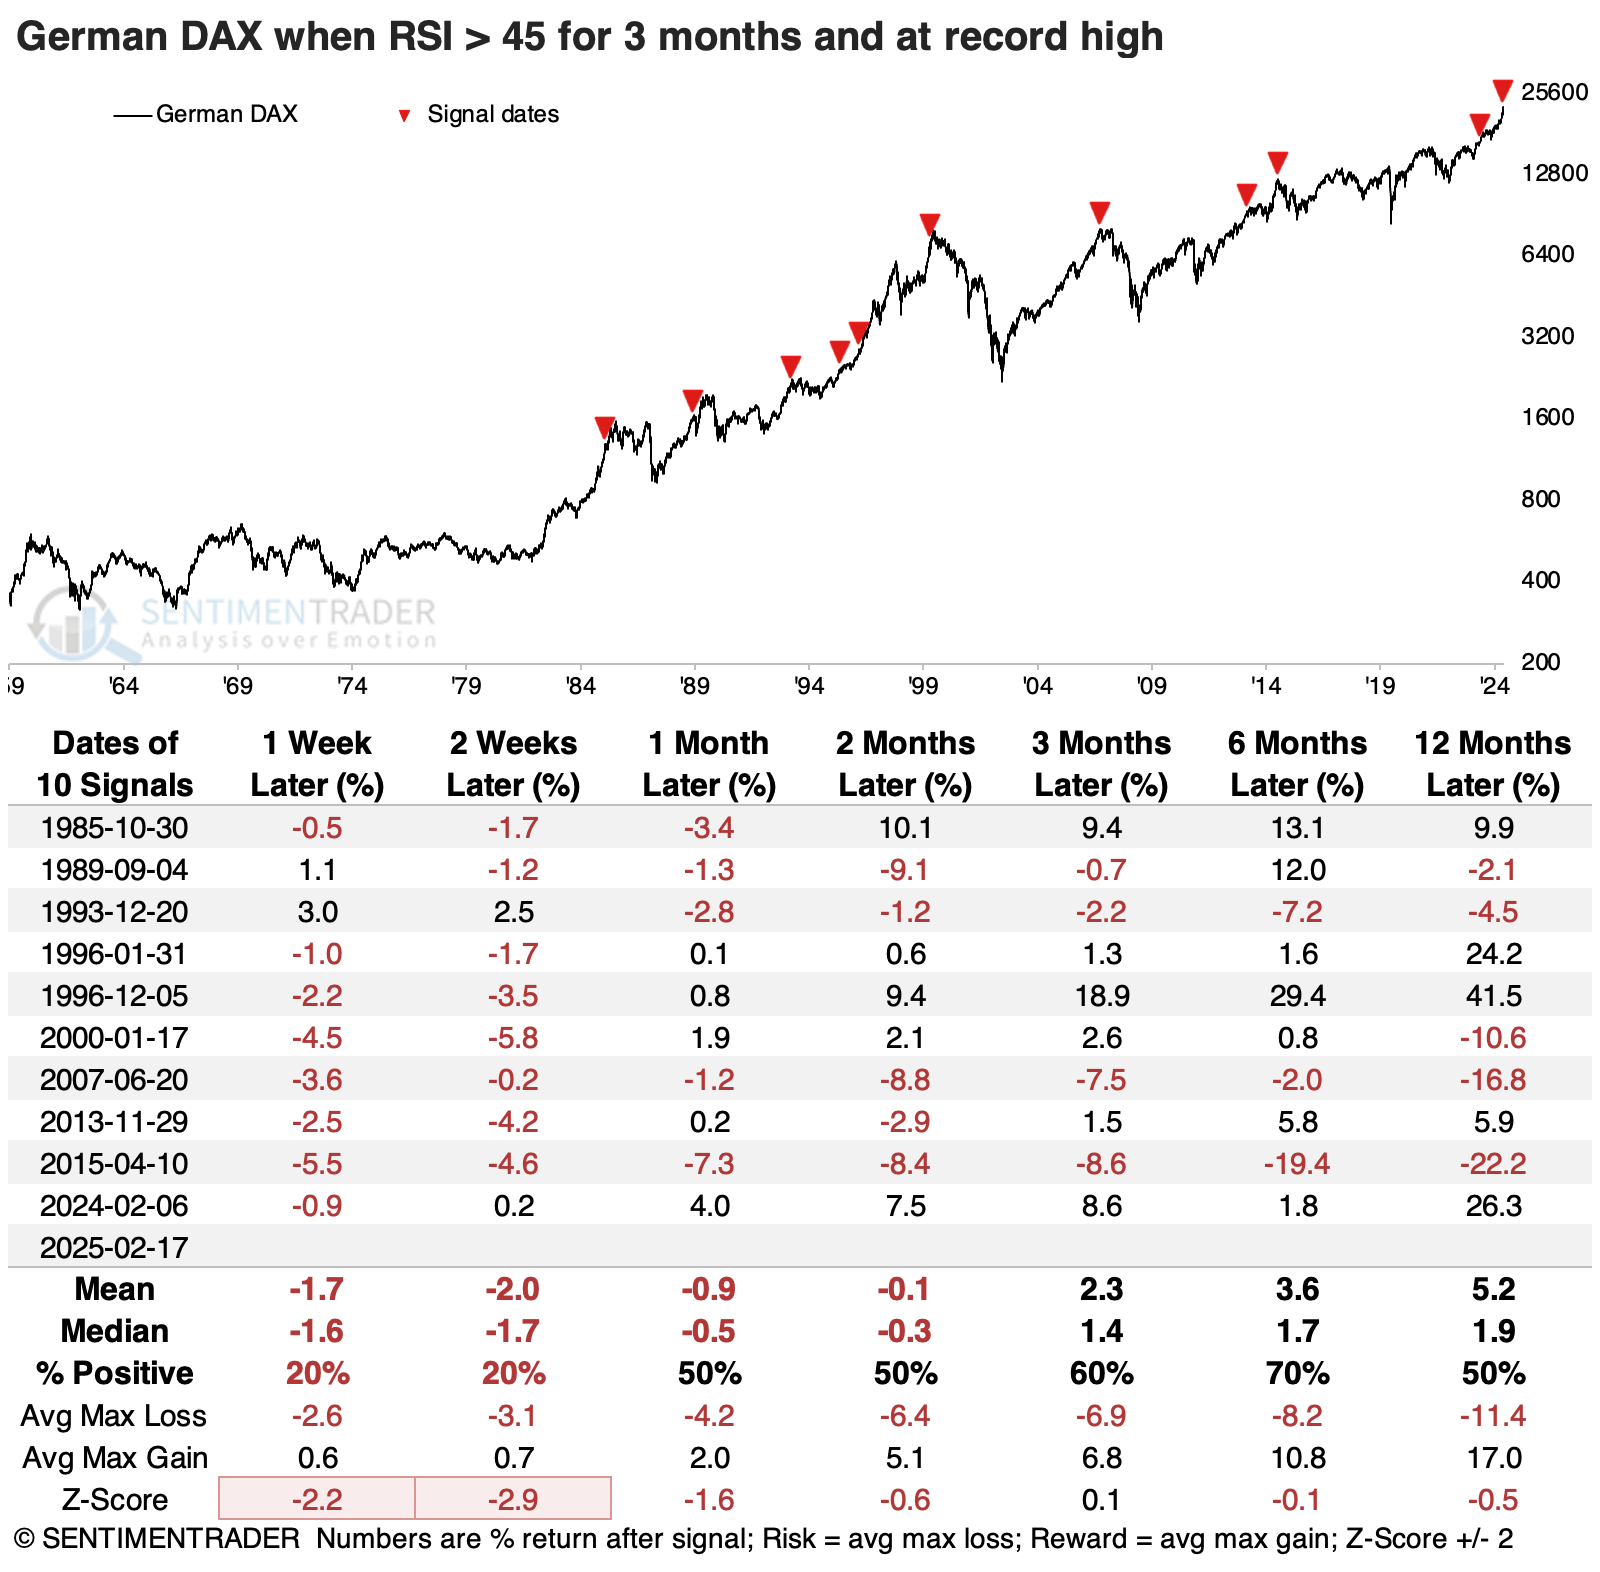
When we combine both studies and look for periods of sustained high RSI readings with the DAX at least 15% above its 200-day average and at a record high, it rarely saw further sustained gains. The last three signals were especially poor for its forward returns.
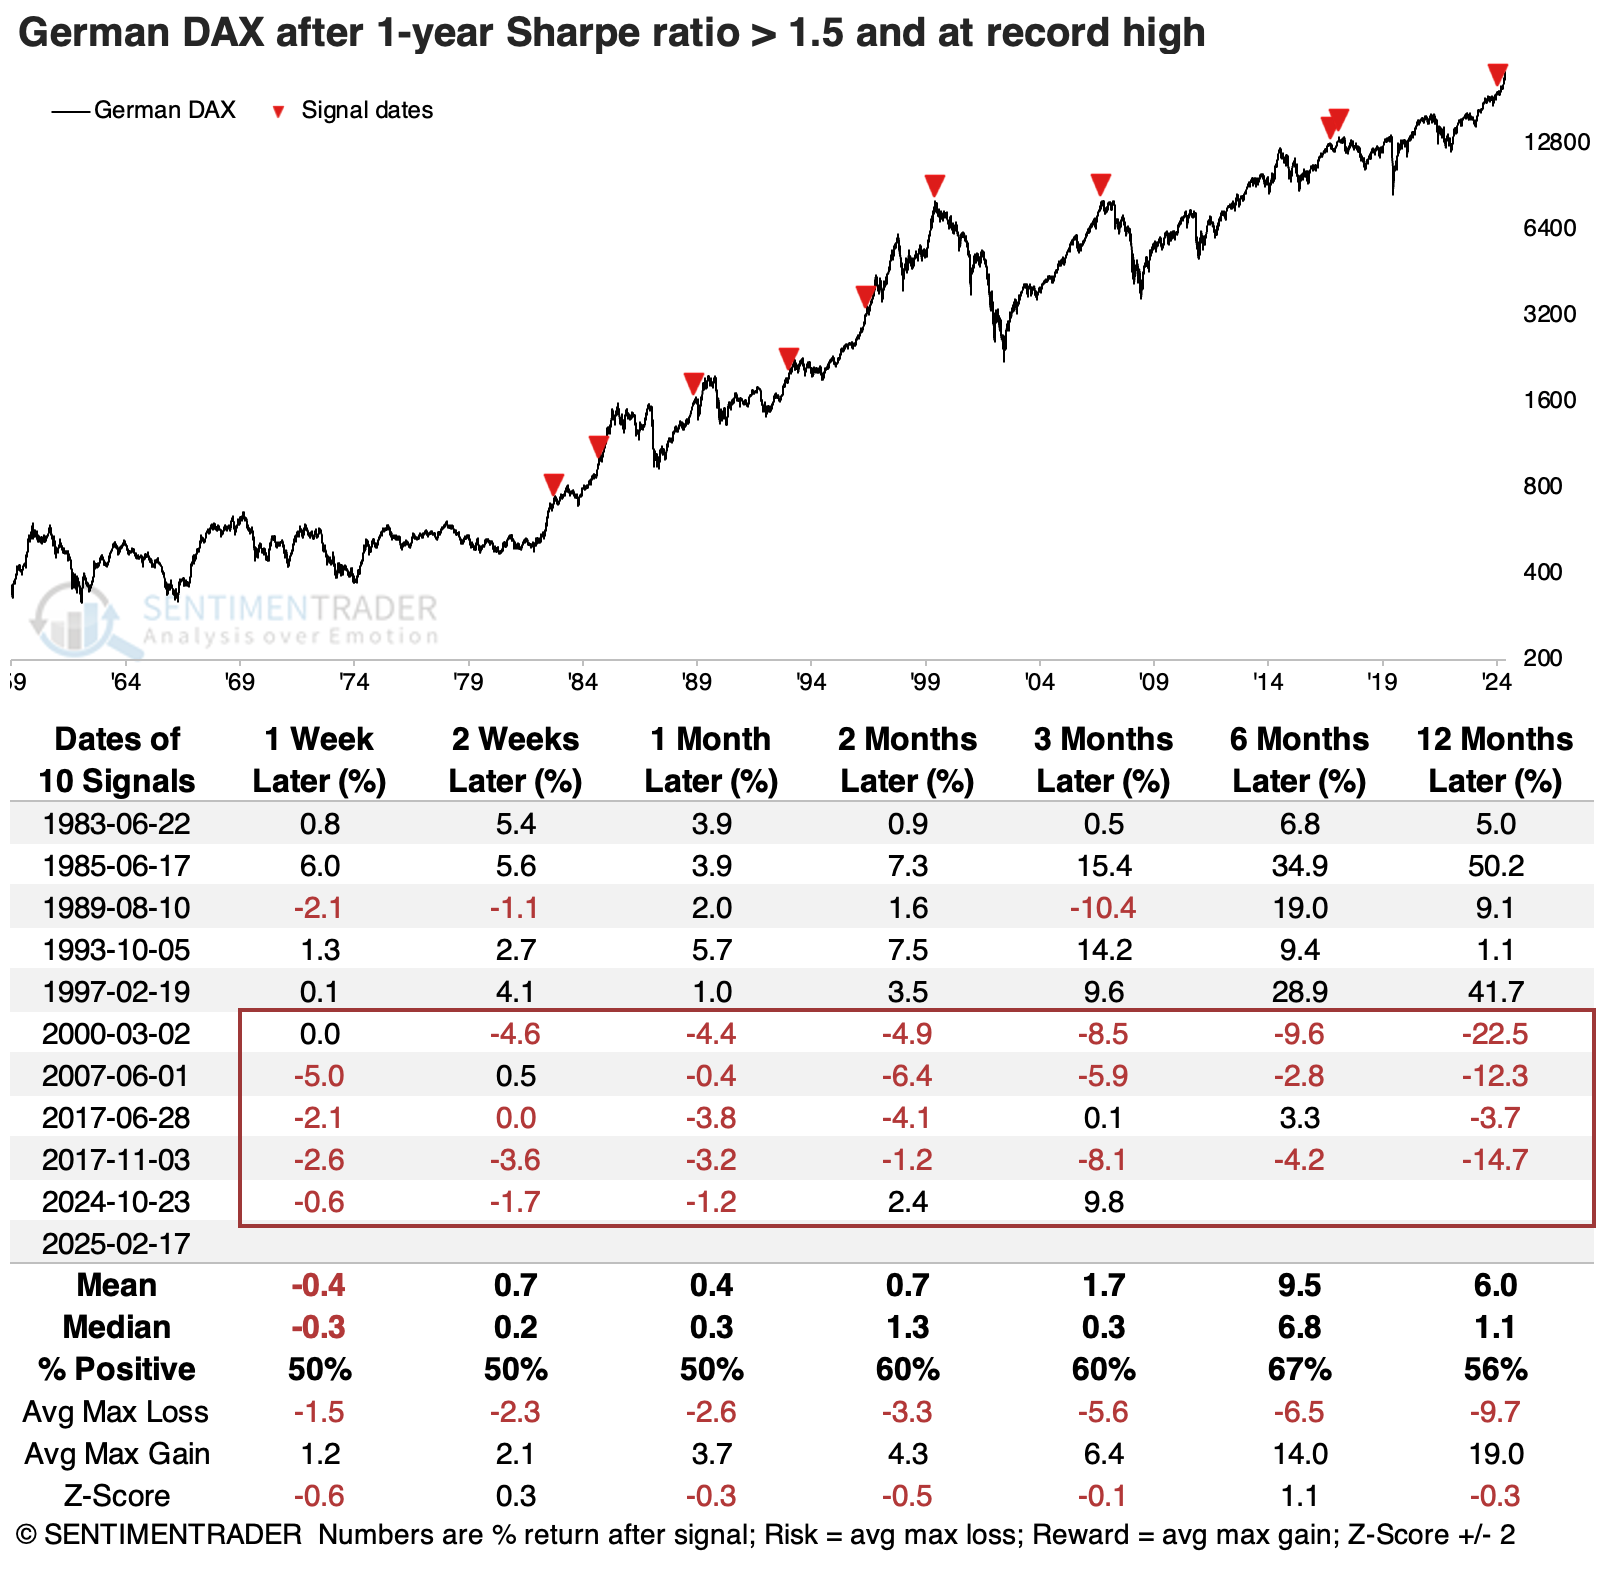
Another Sharpe rally
A couple of weeks ago, we looked at the S&P 500's Sharpe ratio, which showed how "easy" investors have had it over the past year. It's been just as much of a nice ride on the DAX, which is approaching the S&P's level on the Sharpe ratio.
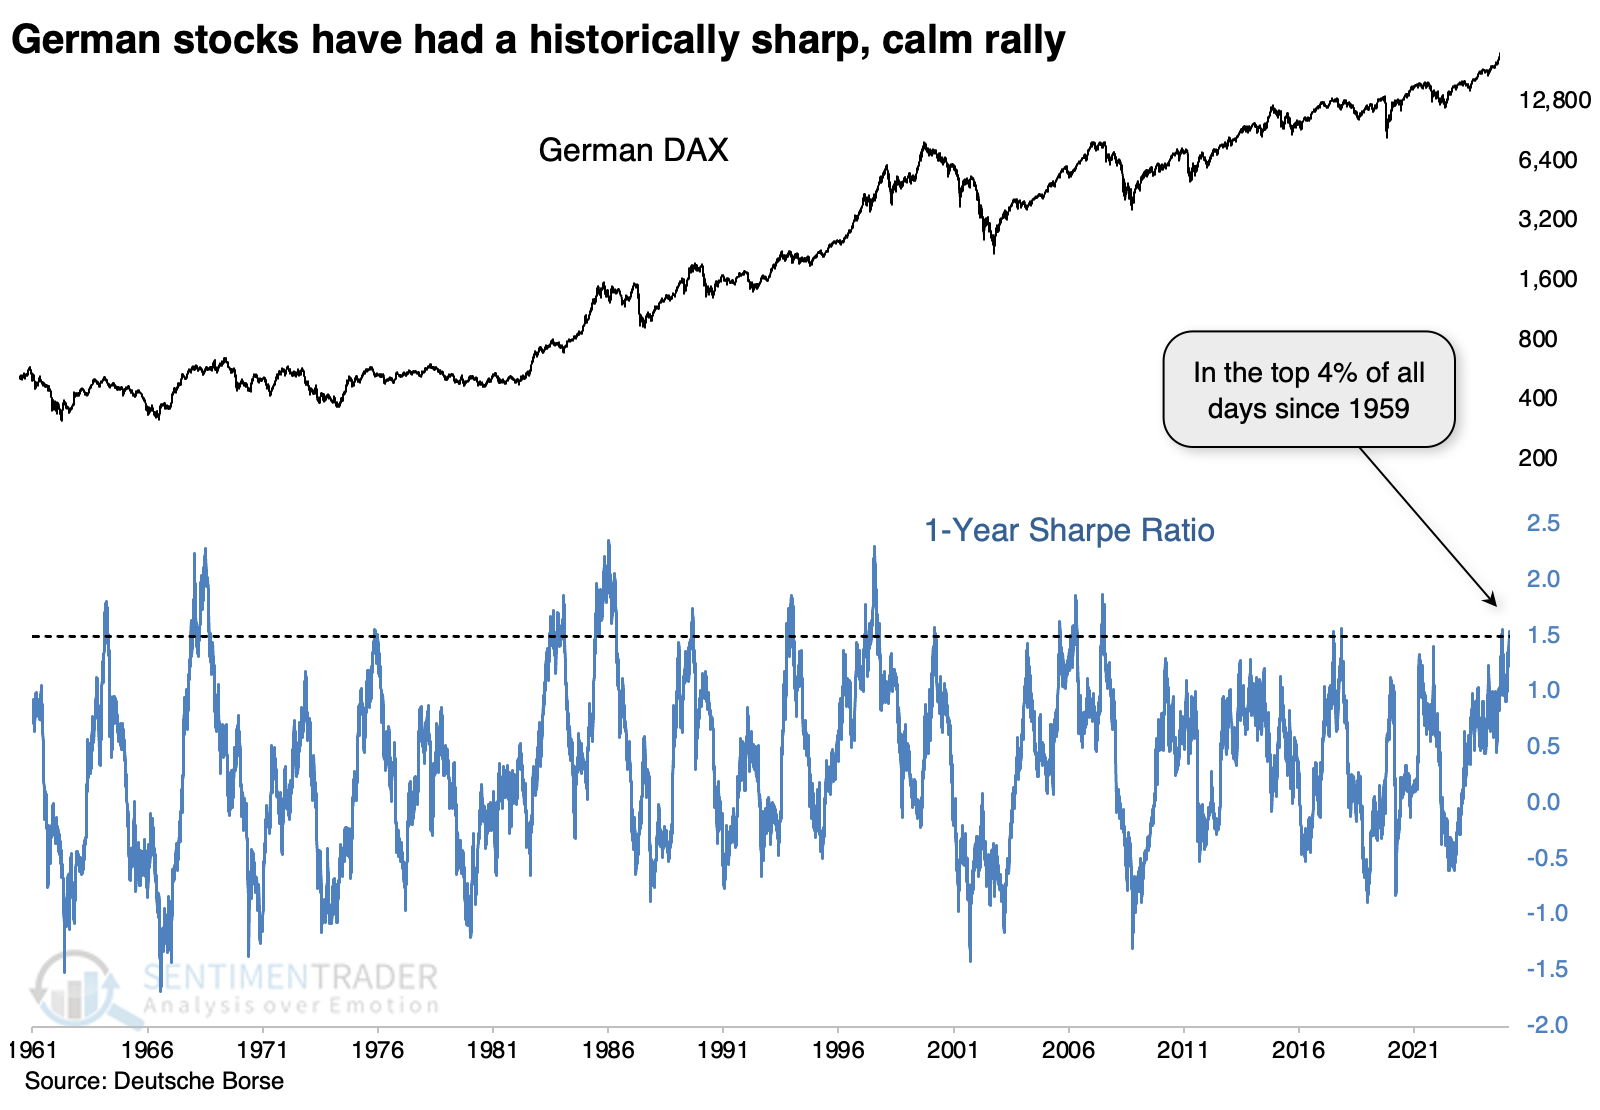
Before the last 25 years or so, this was a great sign for German stocks. Since then, not so much.
After the DAX broke out of a multi-decade malaise in the early 1980s, these signals indicated a rush of buying interest that was not easily quelled. But all the signals since 1999 have been losers over the following month, with most of those lingering for months after.
On divergence watch
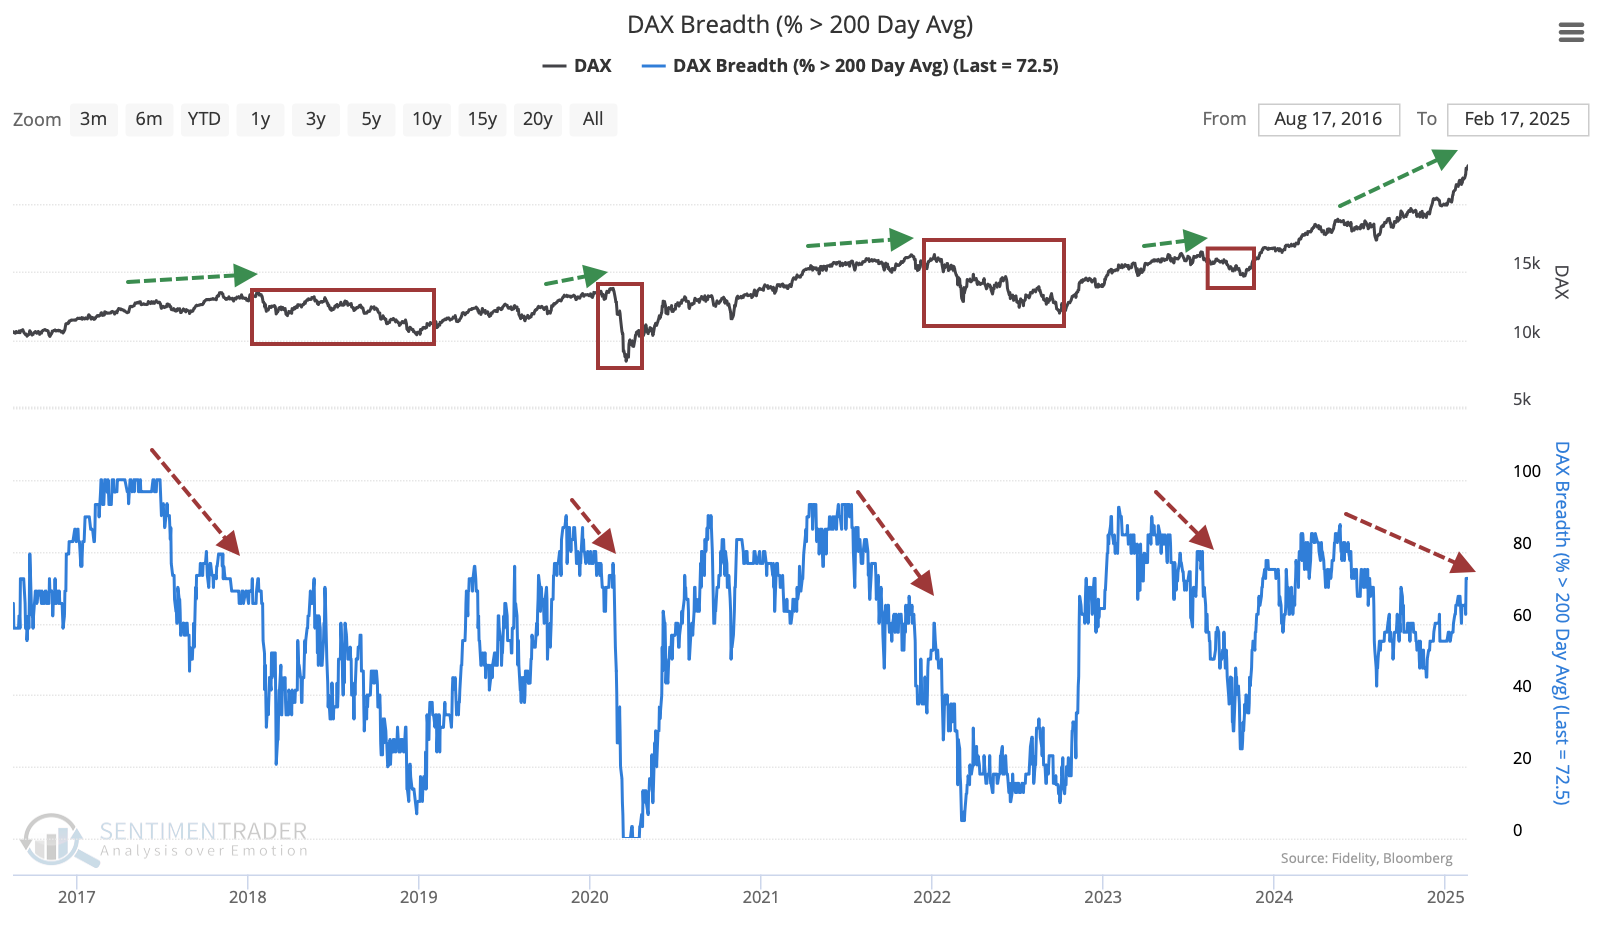
We don't like to make too much out of divergences, because they can be subjective, hard to define in real-time, and too easy to cherry-pick on historical charts. So, this isn't a major warning yet, but it's at least worth noting that internal momentum among stocks in the DAX appears to be waning according to some measures. The McClellan Oscillator has been making lower highs for the past six months as the DAX rises.
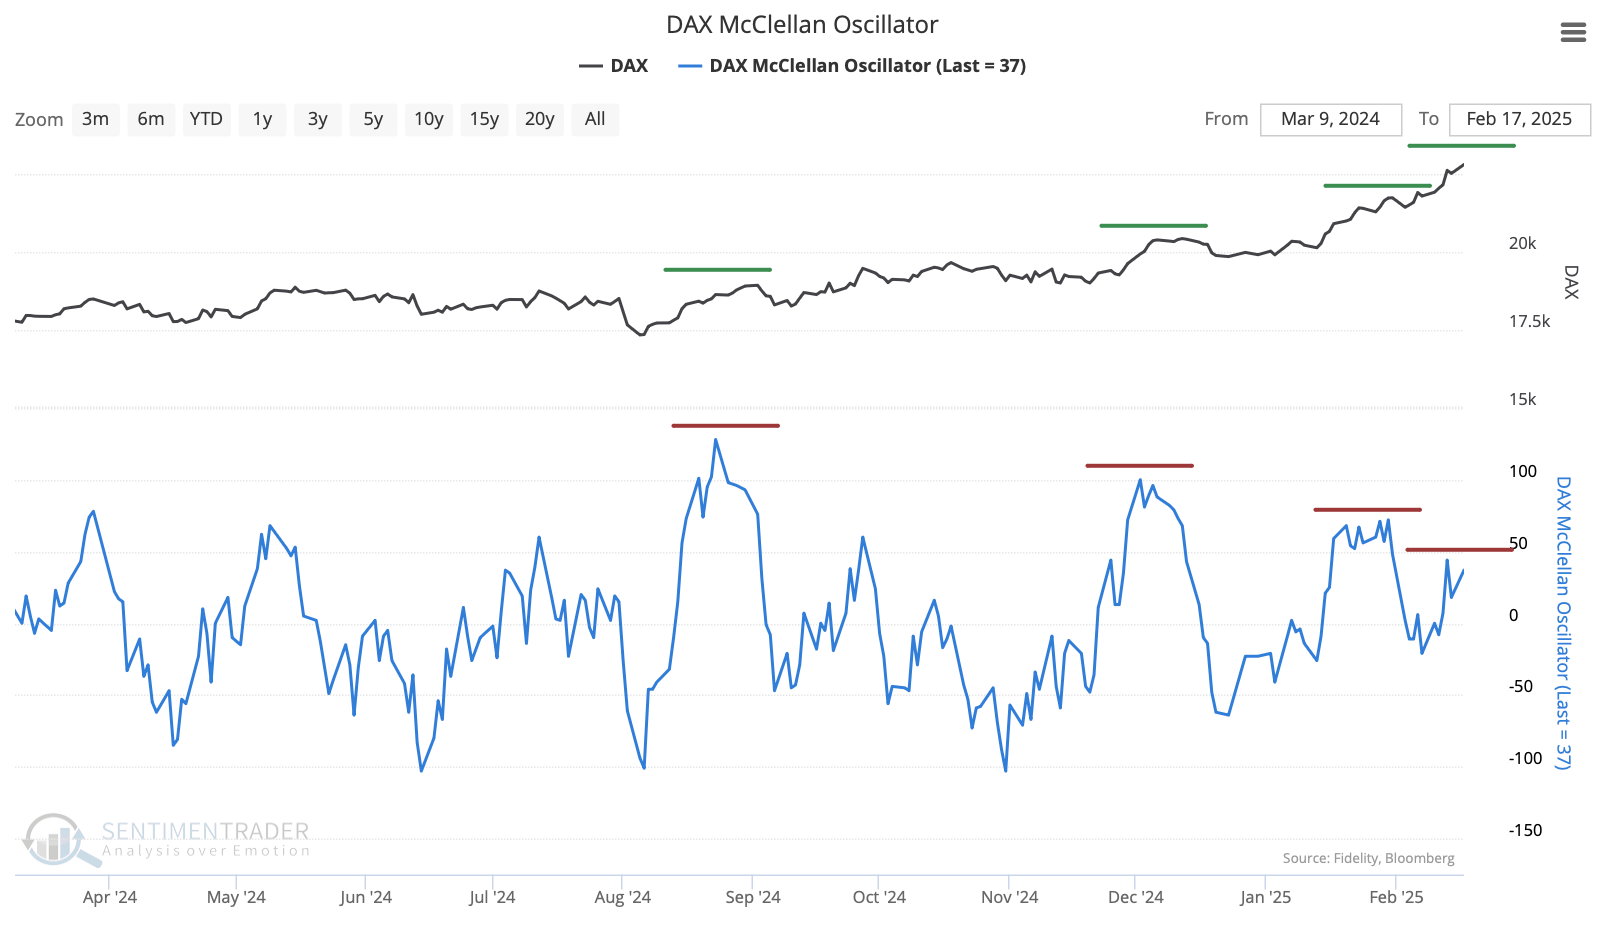
That has translated into fewer and fewer stocks holding above their 200-day moving averages, even as the DAX gets so extended above its own. There is a clear lower-high pattern in this indicator over the past two years.
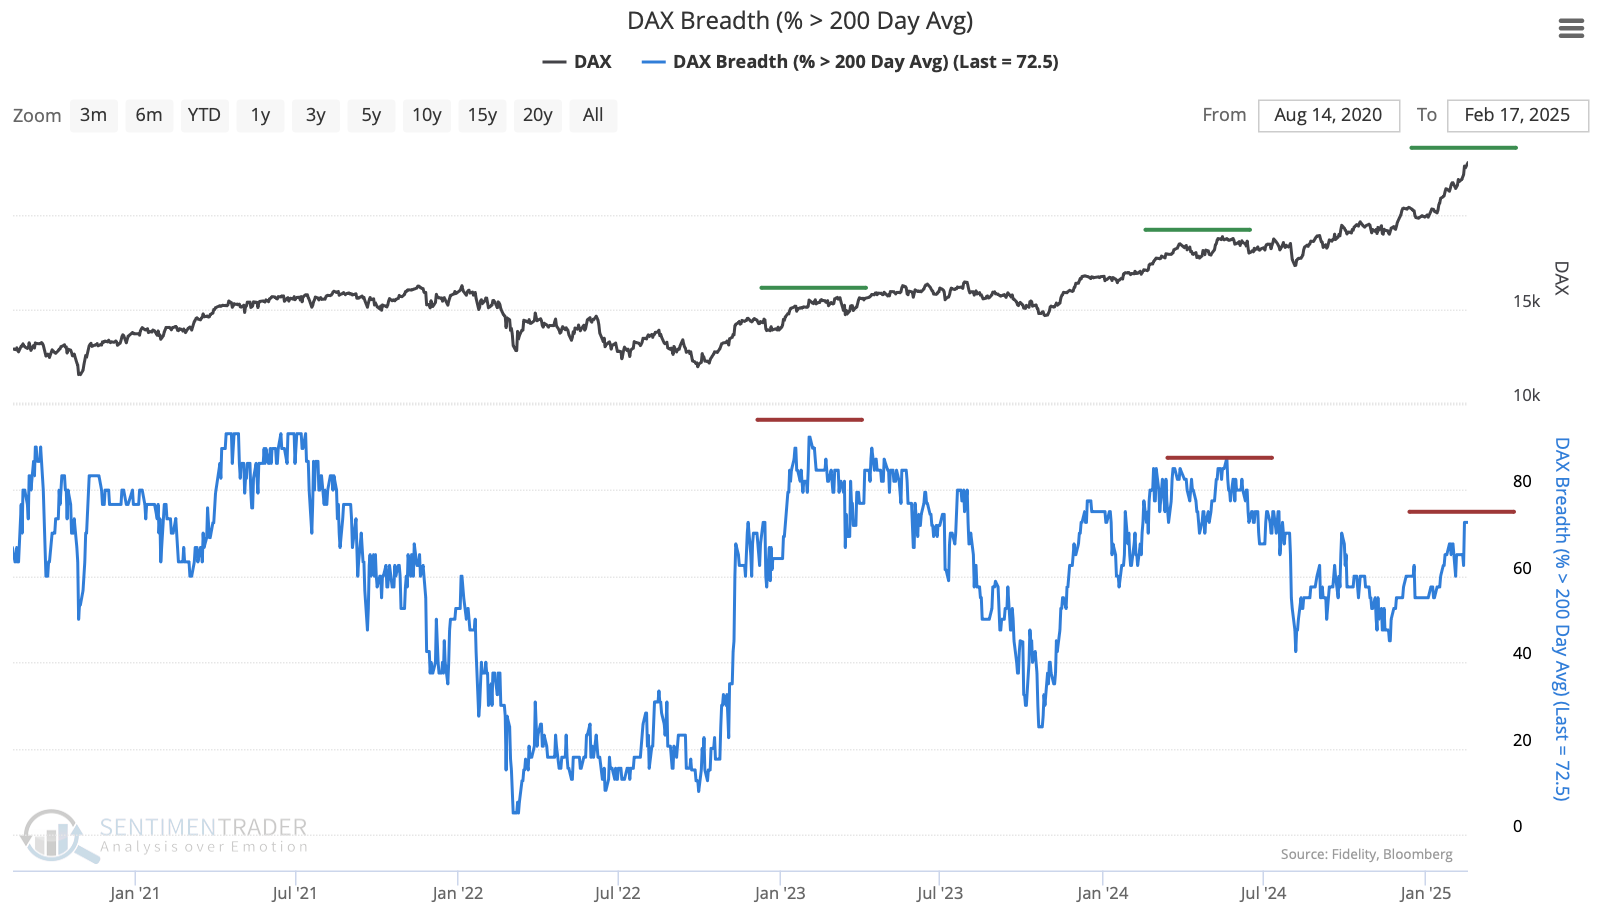
Again, this is relatively subjective, but each time the DAX has powered higher while fewer stocks hold above their 200-day averages, the index has suffered a pullback lasting weeks to months, until it reached an oversold reading with fewer than 25% of stocks maintaining their 200-day average.
What the research tells us...
German stocks have been among the best performers this year, and show little sign of slowing down. During the 1980s and 90s, these bouts of momentum were a welcome sign to buyers, who continued to bid prices higher for months on end.
Over the past 25 years, investors have become much less comfortable riding such impressive momentum. Depending on the metric used, the DAX has seen a historic bout of sustained advances, and recent history has been unkind to late momentum-chasers. The index has shown a consistent tendency to rest after these signals when they trigger at record high prices and several times that rest has turned into a rout.