
The dark cloud shrouding natural gas

Key Points
- Natural gas rallied 30% after making a low in early November
- Several pundits are hailing this as a significant low following a long down-to-sideways period
- However, this highly cyclical market is entering a seasonal period that often witnesses extreme weakness
- Traders might be cautious about playing the long side and look for opportunities to play the short side
A bearish seasonal period is soon upon us
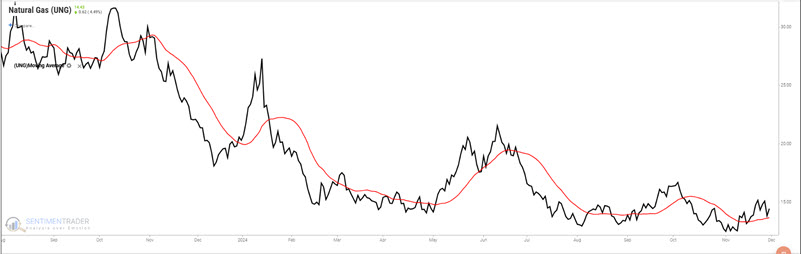
Natural gas gained 30% in just 14 trading days in November. The chart for natural gas futures below shows this strength.
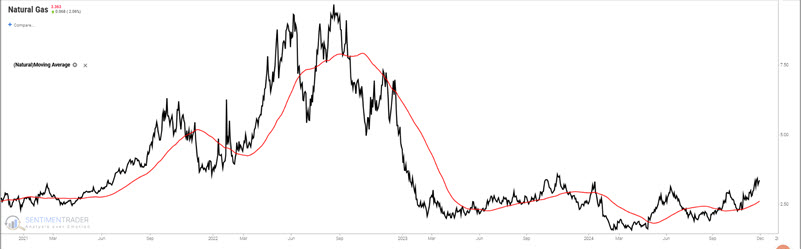
On a technical basis, natty looks like a market trying to forge a meaningful new uptrend-and perhaps it will. However, natural gas is a highly cyclical market, and there is good reason to be cautious.
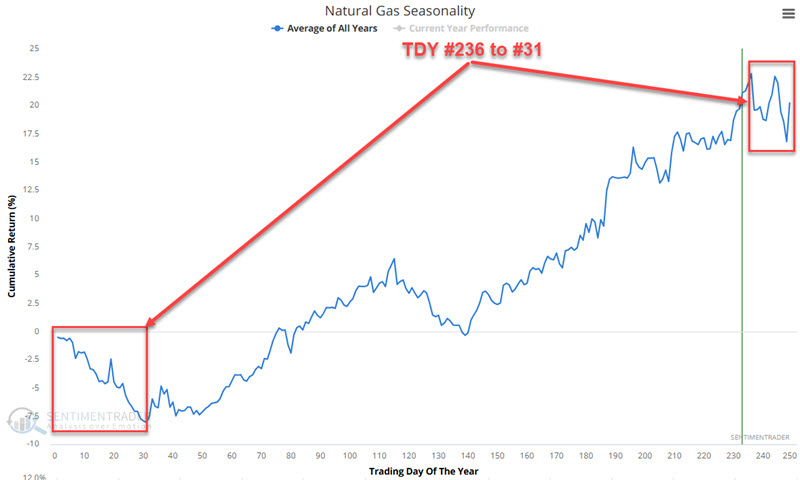
The chart below displays the annual seasonal trend for natural gas futures. This market is entering a seasonally unfavorable period that extends from Trading Day of Year #236 through TDY #31 of the following year. For 2024-25, this period begins at the close on 2024-12-04.
The chart below displays the cumulative $ +(-) for holding a long position in natural gas futures only from TDY #236 through TDY #31 the following year since natural gas started trading in 1990. Notice anything?
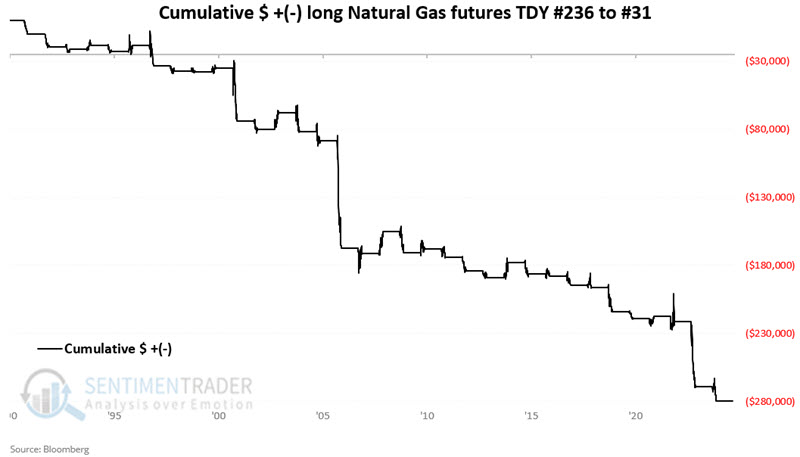
The chart above strongly favors a tight trailing stop for anyone holding a long position in natural gas. It also suggests looking for an opportunity to play the short side if price action begins to show any sign of weakness. On the flip side, it does not guarantee that natural gas is automatically doomed to decline in price in the months ahead. During this purportedly unfavorable period, 2007-2008, 2002-2003, and 2013-2014 saw natural gas futures gain +16K, +12K, and +11K in contract value. So again, there are no guarantees.
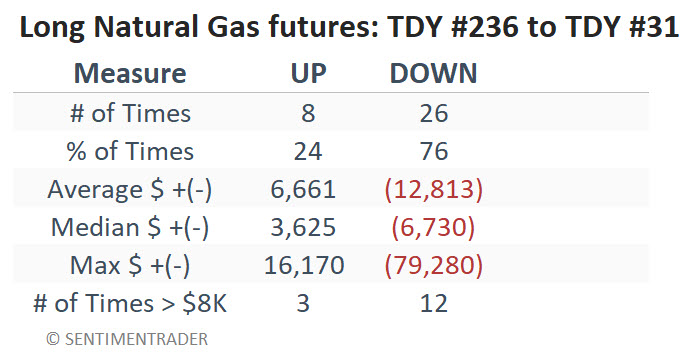
That said, natural gas declined for 26 out of 34 years during this seasonal window. Likewise, significant $5,000 or more moves have skewed to the negative side 18 times to only three times to the positive side. Moves of $8K or more have skewed negative 12-to-3.
Considering ETFs instead of futures contracts
Natural gas futures trading is only for very well-capitalized traders. On the other hand, ETFs can allow anyone to access the market. The United States Natural Gas Fund (UNG) is designed to track the price of natural gas futures. Even more so than many other commodity-related ETFs, UNG has a nasty long-term downward bias due to persistent contango in the futures market. The chart below displays the price history for ticker UNG.
The chart below displays a logarithmic chart of the hypothetical growth of $1 held long in ticker UNG only from TDY #236 through TDY #31 the following year for natural gas futures since trading inception in 2007. The cumulative loss is a fairly stunning -95.8%. The bottom line: You'd better have an excellent reason to consider holding a long position in UNG in the months ahead.
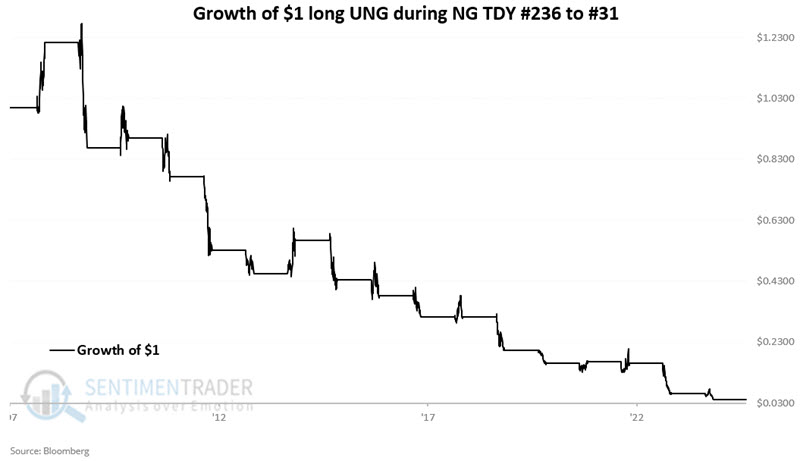
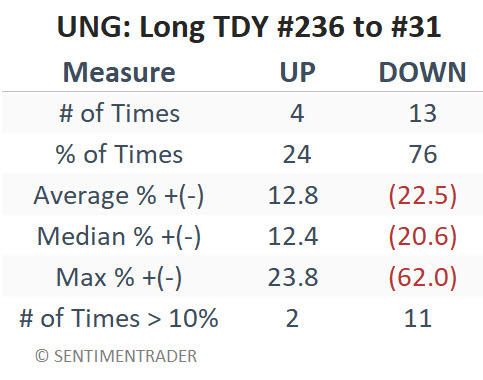
In its 17-year history, UNG has suffered a loss during these seasonal windows 13 times, with eleven losses of -10 % or more. That said, UNG did gain 23.8% in 2013-2014 and +21.4% in 2007-2008. So, selling short UNG shares and "forgetting about it" is not a wise strategy.
Traders looking for limited risk might consider using options on UNG to trade bear call or bear put spreads. Overall, the options have decent volume, but attention must be paid to bid/ask spreads on specific options.
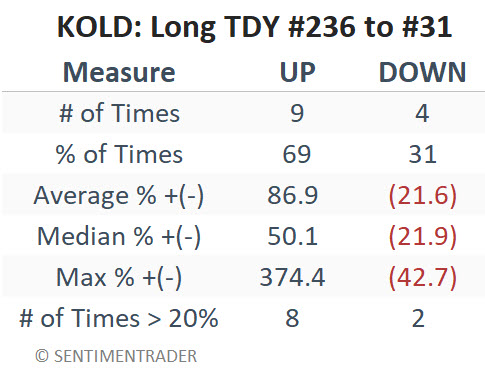
Aggressive traders who want to play the short side and are willing to accept a very high degree of risk and volatility might look at ticker KOLD. The ProShares UltraShort Bloomberg Natural Gas ETF (KOLD) is designed to track two times the inverse daily performance for natural gas futures. But make no mistake about the highly volatile and risky nature of investing in this ETF.
For better or worse, the chart and table below display the results for holding a long position in ticker KOLD only from TDY #236 through TDY #31 the following year since trading inception in 2011. Over eleven years, the cumulative gain is +3,653%; however, several massive drawdowns are interspersed. The returns during this period in the last two years were +374% and +101%. Traders should not expect this to be the norm. 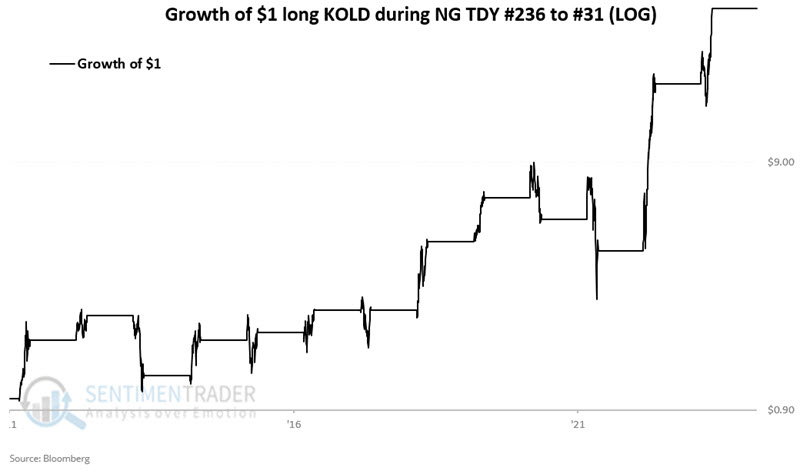
The table below summarizes KOLD's performance during this seasonal window.
The table below displays the year-by-year performance for UNG (long natural gas x 1) and KOLD (short natural gas x 2) from TDY #236 to TDY #31 to fully illustrate the wildly volatile nature of these two ETFs.
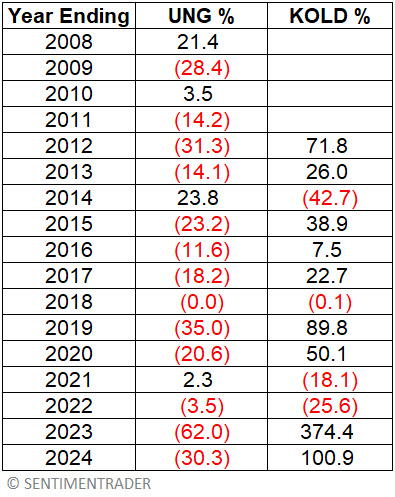
During a roughly two-and-a-half-month window, ticker KOLD has enjoyed gains of +336%, +100%, +89%, +71% and +50%. However, during this same seasonal window, it has also registered losses of -42%, -25%, and -18%. This ETF is clearly not for the faint of heart, the undercapitalized, or those inclined to take overly large positions.
What the research tells us...
One of the keys to succeeding as a trader is focusing on putting the odds on your side to the greatest extent possible with each trade. The caveat is that even if you do this, there will be trades that end up going the wrong way. The seasonal window highlighted above has often - though notably, not always - witnessed surprisingly sharp weakness in natural gas prices. History suggests that traders looking to put the odds in their favor look for opportunities to play the short side of natural gas between now and mid-February 2025.