
The Current State of Treasury Bond Market Indicators

Key points:
- Our experience is that no single indicator should be trusted to be forever 100% correct (even if it has been in the past). Therefore, we prefer a weight-of-evidence approach to analyzing markets
- The treasury bond market has been beaten down for several years, and the price pattern appears to be coiling. This has led to much speculation that the bond market is likely to pop higher
- However, a variety of objective bond market indicators that we follow continue to remain unfavorable for now
The technical state of the bond market
The chart below displays the price action of 30-year Treasury bond futures over the past few years. Following a massive decline from March 2020 to October 2023, long-term treasuries have been trading in a narrowing range without making new lows.
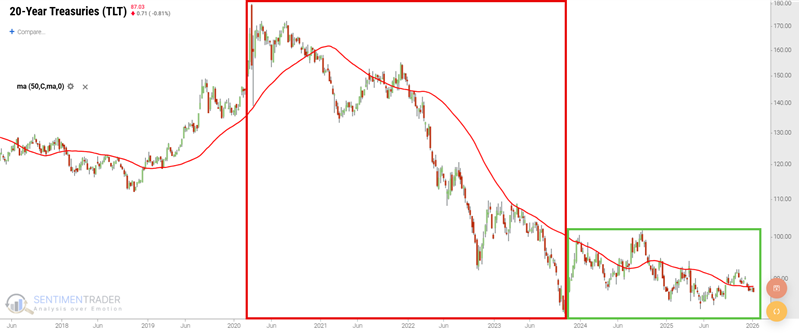
More recently, t-bonds have traded in a narrowing range, with lower highs but also higher lows.
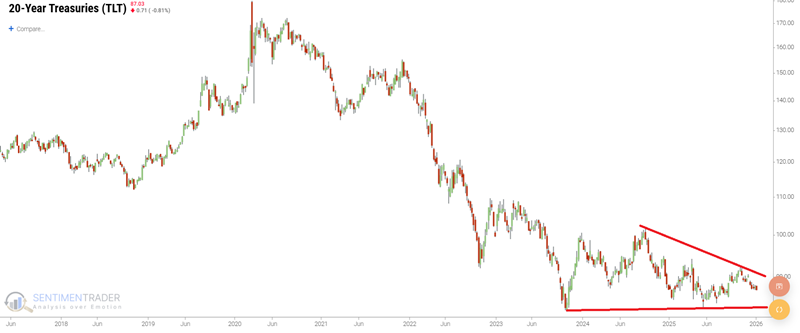
This price pattern, often referred to as "coiling," is typically followed by a decisive breakout. This has led many pundits and speculators to proffer that the bond market will break out decisively to the upside following this long period of decline and consolidation.
And they may be right. However, there are two counterpoints to consider.
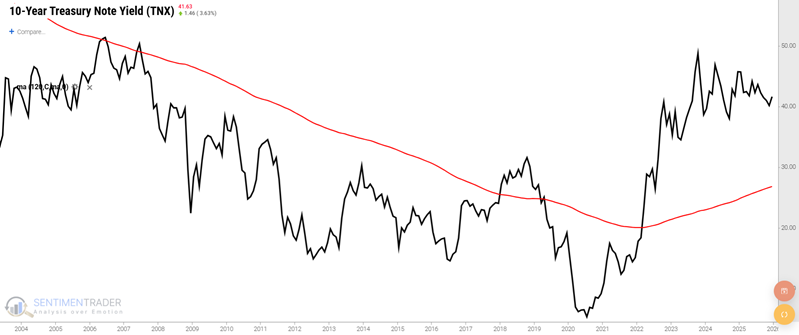
First, treasury bond prices are a function of interest rates. If rates fall, bond prices rise and vice versa. The chart below shows 10-year treasury yields versus a 120-month (i.e., 10-year) exponential moving average. This chart suggests that a paradigm shift has occurred in the trend of interest rates. Only time will tell.
Secondly, a variety of indicators that we follow are currently flashing unfavorable signals for T-bonds. Let's take a closer look.
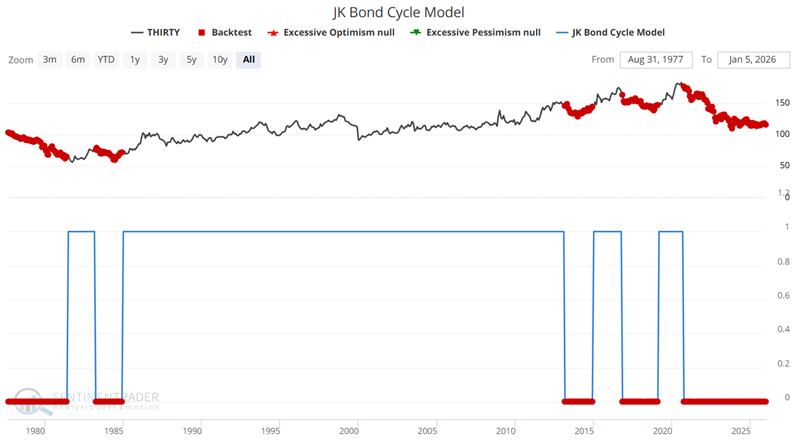
The JK Bond Cycle Model remains locked in Unfavorable Territory
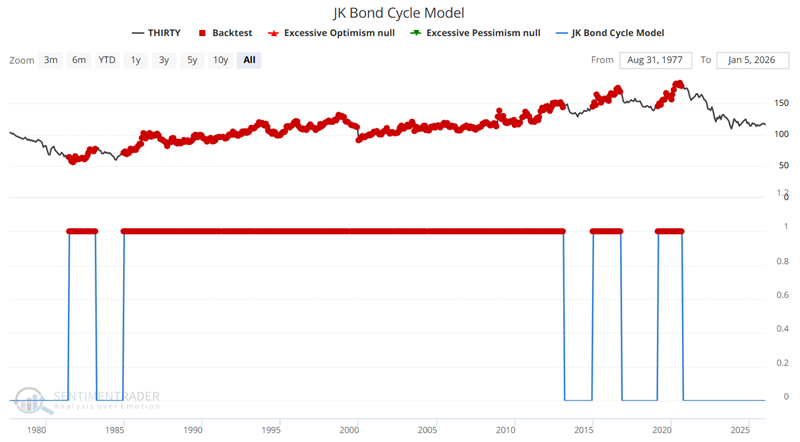
The JK Bond Cycle Model is a responsive indicator that tracks changes in the cyclical trends of the bond market. It is designed to identify significant shThe ifts in market sentiment by comparing the current reading of the JK Bond Cycle Thermometer with the previous one. An increase from lower values to 3 or 4 indicates a transition towards a bullish stance for bonds, while a decrease from higher values to 0 or 1 suggests a shift towards bearish conditions. This model is particularly insightful for investors seeking to align their strategies with the evolving market dynamics.
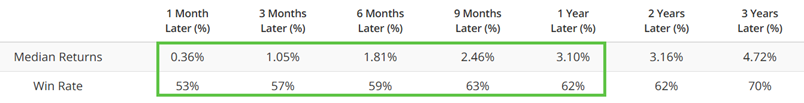
The chart below highlights all dates when the model was at a value of +1.
The table below summarizes the subsequent 30-year Treasury performance. While the raw performance numbers don't necessarily stand out, the key is to compare them to the results shown below when the model was at 0.
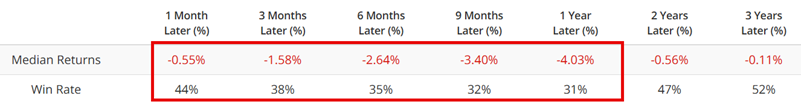
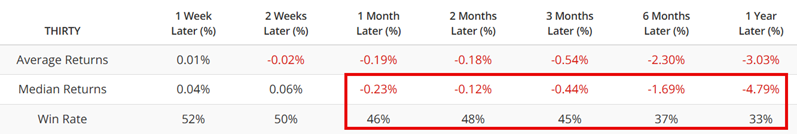
The chart below highlights all dates when the model was at 0.
The table below summarizes the subsequent 30-year treasury performance following the JK Bond Cycle Model readings of 0. Note that win rates are below 50% and median returns are negative across the board through two years.
This model presently shows no prospects of moving from 0 to 1 anytime soon. While this does not guarantee unfavorable results going forward, it definitely stands as negative weight of the evidence for treasury bonds.
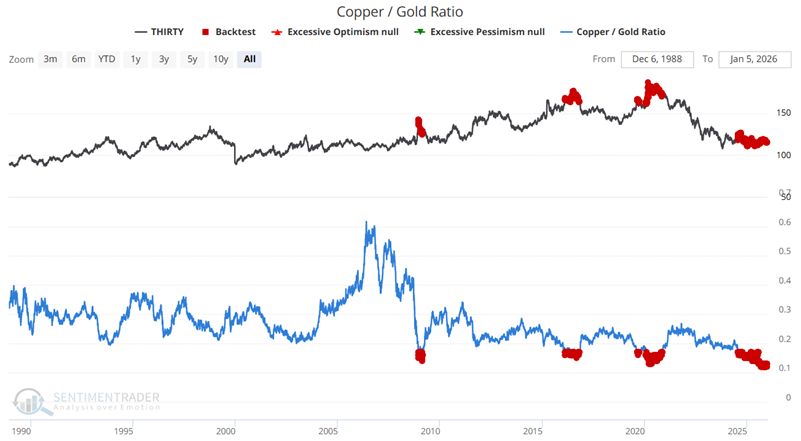
The Copper/Gold Ratio remains at a very low level
The Copper/Gold Ratio, which measures the relative performance of the leading industrial metal versus the leading precious metal, has a surprisingly wide influence across many markets, including bonds.
The chart below highlights all dates when the Copper/Gold Ratio was at 0.17 or lower.
The table below summarizes the subsequent performance of 30-year treasuries.
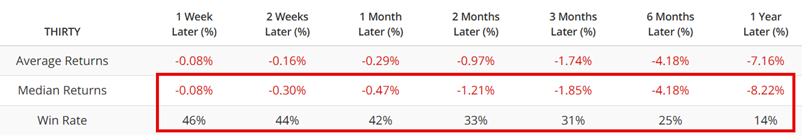
The table below summarizes the performance of the subsequent 30-year Treasury bonds. The historical one-year Win Rate is just a paltry 14%. This bodes ill for t-bonds in the year ahead.
University of Michigan survey has a different impact on bonds than on stocks
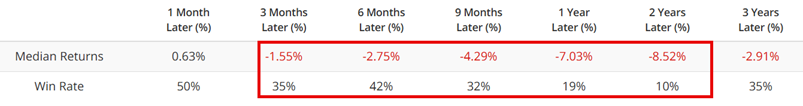
In this piece, I highlighted that low consumer confidence readings have typically had a bullish effect on stock prices. Treasury bond prices, however, have tended to behave differently. The chart below highlights all dates when the U of M Consumer Confidence Index was below 60.
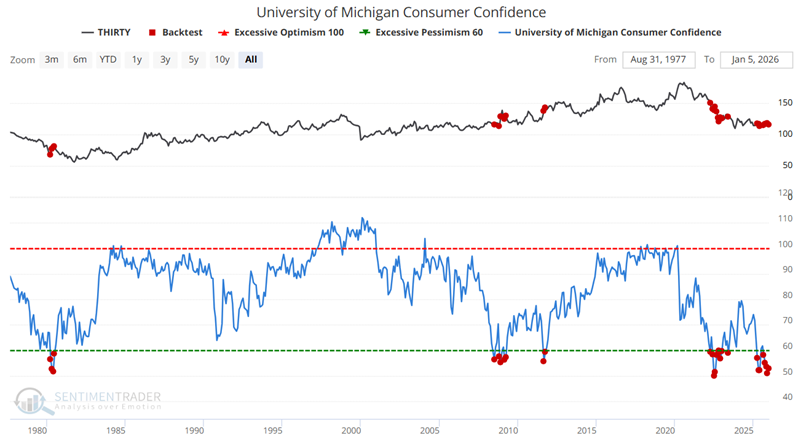
The table below summarizes the performance of the subsequent 30-year Treasury bonds. The historical win rate was just 19% for one year and only 10% for two years.
Treasury bond futures trader sentiment remains stubbornly high
Sentiment among treasury bond futures traders has been relatively bullish of late. This type of action often serves as a contrary indicator. The chart below highlights all weeks when the 10-week moving average of our 30-year Optix indicator was above 80.
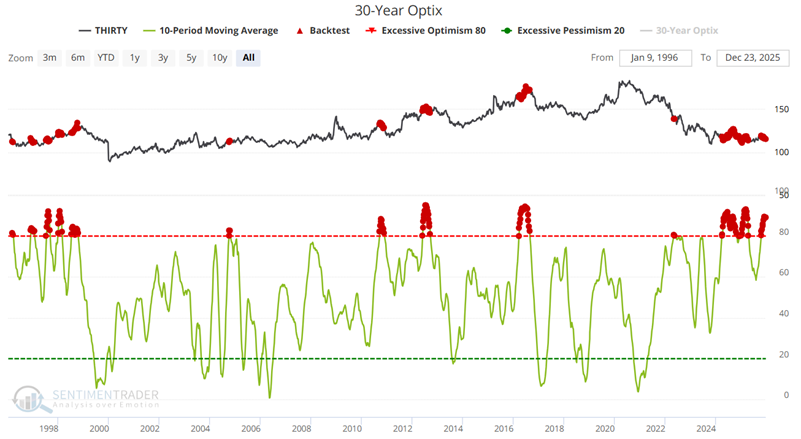
The table below summarizes the subsequent 30-year treasury bond performance following previous signals.
Once again, the results provide no guarantees, but, like the indicators above, fall clearly on the unfavorable side of the ledger.
The JK Seasonal Bond Model is bearish to neutral throughout the first four months of 2026
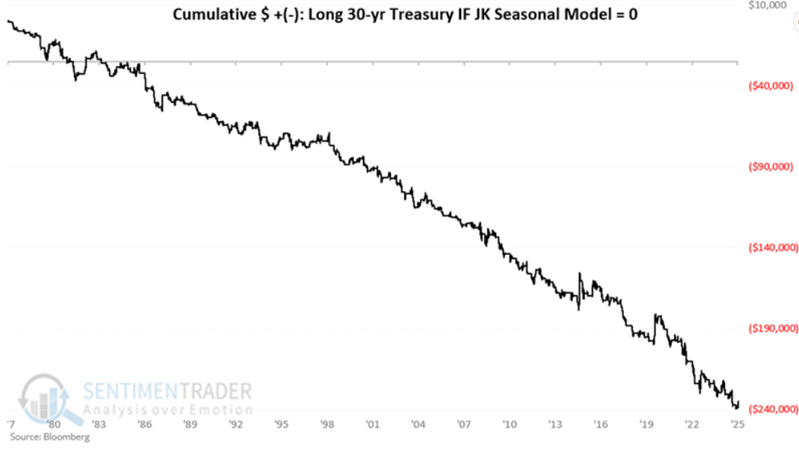
As highlighted in this note, the JK Seasonal Bond Model is neutral to unfavorable throughout the early part of 2026. The chart below displays the hypothetical $+(-) achieved by holding a long position in T-bond futures only when the model was at a reading of 0.
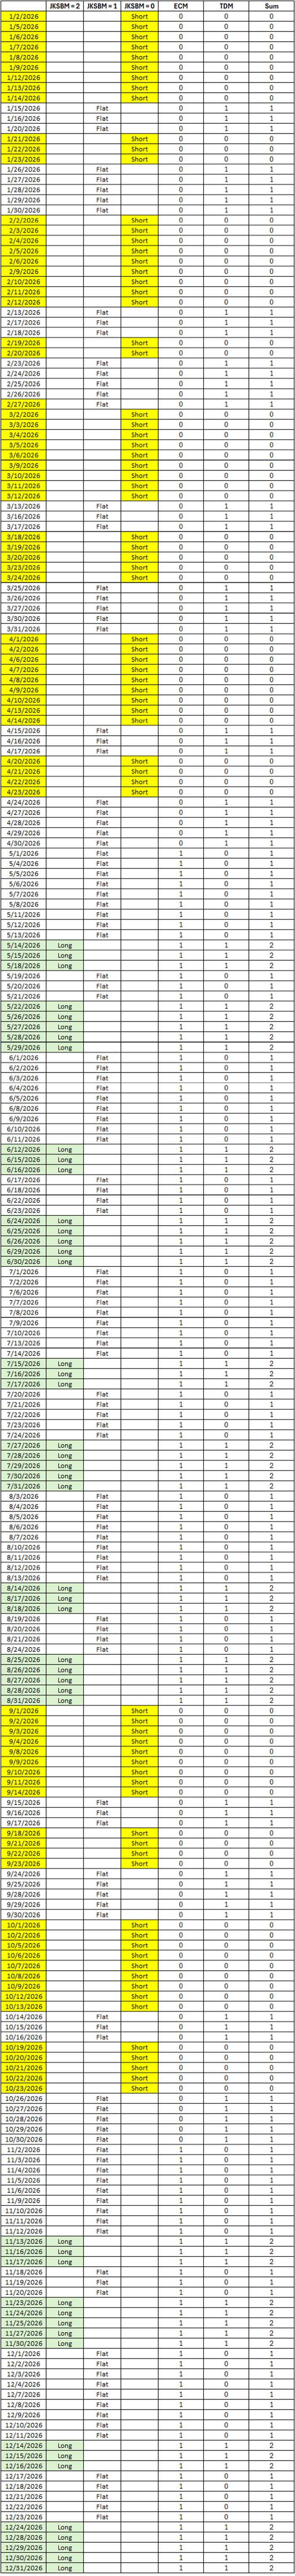
The table below shows the status of the JK Seasonal Bond Model for the year 2026. Note that there are no favorable periods until May.
What the research tells us…
Examining the price chart for Treasury bond futures offers hope of better days ahead for treasuries. If price action breaks out to the upside from its recent consolidation channel, prices can rise further. Still, the point of covering the state of the indicators above is to remind traders to wait for actual price action confirmation before making any sizeable bullish bets on treasury bonds. Unless and until price action actually breaks out to the upside, the weight of the bond market evidence still favors the short side for traders.