
The Current State of Investor Sentiment

Key points
- The seven-month rally has many investors concerned that a drop in stock prices is coming
- Ironically, these widespread concerns could form the "Wall of Worry" that may sustain price action
- Below, we look at the current state of a broad array of sentiment indicators
Overview
Sentiment is the lifeblood of our work. The reason we rely upon and fall back on sentiment analysis systematically is simply because the one thing that never changes is human nature. As a result, fear and greed/complacency have been and (in this analyst's opinion) always will be the primary emotions that drive investors' actions.
When the market starts to perform poorly, investors ultimately gravitate towards fear. The worse things get, the greater the fear. Eventually, the fear reaches a peak, and the stock market starts to look ahead. Then a bull market begins. For a period of time, investors are untrusting of the advance. Eventually, the stock market advances far enough and lasts long enough that investors lose their fear and become complacent and/or outright bullish. Meaningful corrections of 5% to 10% (occasionally more) can happen at any time, regardless of the status of investor sentiment. However, it has invariably been the case that the stock market does not enter a significant bear market until after this has occurred.
In that context, let's review the current "State of Sentiment."
Sentiment Indicator #1: Panic/Euphoria Model
This model is based on the Citi Panic/Euphoria model, which was published in Barron's magazine. It does not reflect the published values; rather, it is our interpretation of the model inputs and construction, and it differs modestly from the published figures. The inputs are the same; however, its performance as a contrary indicator is improved over the published values. It is composed of the following primary inputs: NYSE short interest, margin debt, Nasdaq vs NYSE volume, Investor's Intelligence survey, AAII survey, retail money market funds, put/call ratios, commodities prices, and retail gasoline prices. The higher the model, the more investors are in a euphoric mood, with lower expected stock returns going forward. Low values, particularly below zero, suggest that investors have panicked, and higher forward returns are expected.
The chart below displays the history of our Panic/Euphoria Model.
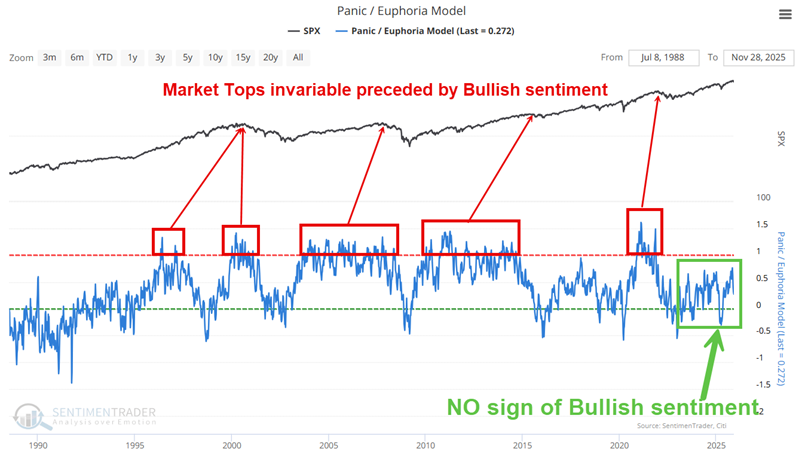
The key things to note are that:
- Market tops have invariably been preceded (occasionally by a year or more) by overly bullish readings (above 1.00) from this model.
- And, importantly, even though the stock market has been in a bull market for over three years, there is absolutely no sign of overly bullish sentiment presently reflected in our Panic/Euphoria Model
Does this preclude the possibility of a severe correction or even an unexpected market top? Of course not. However, it is an important clue, suggesting that we should give the bullish case the benefit of the doubt for now.
Sentiment Indicator #2: Sentiment Cycle Composite
The Sentiment Cycle Composite combines four key phases of the sentiment cycle-Enthusiasm, Panic, Discouragement, and Returning Confidence-into a single measure, offering a concise view of market behavior at any given time.
The Sentiment Cycle Composite aggregates these phases, making it easier for investors to spot shifts in market dynamics and assess potential opportunities or risks. It is important to note that this indicator is different than many other sentiment indicators. It turns sentiment into a trend-following indicator.
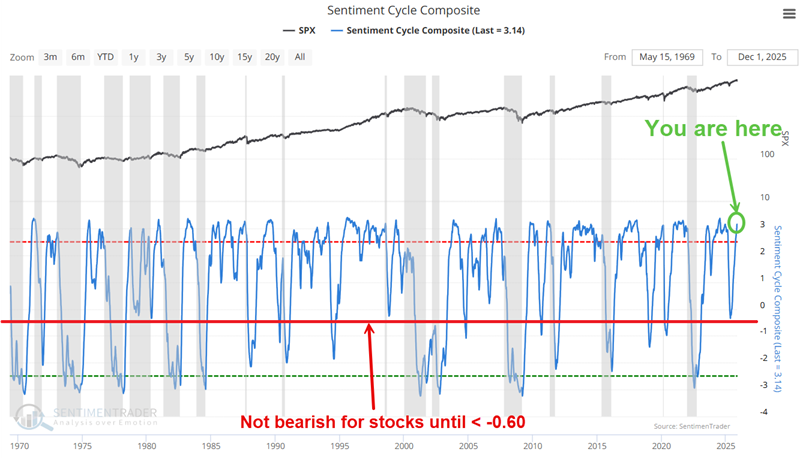
For most sentiment indicators, high readings are typically considered a sign of excessive bullishness and are interpreted as bearish. That is NOT the case for the Sentiment Cycle Composite. In its most basic form, it is deemed favorable for stocks once it rises above -0.60 and unfavorable for stocks when it falls below -0.60. For a more detailed analysis of this indicator, see here.
Currently, there are no concerns regarding sentiment from the Sentiment Cycle Composite, with a current reading of 3.14.
Sentiment Indicator #3: Fear & Greed Model
Our Fear & Greed Model is based on the one published by CNN on their public website. This is our calculation of the model based on the inputs discussed on their website. It does not reflect the values published by CNN; rather, it is our interpretation of the model. Like the Panic/Euphoria Model, the Fear & Greed Model is typically used in a contrary manner - i.e., low readings suggest excessive bearish sentiment and are interpreted as bullish for stocks, and vice versa.
We recently wrote here about a signal from the Fear & Greed Model here. To review, the chart below highlights dates when our version of the Fear & Greed Model dropped below 3%.
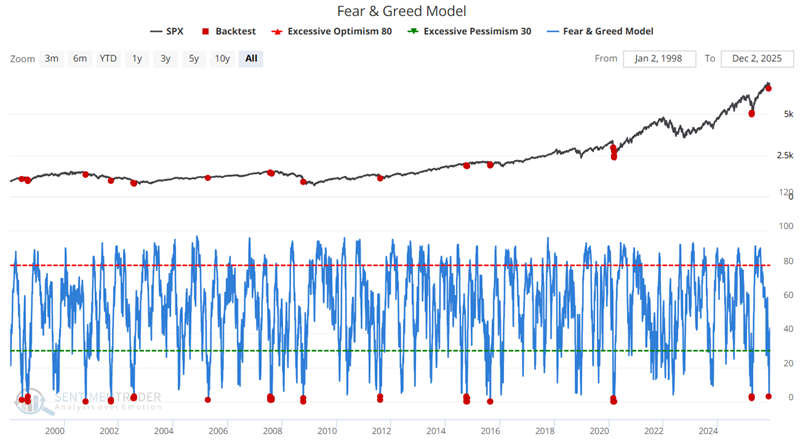
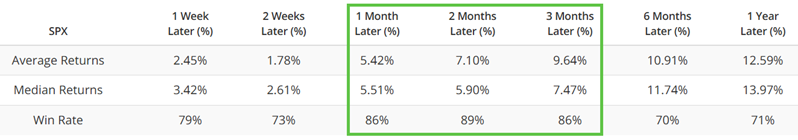
The table below summarizes the subsequent performance of the S&P 500.
Sentiment Indicator #4. AAII Bears
The AAII sentiment survey is a weekly poll conducted by the American Association of Individual Investors, which intends to gauge the overall sentiment of its membership. They ask their membership where they think the market will be in six months, and group the responses into three categories: bullish, bearish, or neutral.
When the percentage of Bears reaches an extreme high, it suggests excessive bearishness and is considered a bullish contrarian sign for stocks. To wit, the chart and table below highlight those rare occasions when the % of Bears exceeded 60.8%, including overlapping signals. Note that there were two signals in early 2025.
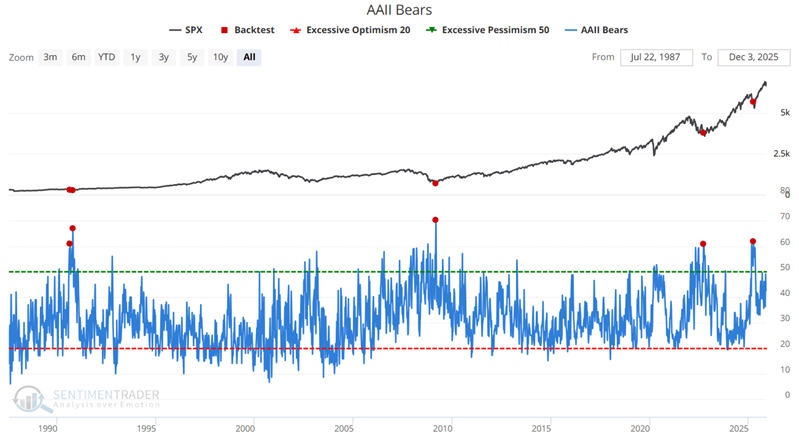
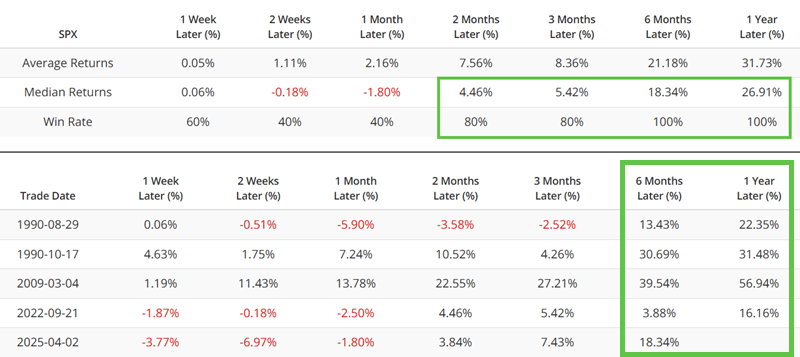
On the flipside, bear markets rarely occur without the percentage of AAII Bears first falling to a low level (typically 20% or lower). As shown in the chart below, the current reading is still significantly higher (42.7%), indicating that there is presently no sign of overly rampant bullishness.

What the research tells us…
Based on historical precedent, it makes sense to look for signs of overly bullish sentiment - or at least complacency, i.e., a complete lack of fear - among stock market investors, before a major bull market top. Currently, despite the significant advances witnessed over the past three years, the primary sentiment indicators show virtually no signs of rampant bullishness or complacency among investors. Does this preclude the potential for a significant correction? Absolutely not. Historically, corrections of 5% to 10% are commonplace within major bull markets. But a significant bull market top in the face of the current sentiment backdrop (probably best described as "overall skittish and worried that the bottom will drop out") would be unprecedented. For now, sentiment remains a favorable factor for the stock market.