
The curious (and compelling) case regarding LIT Optix

Key points
- Ticker LIT is an ETF that holds a basket of lithium industry-related stocks
- LIT trader sentiment just reached an extreme reading
- Extremes in LIT trader sentiment may (or may not, depending on your own point of view) have some residual influence on gold, gold stocks, and the broader stock market
The origin
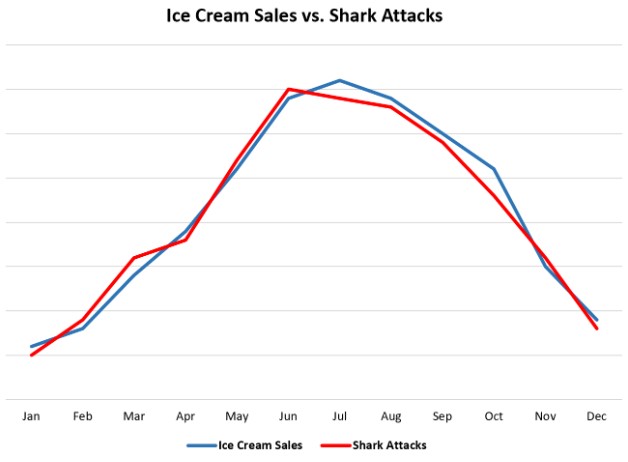
There is a phrase many analysts know that reads "correlation without causation." In a nutshell, certain events seemingly have a high degree of correlation but, in reality, have nothing to do with each other. For example, consider the annual seasonal trend in ice cream sales versus the number of shark attacks as shown below (courtesy of www.statology.org).
According to Statology.org:
Does this mean that consuming ice cream causes shark attacks? Not quite. The more likely explanation is that more people consume ice cream and get in the ocean when it's warmer outside, which explains why these two variables are so highly correlated.
Although ice cream sales and shark attacks are highly correlated, one does not cause the other.
Another related phrase states, "This makes no sense at all."
Either or both of the above phrases may apply here. Nevertheless, as a proud graduate of "The School of Whatever Works" (good 'ole SWW) there is another phrase I have picked up over the years that simply states that "Opportunity is where you find it."
At Sentimentrader, our job is not to tell you what to think about certain information but to provide the information and let you make your own decision. So strap in because this one is a doozy.
The curious case of Lithium Optix
First off, per Wikipedia:
Lithium and its compounds have several industrial applications, including heat-resistant glass and ceramics, lithium grease lubricants, flux additives for iron, steel, and aluminum production, lithium metal batteries, and lithium-ion batteries. These uses consume more than three-quarters of lithium production.
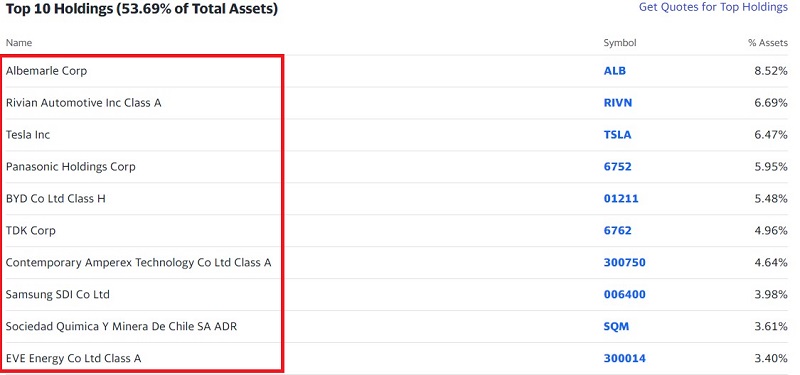
The Global X Lithium & Battery Tech ETF (ticker LIT) does not trade actual lithium. Instead, it holds a basket of stocks involved in some way in the Lithium industry. The Top 10 holdings appear below (courtesy of Finance.Yahoo.com). In essence, it is simply a highly volatile stock fund.
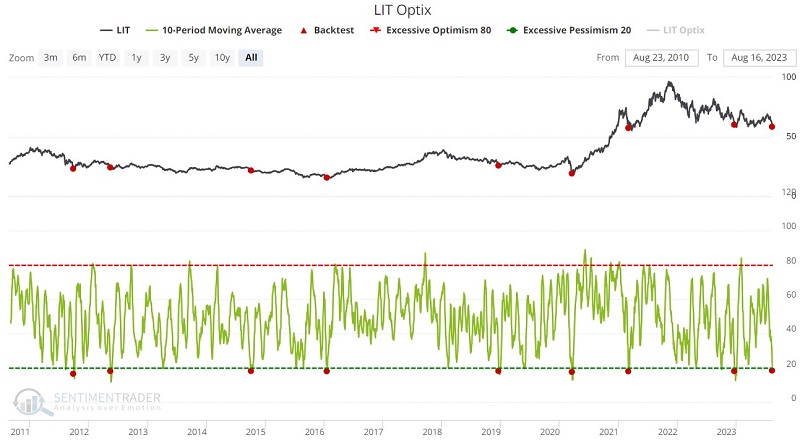
Here is where it gets interesting. The chart and table below display LIT performance after the 10-day moving average of LIT Optix crossed below 19 for the first time in six months. The latest signal occurred at the close on 2023-08-15.
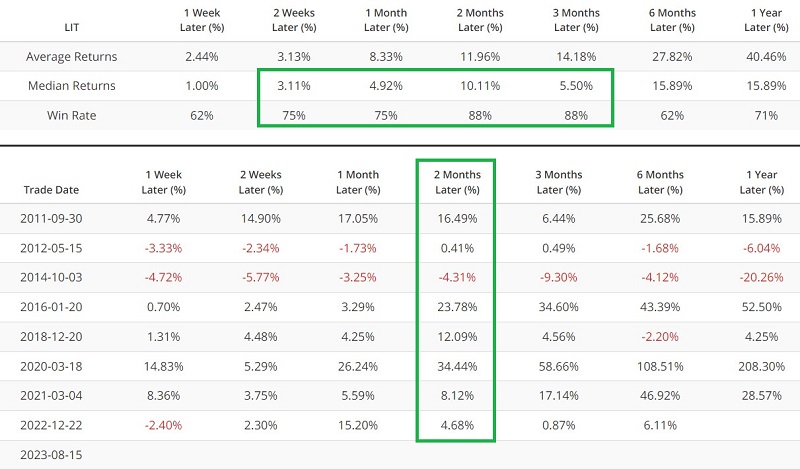
Does this mean we should all pile into LIT? Not necessarily. But if nothing else, the results are compelling food for thought.
But here is where it gets more interesting.
S&P 500 versus LIT Optix
Is there any real connection between lithium and the broader stock market? It certainly sounds like a reach. However, when we remember that ticker LIT is a fund of relatively volatile stocks, perhaps it makes a bit more sense.
The chart and table below display S&P 500 performance after the 10-day moving average of LIT Optix crossed below 19 for the first time in six months.
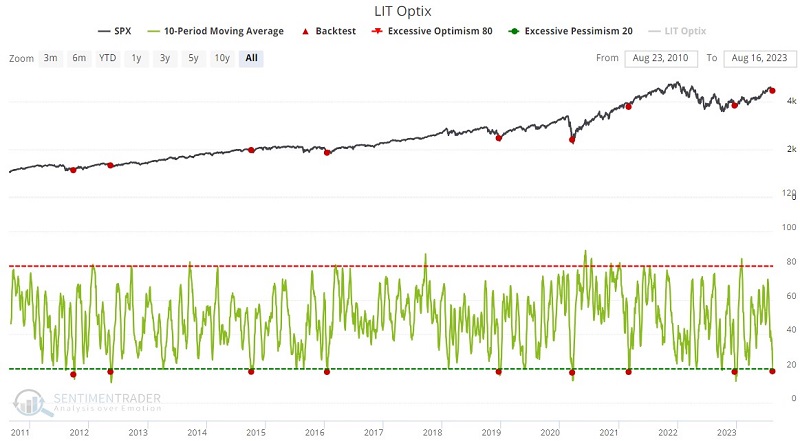
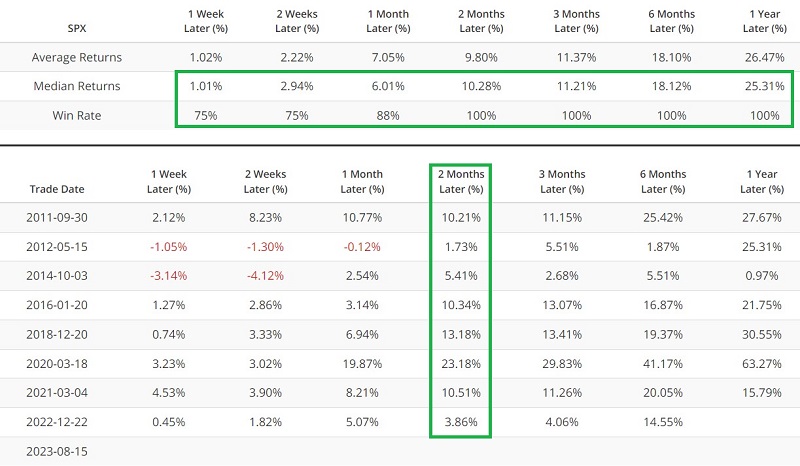
One can reasonably argue correlation versus causation. But as an SWW graduate, it's hard to quibble with the results themselves.
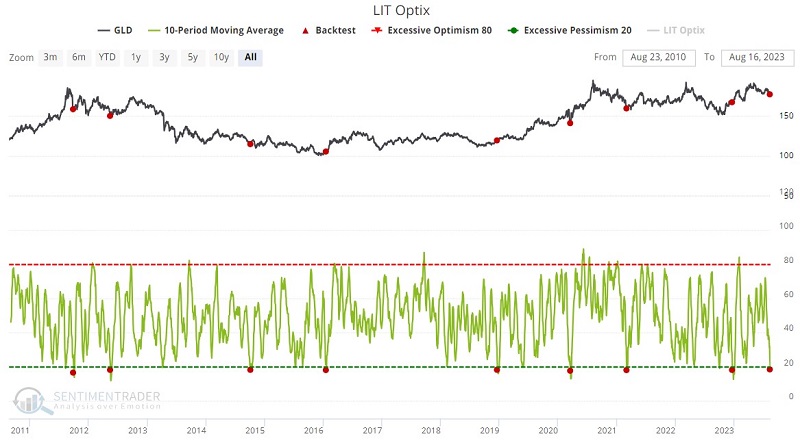
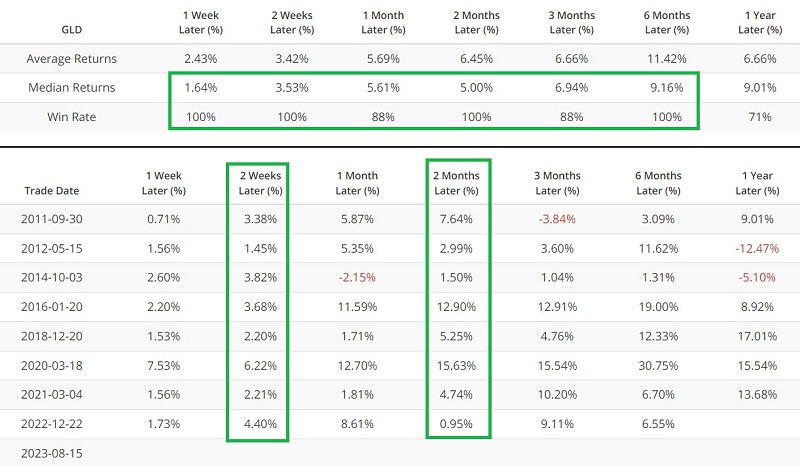
Gold versus LIT Optix
Is there any real connection between lithium and gold? Well, they are both metals with certain specific uses. Is that enough of a relationship? That's up to each individual to decide. Regardless, the chart and table below display performance for the SPDR Gold Trust ETF (ticker GLD) after the 10-day moving average of LIT Optix crossed below 19 for the first time in six months.
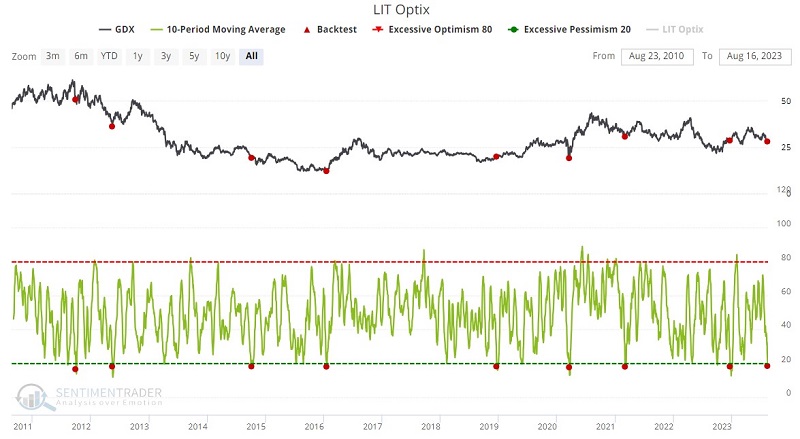
Gold stocks versus LIT Optix
Is there any real connection between lithium and gold stocks? Now that's a stretch. But, the LIT ETF trades a basket of volatile, metal-related stocks. That arguably makes it quite similar to the VanEck Gold Miners ETF (ticker GDX). The chart and table below display performance for ticker GDX after the 10-day moving average of LIT Optix crossed below 19 for the first time in six months.
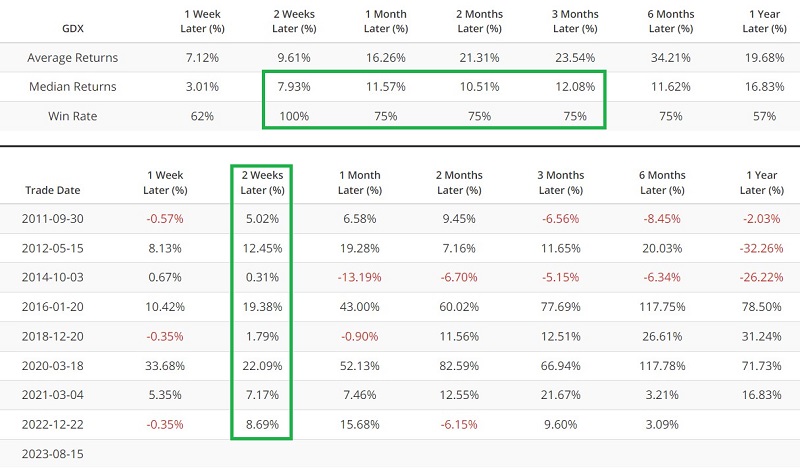
What the research tells us…
The research tells us that lithium-related stocks, gold, gold-related stocks, and the broader stock markets have almost invariably rallied hard after trader sentiment regarding ticker LIT has reached as extreme. The research does not, however, guarantee future results. For now, sentiment regarding ticker LIT has reached another extreme. This leads to the more critical question - that each trader must answer for themselves - "Is this a tradable event?" Consider your own answer carefully. Likewise, if you happen to answer in the affirmative, remember to also give serious thought to all important concepts of reasonable position sizing and risk management. Same as it ever was.