
The crude oil election cycle

Key Points
- Many traders are familiar with the Election Cycle related to the stock market. Far fewer are familiar with the same concept applied to crude oil
- Since crude oil began trading in 1983, certain months within the 48 months comprising an election cycle have tended to show strength, while others have tended to show weakness
- Seasonality is generally best NOT used on a standalone basis but in conjunction with other confirming indicators
The JK Crude Oil Election Cycle
The table below displays the 48-month election cycle and highlights months that tend to be favorable, unfavorable, or with no preference (blank) for crude oil futures.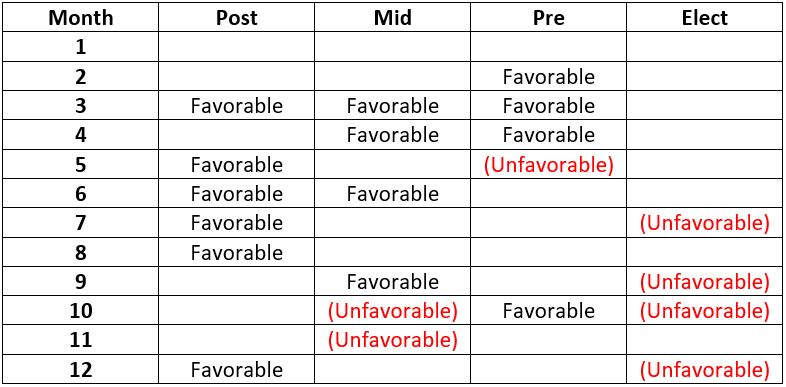
These months were chosen based on optimization using monthly data from 3/31/1983 through 12/31/2012. Let's take a closer look at crude oil performance during "Favorable," "Unfavorable," and "Neutral" months.
Favorable Seasonal Months
The chart below displays the hypothetical performance achieved by holding long a crude oil futures contract only during "Favorable" months during the optimization period of 1983 through 2012.
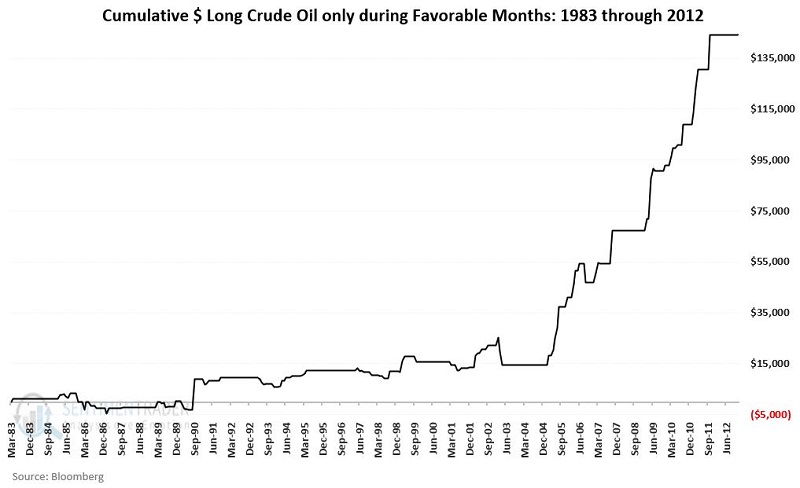
Looks great, right? Of course, it does. That's how optimized, back-tested results always look. The real question for any optimized test is, how does it hold up in real-time? The chart below displays the performance achieved by holding long a crude oil futures contract only during "Favorable" months from 2013 to the present.
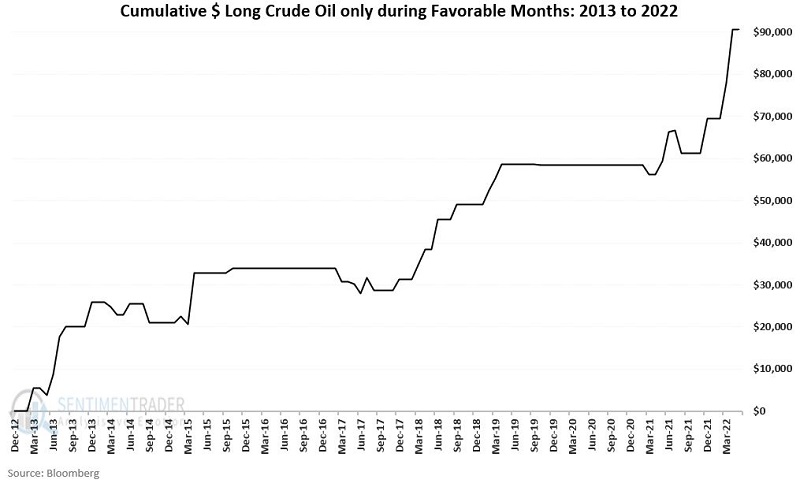
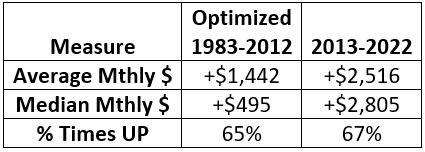
So far, so good. The table below compares optimization versus real-time monthly performance.
Unfavorable Seasonal Months
The chart below displays the hypothetical performance achieved by holding long a crude oil futures contract only during "Unfavorable" months during the optimization period of 1983 through 2012.
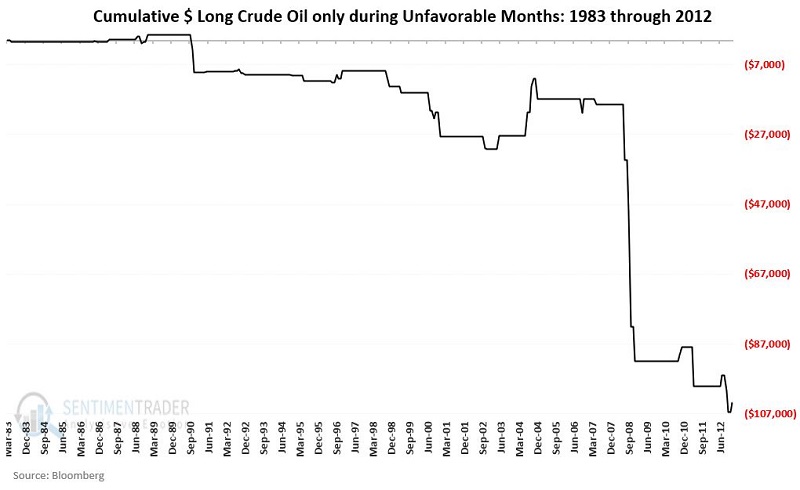
As expected, the performance during optimized "unfavorable" months is pretty dreadful. Once again, the real question is, how did this translate since 2012? The chart below displays the performance achieved by holding long a crude oil futures contract only during "Unfavorable" months from 2013 to the present.
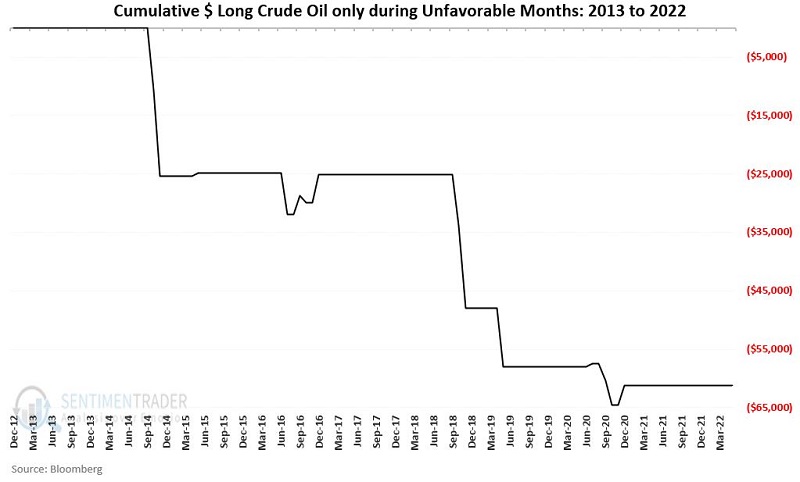
So far, so, um, bad (which, in this case, is good). The table below compares optimization versus real-time monthly performance.
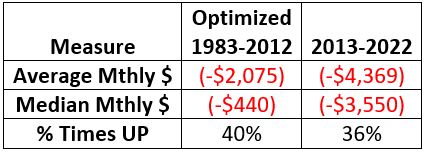
So far, real-time results during "unfavorable" months have actually been worse than during the optimization period. Just remember that there is no guarantee that this will continue.
Neutral Seasonal Months
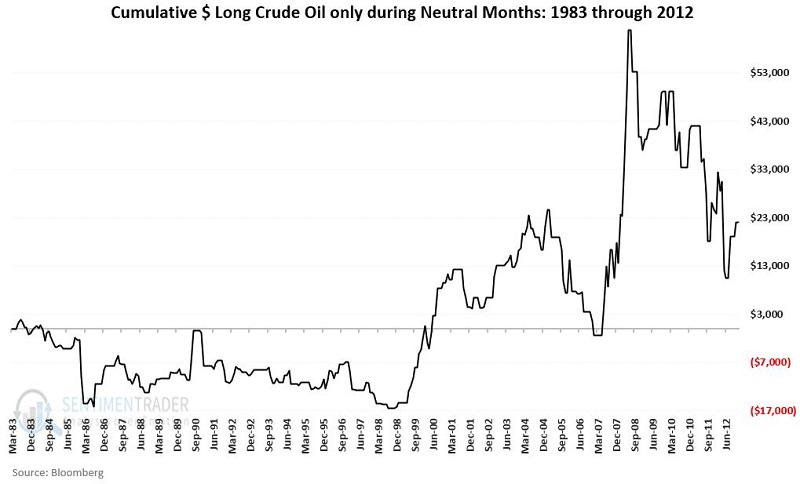
To cover all the bases, months that were not designated as "Favorable" or "Unfavorable" are deemed "Neutral." The chart below displays the hypothetical performance achieved by holding long a crude oil futures contract only during "Neutral" months during the optimization period of 1983 through 2012.
Not much consistency either way; hence these are deemed the neutral months. The chart below displays the performance achieved by holding long a crude oil futures contract only during "Neutral" months from 2013 to the present.
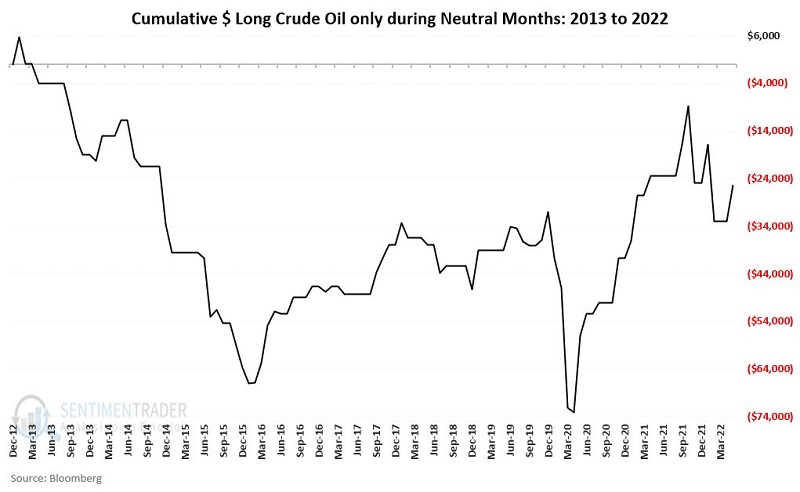
Once again, not much to write home about. So, this particular "strategy" will assume a flat position in crude oil during "Neutral" months. The table below compares optimization versus real-time monthly performance during Neutral months.
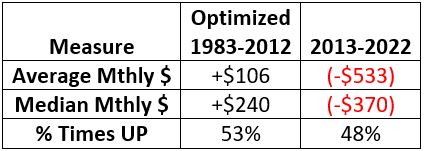
So far, real-time results during "Neutral" months have continued to be, well, pretty neutral.
Combining Favorable and Unfavorable Months
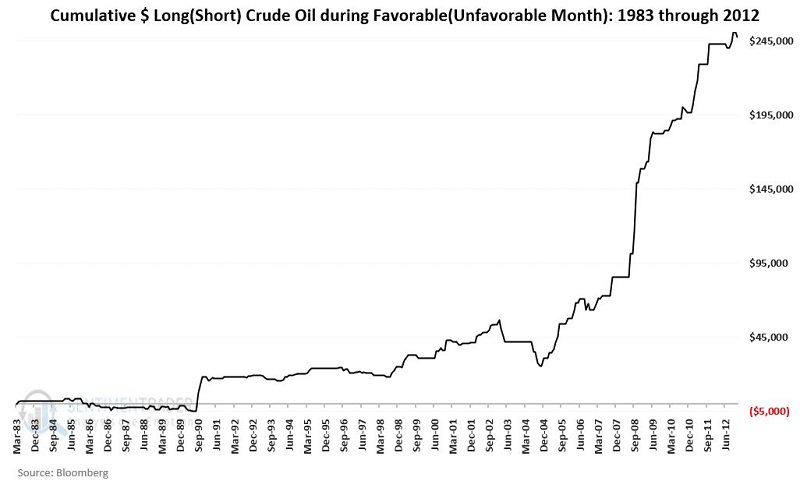
Let's consider a hypothetical strategy of holding crude oil futures long during "Favorable" months and holding crude oil futures short during "Unfavorable" Months. The chart below displays the hypothetical results from 1983 through 2012.
2013 into 2022 results appear in Figure 12.
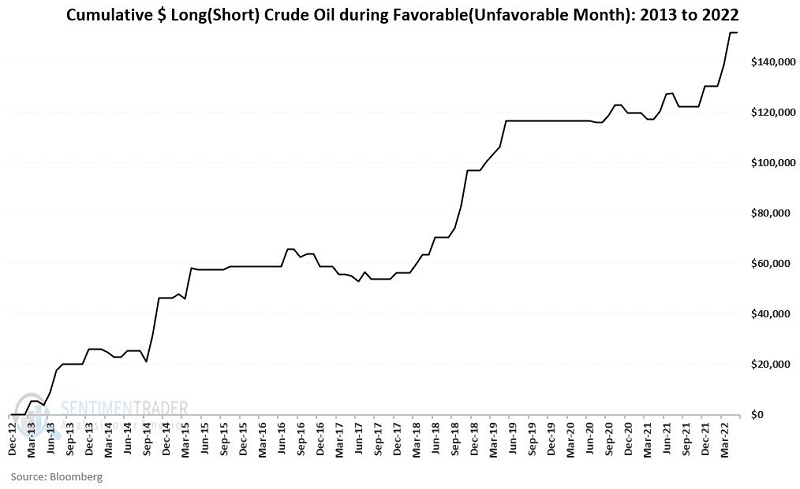
The results are fairly compelling, at least on paper. The reality of trading crude oil futures is another topic. A crude oil futures contract can gain or lose tens of thousands of dollars of value in a very short time. So, a trader who has never traded crude oil futures SHOULD NOT begin trading them based solely on the calendar, buying or selling short and then holding that position no matter what, for a month. The real-world risk involved in doing so is significant.
What the research tells us…
The good news and bad news with established seasonal trends never really changes. The good news is that a given market can move according to a given seasonal framework for an extended period of time. The bad news is that there is NEVER any guarantee that any given seasonal trend will continue to "work" the next time around or at all in the future. Sorry, I don't make the rules.
Nevertheless, once a trader moves beyond the fantasy realm of seasonals as some sort of "magic bullet," they can find valuable ways to incorporate other tools to confirm or deny a seasonal trend each time around. Combining that with reasonable position sizing and intelligent risk management can create opportunity.