
The Crazy Energy Sector

Key Points:
- The breadth indicators of the energy sector show that the percentage of its constituent stocks above their short-, medium-, and long-term moving averages simultaneously hit 100%.
- Historically, March and April are the best-performing months for the energy sector.
- The sharp decline in the insider trading ratio and overbought warnings from momentum indicators suggest smart money behavior.
Extreme Breadth in the Energy Sector
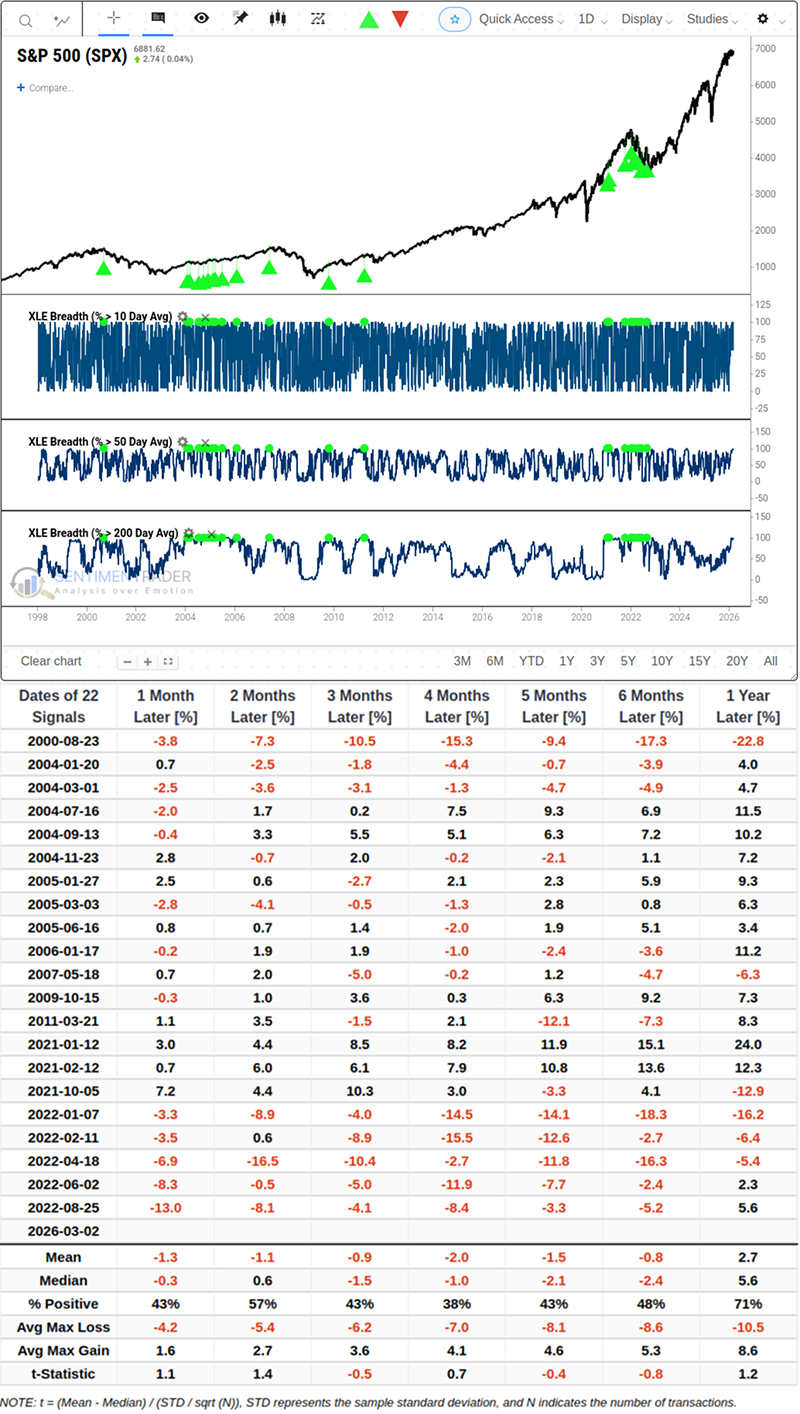
When assessing market health, breadth indicators often reveal underlying capital flows better than single price performance. We observe that 100% of the constituent stocks in the Energy Select Sector SPDR Fund (XLE) are simultaneously above their 10-day, 50-day, and 200-day moving averages.
This phenomenon is a low-probability event statistically. In the past 25 years of market history, this combined signal has only been triggered 22 times before. When all constituent stocks of a sector show a consistent uptrend across three distinct time frames, it reflects a high concentration of capital allocation and extremely strong short-term momentum.
What Do the Extreme Data Within the Energy Sector Mean for the Broader Market?
Historical data tend to show that broad market indices usually face headwinds during this period.Related Backtest Click Here.
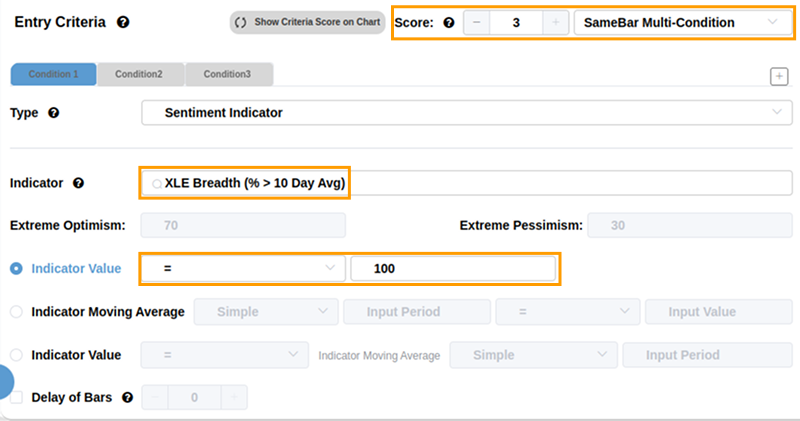
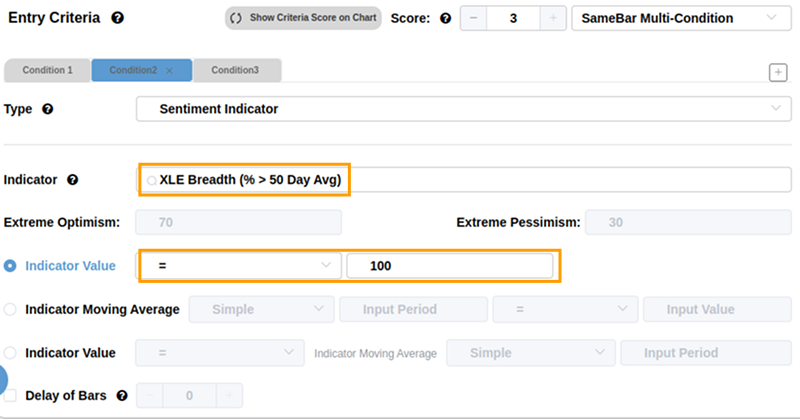
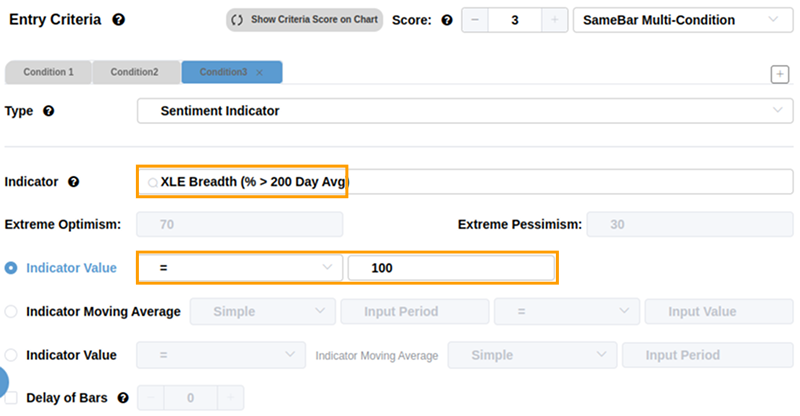
The same backtesting results can be reproduced in the BacktestEdge by configuring the following settings.
The median returns of the S&P 500 index are negative in the 4 to 6 months after the signal appears, and the win rate after 4 months is only 38%. Meanwhile, the average maximum drawdown of -7.0% during the corresponding period is deeper than the average maximum gain of +4.1%.
At the same time, sector performance shows epic divergence.
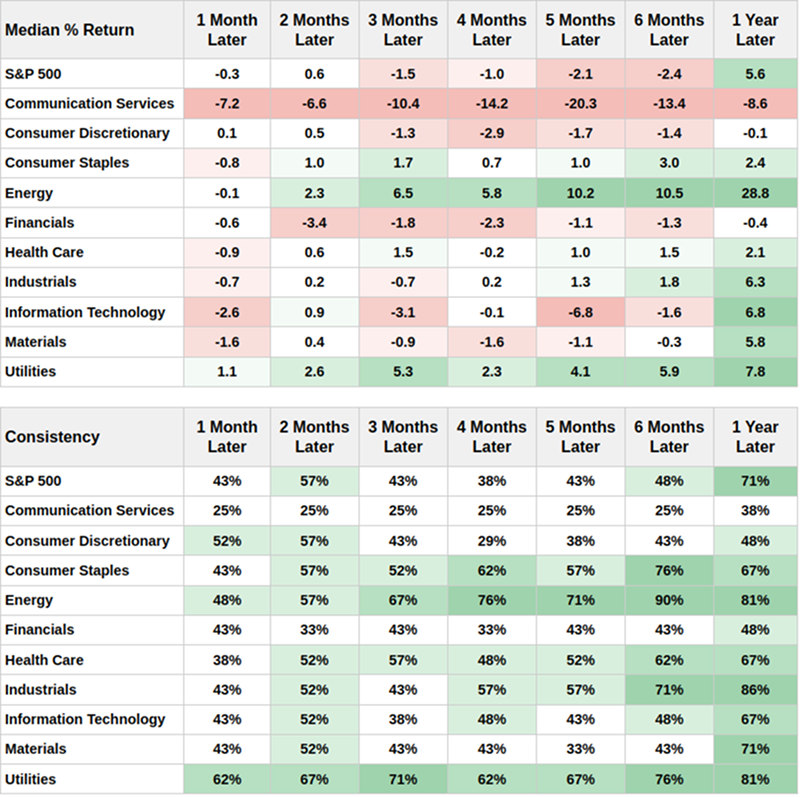
On the one hand, capital embraces real assets with short-term momentum; the energy sector's median return reaches 10.5% 6 months after the signal is triggered, with a 90% win rate. On the other hand, growth sectors are hit hard: the communication services sector's median return 6 months later is as low as -13.4%, with a win rate of only 25%. It should be noted that standard industry data for the Communications Services sector has only been independently compiled since 2018. The relatively short historical sample period may introduce some statistical bias. This phenomenon is usually not a capital "siphon" caused by a single sector, but a market seesaw effect dominated by macro variables.
The Game Between Seasonal Tailwinds and "Front-Loaded Overdraft"
For the recent strong performance of the energy sector, seasonal factors provide an interesting perspective. According to XLE's historical seasonal chart, from the historical average, March and April are usually the strongest-performing months of the year for this sector.
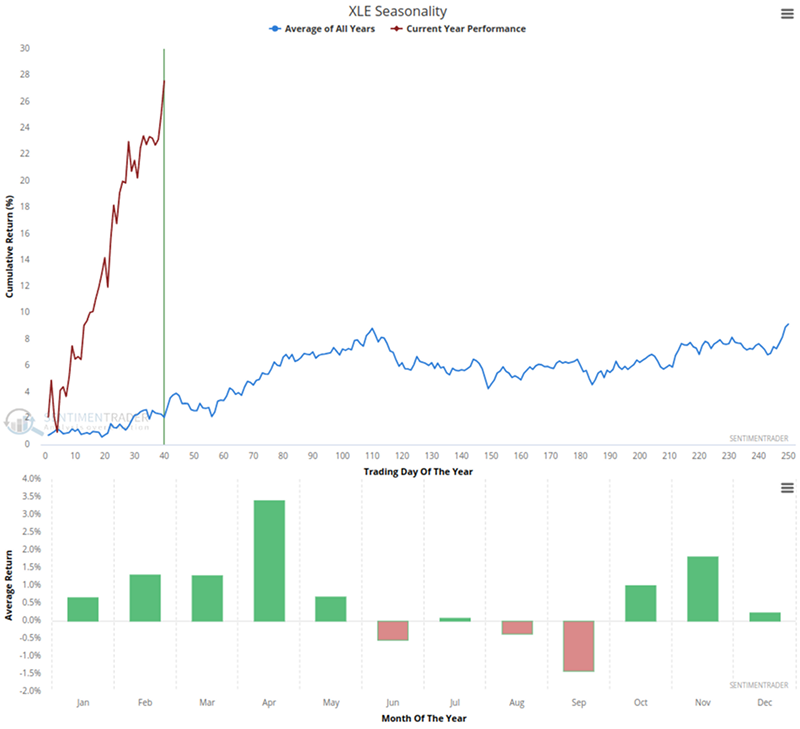
However, observing this year's actual trend, we see a huge deviation in the first 40 or so trading days. The current year's performance has recorded a cumulative return of nearly 28%, while the average historical cumulative return for all years is only between 2% and 4% during the same period. This extreme "front-loaded rally" also suggests a possibility that the market may have priced in the spring seasonal positive factors early and excessively. When the historical tailwind period actually arrives, due to the previous overcrowding, the actual upside may be limited. This is a view based on statistical data; how the future actual trend unfolds will be more affected by factors such as recent geopolitical events.
The Conflict Between Momentum Extension and Insider Selling
Behind the seemingly strong momentum and seasonal deviation, the flow of "smart money" and internal momentum indicators show a very different picture.
First, according to the latest corporate insider trading ratio data, this indicator for the XLE sector has fallen below 0.15. This means that executives and insiders of energy companies are taking advantage of the recent rally to sell their own stocks, and buying interest has decreased.
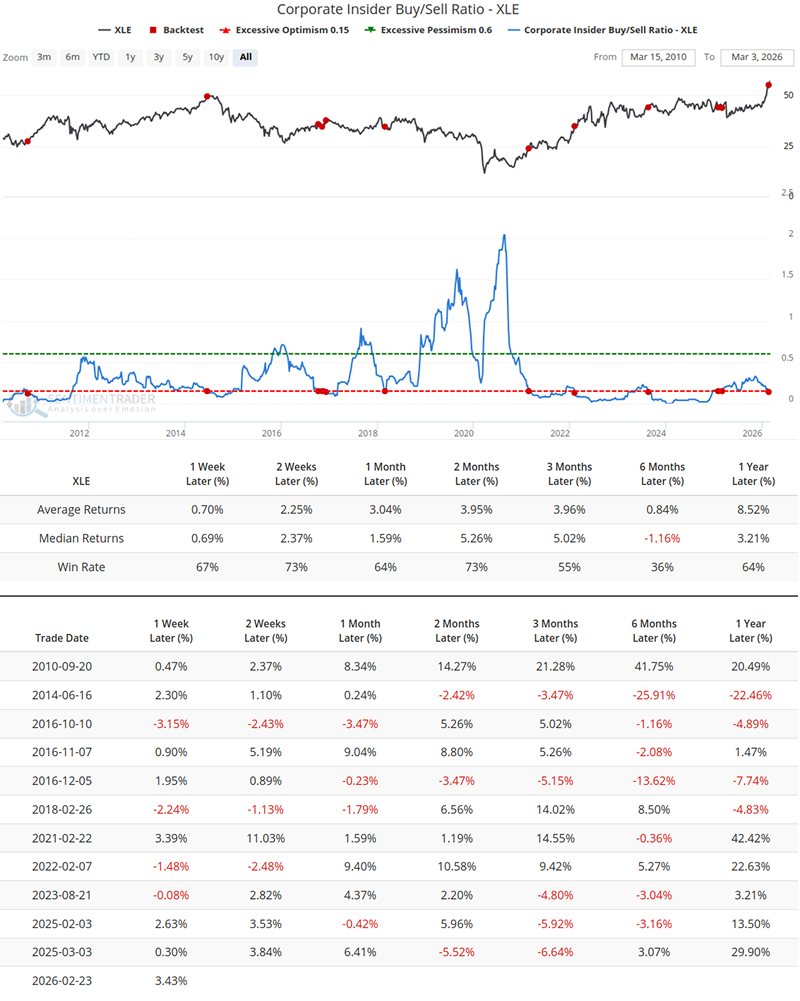
Historical backtesting shows that after triggering this extreme signal, XLE's median return 6 months later is -1.16%, with a win rate of only 36%.
Second, the XLE McClellan Summation Index, which reflects the accumulation of internal market momentum, has also broken above the 1900 level. Since this index is also essentially based on the accumulation of breadth data, it further confirms the overextension of the current trend from a mathematical perspective.
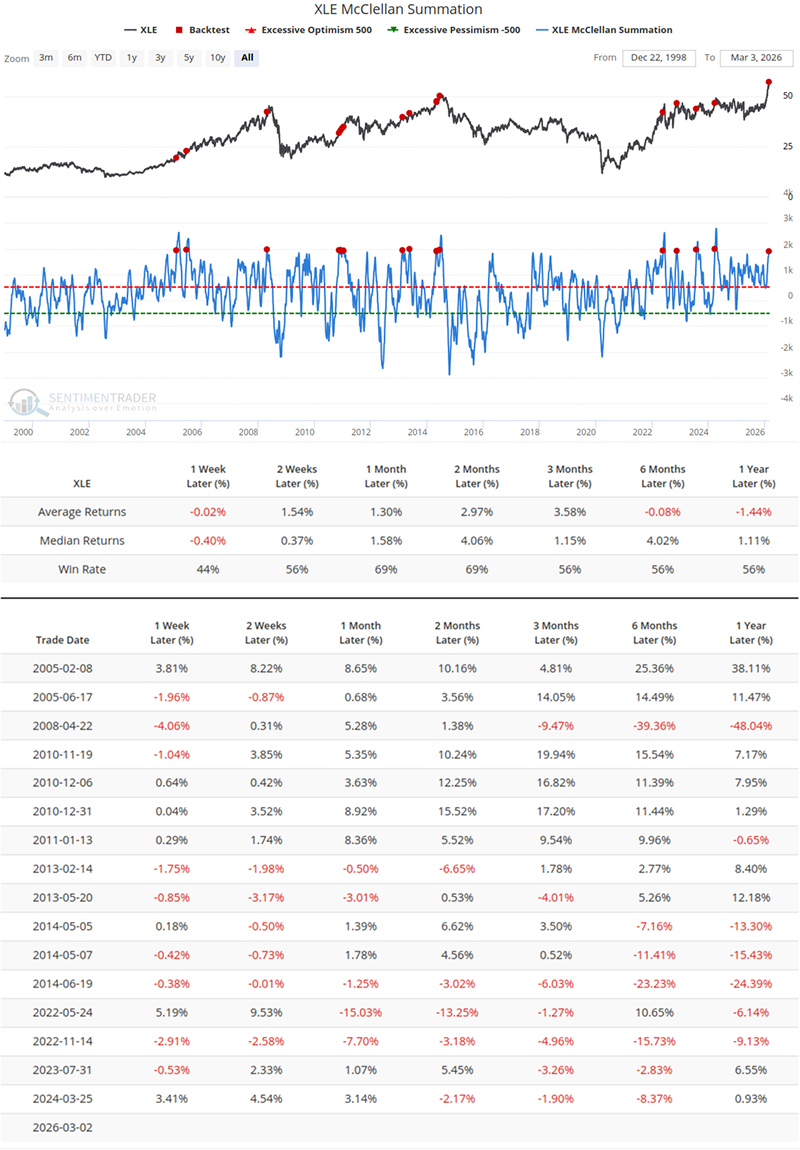
Based on historical data, after this momentum indicator reaches such extremes, XLE's average return in the following year is -1.44%, with a win rate hovering around a neutral 56%.
What the Research Tells Us...
The energy sector shows absolute dominance in price breadth and is entering the best seasonal window in history. However, this year's extremely exaggerated year-to-date rally may have already overdrafted this expectation, while both the insider selling ratio and the momentum summation index have issued warnings of overextension.
Historical probabilities tend to show that when an extremely strong momentum trend meets smart money's profit-taking and retreat, the market usually digests this divergence with sharp, wide-ranging volatility. For the broader market, this extreme crowding in real assets is usually a mirror of macro inflation/hedging trades, often accompanied by medium-term headwinds for the S&P 500 and Nasdaq indices and sharp sector divergence.
The above analysis is based on quantitative statistics of past historical samples and does not constitute an absolute prediction of future market trends. In the current market structure with obvious "great dispersion," understanding the logic of divergence between different indicators, maintaining portfolio balance, and being alert to the mean reversion pressure that may come from extreme crowded trades are a more rational and objective market observation perspective at present.