
The Copper Momentum Play

One of the great things about writing for SentimenTrader is that when I run out of ideas all I have to do is wait for Jason or Dean to have a great idea (and it doesn't take long) and then glom on to their work. Take copper for instance. Last week Dean wrote about "Dr. Copper" and highlighted what happens to copper (and a bunch of other markets) after copper experiences a strong burst of momentum. That is the starting point for this piece.
I have heard strong arguments that the two most important commodities in the world are crude oil and copper (though I still claim that that title belongs to coffee and sugar, but I digress). Regardless of how you feel about fossil fuels, for now, the fact remains that jets don't fly and heavy trucks that transport virtually everything we use don't roll without it. Likewise, a shocking number of products are made from petroleum (do a search sometime for "products made from petroleum" - but maybe pack a lunch because it may take a while to peruse the 6,000+ items on the list of products).
And copper is used in building and manufacturing just about everything (although I still claim that little of that building and manufacturing takes place before the people doing all of that building and manufacturing get their coffee and sugar, so you see my point. But again, I digress).
In Dean's piece, he highlighted that it is significant when copper rises more than 49% in 12 months. While the knee-jerk reaction is, "I don't want to chase something that is already up that much that fast", the reality is that momentum can be a powerful force in the financial and commodities markets.
The chart below displays the 252-trading day percentage price change in the price of copper as well as the +49% "line of demarcation". As you can see, it is not something that happens often.
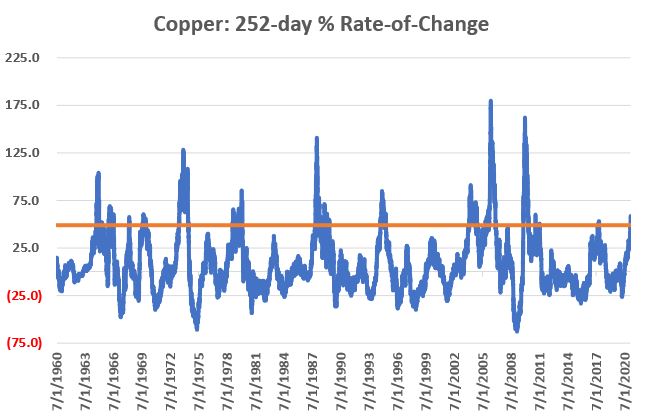
From here, the test I did (which may involve slightly different rules than the one's Dean used) involved the following:
- If copper is up +49% or more over the latest 252 trading day period for the first time in 63 trading days (essentially equivalent to "the first 12-month move of +49% or more recorded in the last 3 months").
- Once a thrust occurs we will hold until either:
- Copper rises 30% or more from the day of the Thrust signal, OR
- 126 trading days go by
Notes:
- The results below are not intended to represent a mechanical trading system
- The sole purpose of the results displayed below is to highlight the general nature of price performance of copper following a significant price thrust (defined as a 252-day percentage rate-of-change of +49% or more)
- For the purposes of this test, if a new "Thrust" signal occurs within 126 trading days of the previous signal, then new signal is ignored
- For tracking the percentage change for profit-taking purposes, we simply divide the closing price of copper each day by the closing price of copper on the day of the thrust (If a gain of +30% or more is registered then the trade is considered done)
- For the purposes of tracking hypothetical profit/loss we will assume that on the close of the day of the Thrust a long 1-lot position is taken in copper futures (each full one point for copper futures is worth $25,000, so a rise from 3.000 to 3.500 would equate to a gain of +$12,500)
- The results below are strictly hypothetical using a continuous contract for copper futures
- No deductions are made for slippage or commission
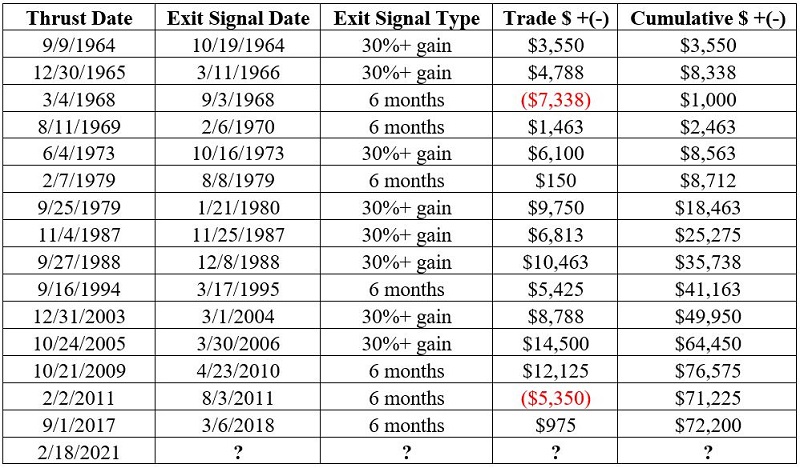
The table below displays the:
- Date of the signal
- Date of the exit
- Type of Exit (either a 30%+ gain or after 126 trading days go by since thrust)
- Hypothetical $ gain/loss for a long 1-lot position in copper futures
- Cumulative hypothetical gain/loss
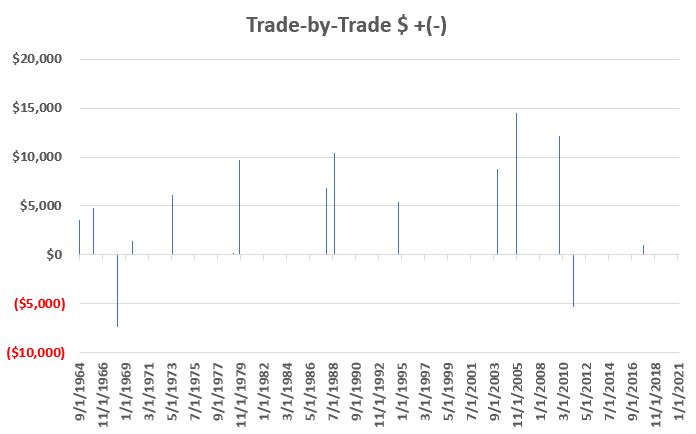
The chart below shows the hypothetical $ +(-) on a trade-by-trade basis.
The chart below shows the cumulative hypothetical $ +(-).
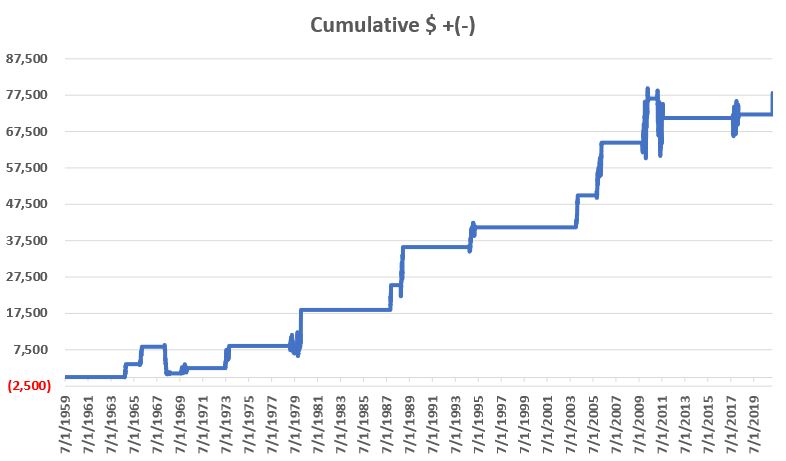
As we can see in the charts above:
- A continuation following a thrust is by no means a sure thing
- There is clearly significant dollar risk
- But overall, the hypothetical results have been quite positive.
The most recent thrust signal occurred on 2/18/21. As I write copper is already over 7% higher than its close on 2/18. So, will this latest signal result in a quick +30% profit? Or will things drag out over the next six months? Or will copper reverse and deliver a loss in excess of over -$5,000 or more as in 1968 and 2011? It beats me.
But the bottom line is that when copper "thrusts" there appears to be a better than even chance of some decent follow through to the upside.
Summary
Thanks Dean.