
The copper / gold ratio sending a message for t-bonds and financials

Key points
- Copper has been losing ground to gold - this often has significant implications for the financial markets
- Under this circumstance, long-term treasuries have tended to show weakness
- Under the same circumstances, the financial sector has tended to show strength
The Copper/Gold Ratio
Jeffrey Gundlach, CEO of DoubleLine Capital LP, has popularized the Copper / Gold Ratio. Note: Our calculation uses Copper and Gold Continuous Futures contracts and divides the price of copper by the price of gold.
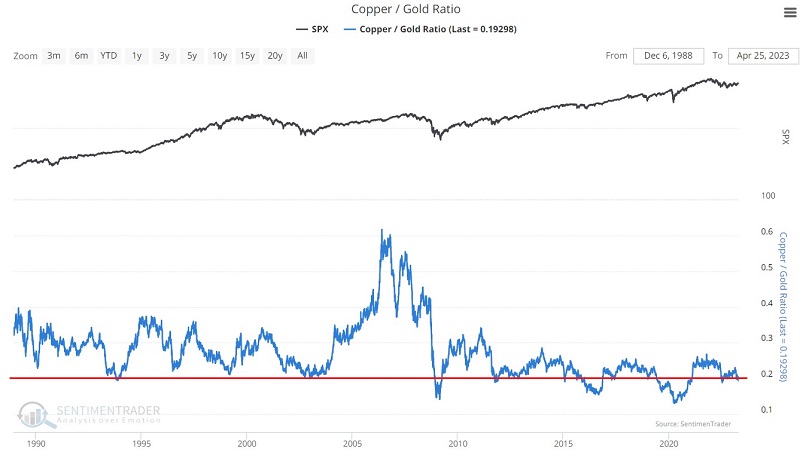
As you can see in the chart above, there is a typical ebb and flow to the relationship between the primary industrial metal and the primary precious metal. At times this ratio can reach extremes. In this chart, we have highlighted the 0.20 level as an important cutoff value.
The copper/gold ratio is popular and widely followed because a) many market participants perceive Doctor Copper to have "a Ph.D. in economics." Likewise, gold is considered by some to be "the ultimate store of value" and also a hedge against inflation and other economic turmoil.
Of course, our interest is not in confirming or denying any of these claims. As always, our interest is in the cold, hard-performance numbers. Let's examine how two assets have performed when the Copper/Gold Ratio is below 0.20.
Thirty-year bonds tend to show weakness
The chart below displays price action for 30-year treasury bonds at the top and highlights with a red dot all days when the copper/gold ratio was below 0.20.

The table below summarizes the subsequent 30-year treasury bond price performance.
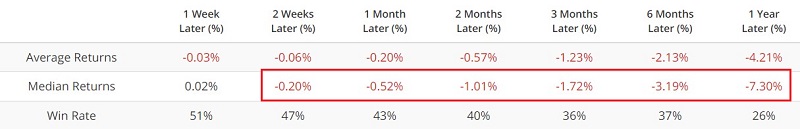
Two key things to note:
- The Win Rates remind us that it is no "sure thing" that t-bonds will decline following a reading below 0.20
- However, it is interesting to note that both average and median returns get worse across each progressive timeframe
There is no reason bonds cannot rally in the months ahead. Nevertheless, the bottom line is that this indicator falls firmly on the bearish side of the ledger for long-term treasury bonds.
Financial stocks tend to show strength
Both long-term treasury bonds and stocks in the financial sector are affected by fluctuations in interest rates. So many would likely assume that "what's bad for bonds is probably bad for financial stocks." And it sounds like a reasonable theory. But in the case of the copper/gold ratio, the numbers tell a different story.
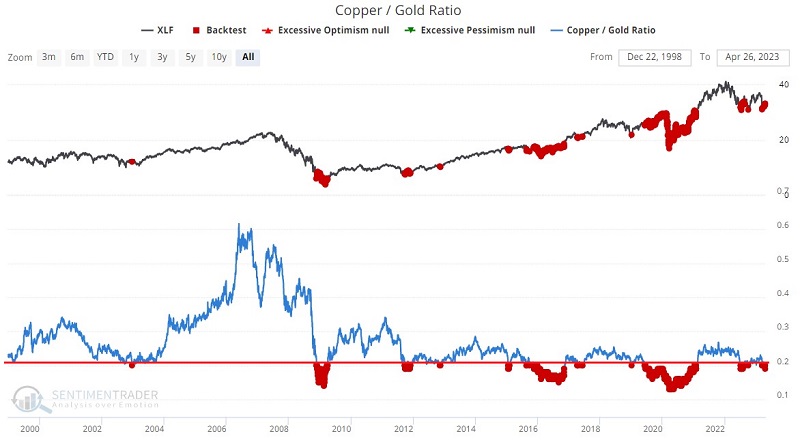
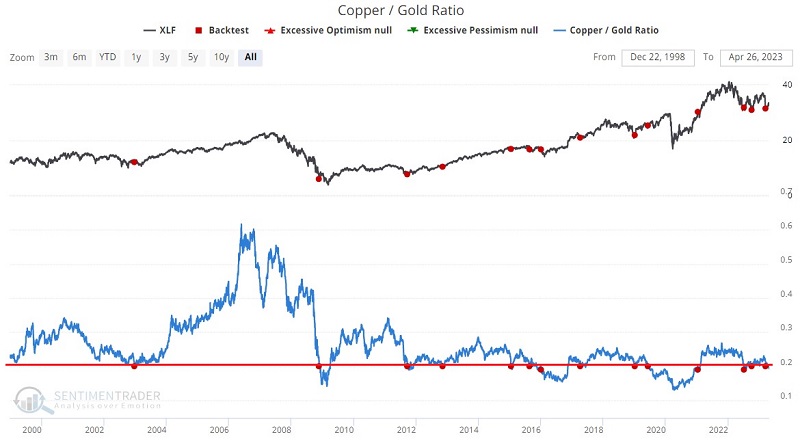
The chart below displays price action for Financial Select Sector SPDR Fund (ticker XLF) at the top and highlights with a red dot all days when the copper/gold ratio was below 0.20.
The table below summarizes subsequent XLF price performance.
Two key things to note:
- The Win Rates remind us that it is no "sure thing" that financial stocks will rally following a reading below 0.20
- However, it is interesting to note that both average and median returns get better across each progressive timeframe
Let's run a second test to remove some of the performance bias created by prolonged drops below 0.20 by the copper/gold ratio. For this test, the chart below highlights when the copper/gold ratio dropped below 0.20 for the first time in at least three months.
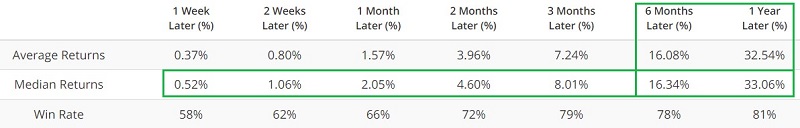
The table below summarizes subsequent XLF price performance.
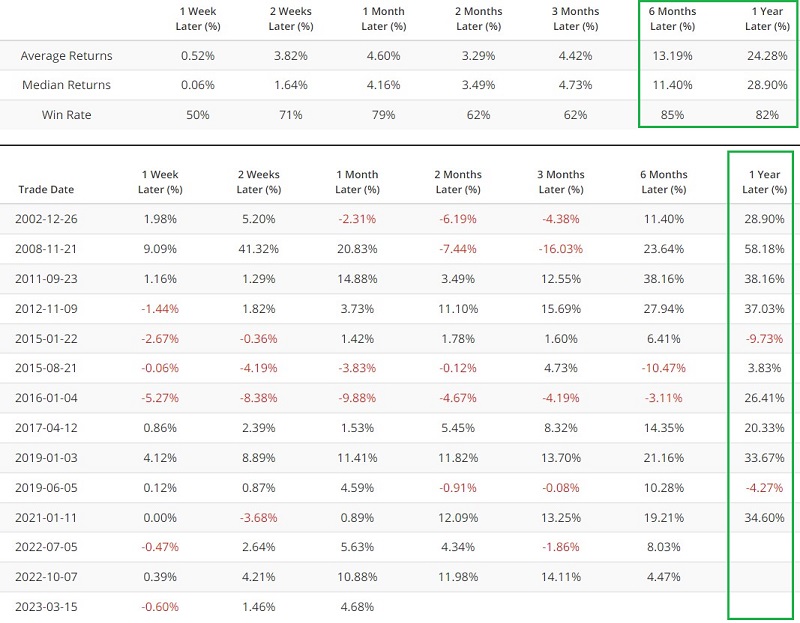
Historical six and twelve-month returns still skew significantly positive.
What the research tells us…
Does copper really hold a "Ph.D. in economics?" Is gold really the "ultimate store of value?" Who knows. Anyone who wants to debate those questions is welcome to do so. As investors, our interest is in how the markets react to changes in the ratio between these two critical metals. Historically, when the copper/gold ratio has headed toward the low end of the historical range, long-term treasuries have tended to show weakness, and the financial sector has tended to show strength.