
The copper conundrum

Key points
- Copper has been on a tear lately
- The good news is that one indicator was a perfect record (so far) is still flashing favorable signals
- The bad news is that copper has gotten somewhat overbought, is nearing a significant resistance level, and is entering a period of potential seasonal weakness
Copper has been on a roll
The chart below shows that copper has rallied over 25% since early February.
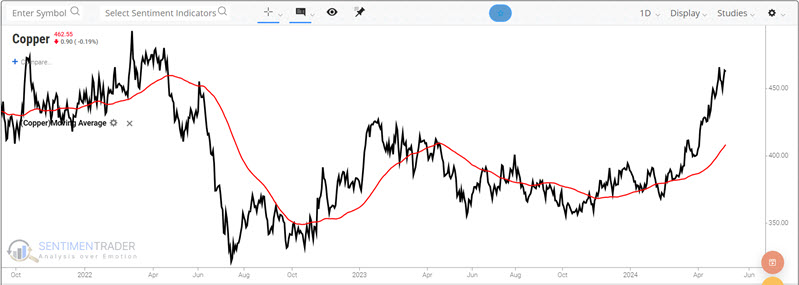
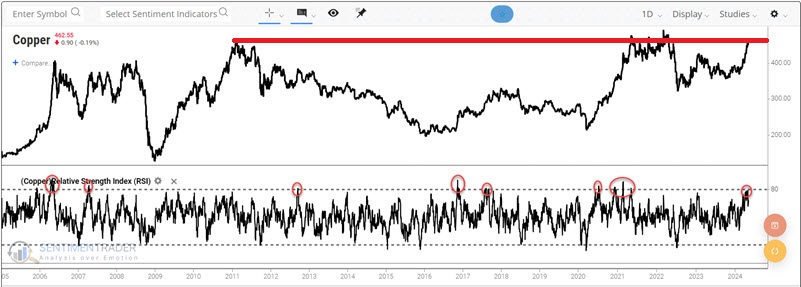
When the metals markets get on a roll, they can run a long way, so there is a danger in attempting to fight the trend. That said, the 14-day RSI recently poked above 79%, which is often followed by at least a period of consolidation.
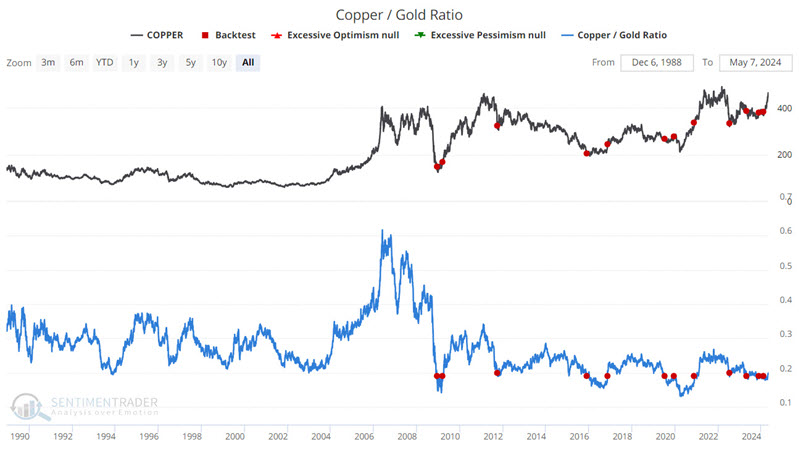
The Copper/Gold Ratio has been flashing green
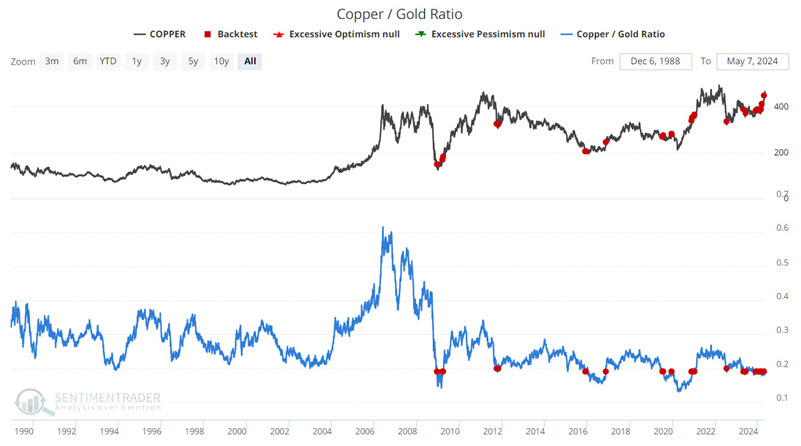
The chart below highlights all dates when the Copper/Gold Ratio has crossed above 0.19.
The table below summarizes subsequent copper performance.
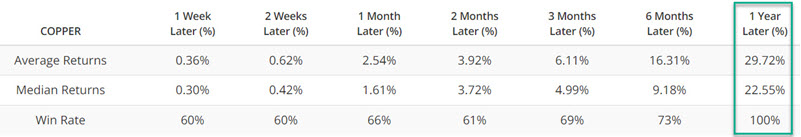
The critical thing to note is that there is a 100% Win Rate for 12 months. The caveat is that no indicator signal is guaranteed to remain 100% accurate. So, despite the gaudy numbers, this is still merely favorable weight of the evidence.
If we constrain the results above to only the first signal within three months, we still get the results shown in the chart and table below.
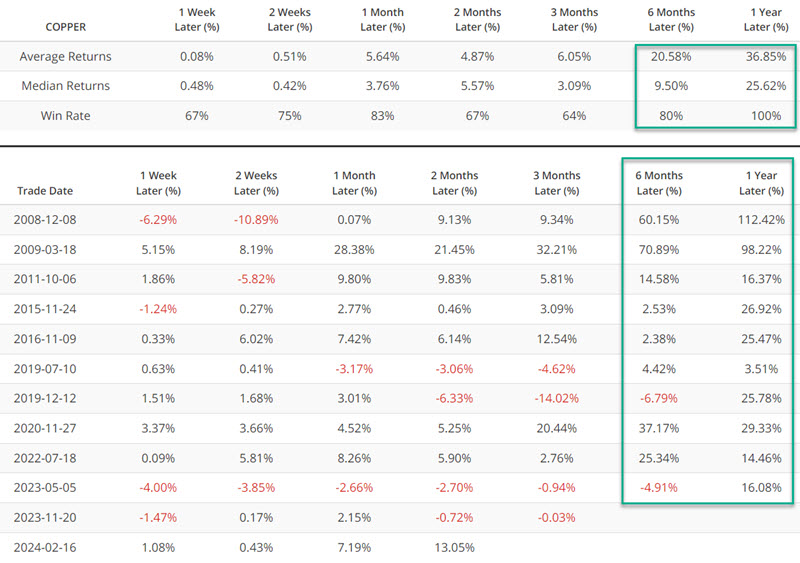
Again, while the results above do not guarantee anything, they do suggest that traders remain open to the bullish case for copper in the year ahead.
Meanwhile, seasonality casts a potential shadow
Even in the context of a powerful bull market, consolidations and potentially significant pullbacks are possible. The recent RSI reading above 80, combined with the seasonal information highlighted below, suggests the potential for short-term weakness in copper.
The chart below highlights the annual seasonal trend for copper.
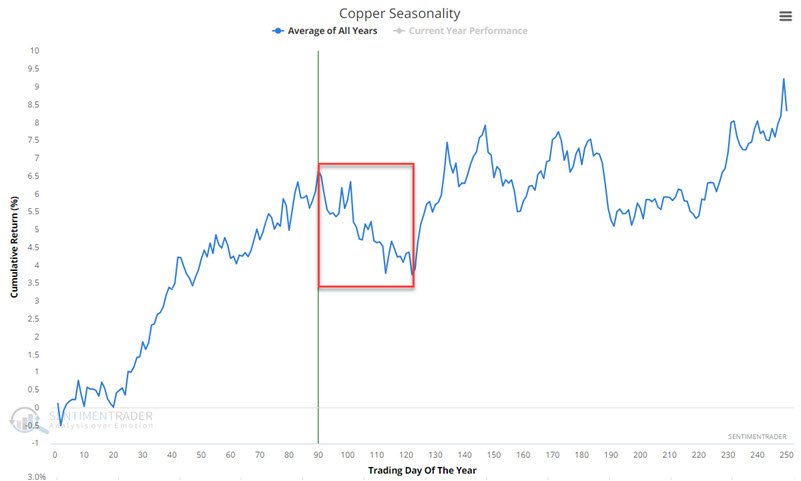
The red box highlights the period from Trading Day of the Year (TDY) #90 through TDY #122. For 2024, this period extends from the close of 2024-05-07 through the close of 2024-06-21.
The chart below displays the hypothetical cumulative gain from holding a long position in copper futures only during this unfavorable period every year since 1960.
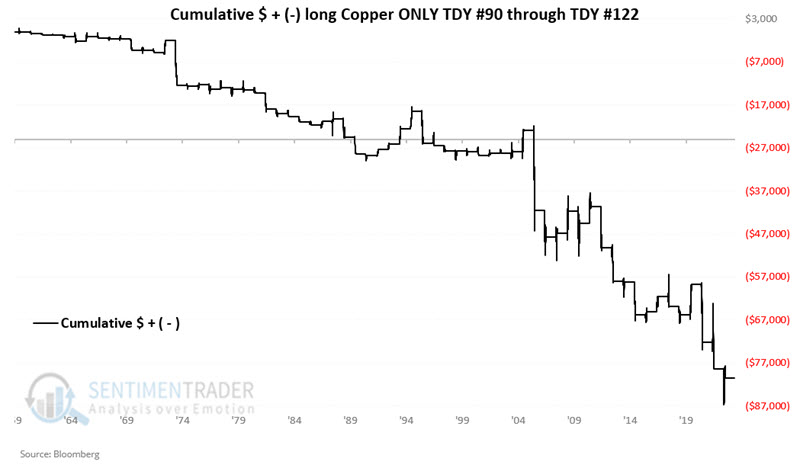
The chart above clearly shows the potential danger of being bullish on copper during this annual period. Still, a closer look at year-by-year results reminds us that it is a mistake to simply assume that copper is doomed to retreat over the next month and a half. The table below summarizes copper's performance during this seasonal period.
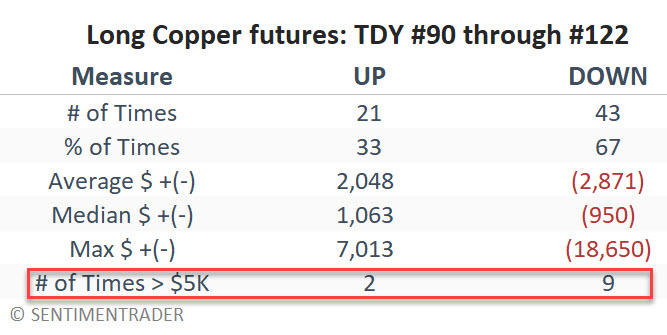
Copper has gained one out of every three years during this period, so this is no "bearish sure thing." The biggest problem is that bad years tend to be very bad-moves of $5K or more are skewed to the downside by 9-to-2.
What the research tells us…
For the moment, one can only consider the current copper trend favorable. The big question is, "Where to from here?" Based on the information above, a trader already holding a long position might continue to give the bullish case the benefit of the doubt, with an eye on nailing down a profit if weakness ensues. More aggressive traders, on the other hand, should be watching closely for an opportunity to play the short side between now and late June.