
The copper conundrum

Key Points
- Copper is flashing contradictory signals
- The Copper/Gold Ratio recently triggered a bullish alert
- Seasonality is entering a period of weakness
- Price action remains negative - but could change quickly
Copper/Gold Ratio
The chart below displays those rare occasions when the Copper/Gold Ratio has crossed below 0.19 for the first time in a year.
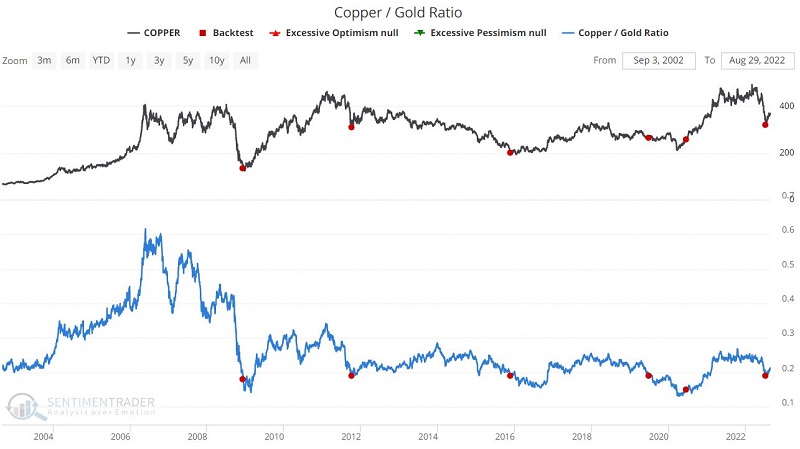
The most recent signal occurred on 2022-07-14, and copper has charged out of the gate since.
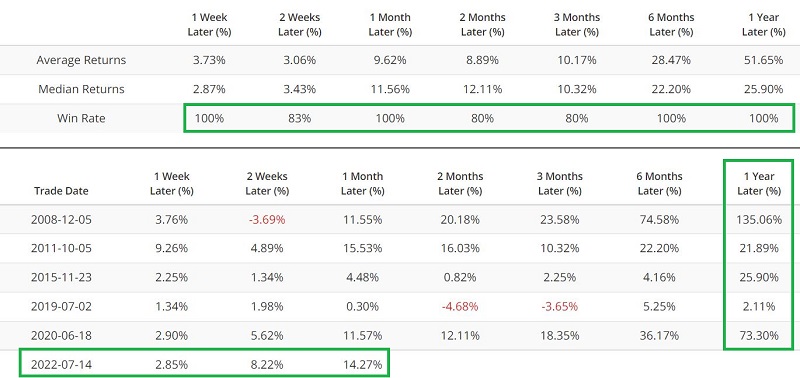
Do the results above guarantee that copper will continue to advance sharply? Not at all. They do, however, argue in favor of giving the bullish case the benefit of the doubt in the year ahead.
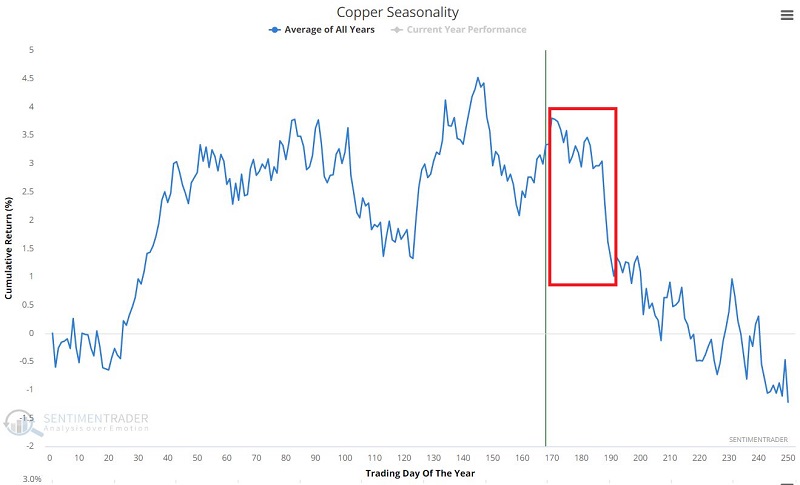
Seasonality
On the flip side, the annual seasonal chart below reveals that copper is about to enter a period of general price weakness.
The chart below displays the cumulative $ +(-) for copper futures held long only during Trading Day of Year #171 through TDY # 191. For 2022 this period extends from the close on 2022-08-29 through the close on 2022-09-27 (NOTE: The futures contract data from Bloomberg that we follow includes trading on holidays).
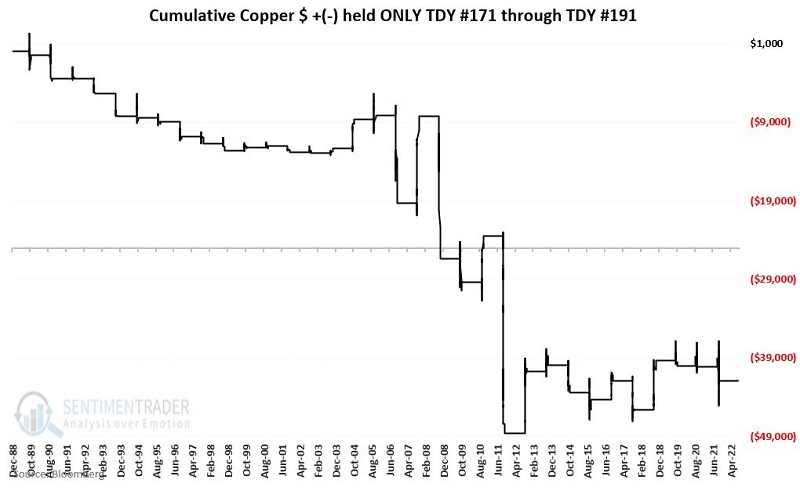
The table below displays a summary of performance during this seasonally unfavorable period.
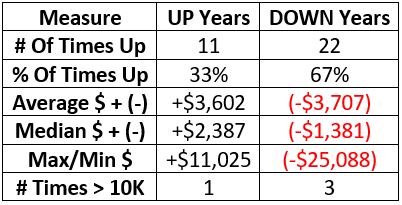
These results essentially have the inverse implication as shown above for the Copper/Gold Ratio. As always, seasonality is climate, not weather, and each time around is its own roll of the dice. Still, a 33% Win Rate during this period suggests waiting a while before entering a bullish position in copper.
Price action
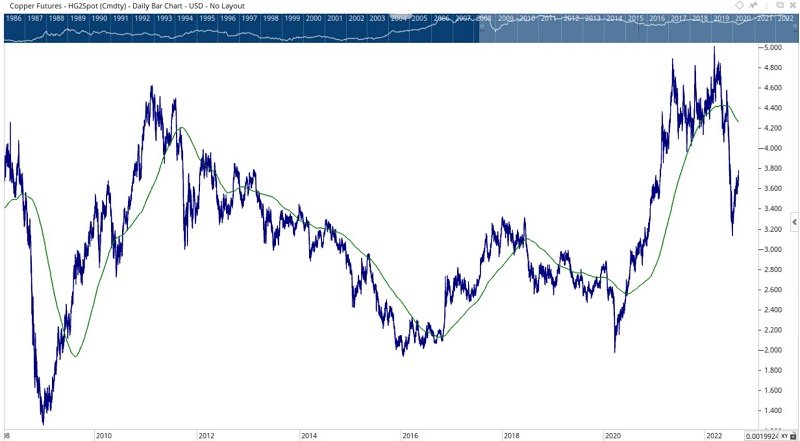
If we look at price action as a tie-breaker, the outlook is unfavorable. The chart below (courtesy of Optuma) displays the price of copper versus its 220-day exponential moving average. The industrial metal made a run during its recent rally but has a long way to go to get back to this long-term average. On a more optimistic note, similar price plunges in 2008 and 2020 were followed by significant, multi-year rallies.
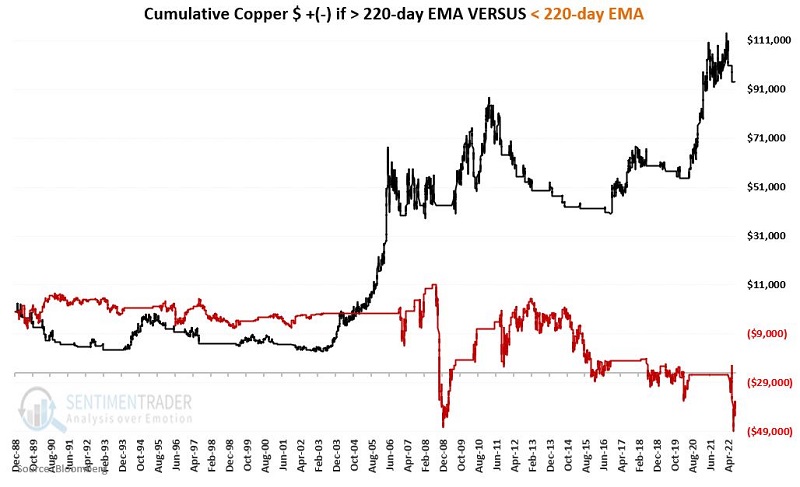
The chart below displays equity growth separately when copper is above (black line) or below (brown line) its 220-EMA. While properly not worth using as a standalone trading model, the critical thing to note is the subpar results achieved when copper trades below this long-term EMA.
What the research tells us…
Following previous instances, a drop below 0.19 by the Copper/Gold Ratio has witnessed extremely bullish price action for copper. As a result, traders are urged to remain alert for an opportunity to play the bullish side of this crucial commodity. Unfortunately, seasonality and price action are arguing for caution in the near term. Anyone trading copper at the moment must hold a high conviction rate in the trend they choose to play. However - and more importantly - a trader must pay close attention to risk and plan carefully regarding the use of stop-losses and profit targets, as price movement may be swift.