
The contrarian case to the "inevitable" bond rally

Key points
- The one seemingly "sure thing" now is that "the Fed will soon cut rates, interest rates are destined to fall, and bond prices are sure to rally"
- Who are we to fight "the inevitable?" Still, our job is to analyze data as objectively as possible and report what we see
- There are presently several indicators and models that are not bullish for long-term treasury bonds
Bonds are trying to rally
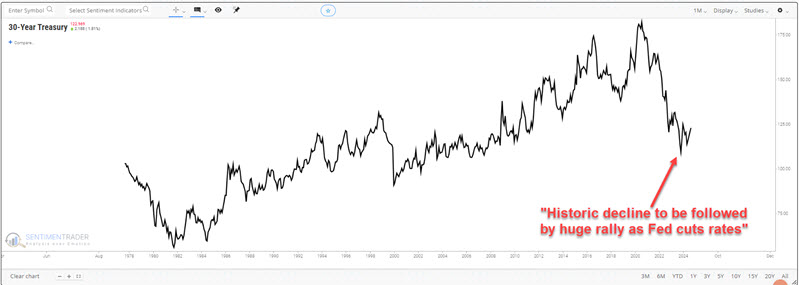
The chart below displays a monthly chart of 30-year treasury bond futures (THIRTY). Conventional wisdom now screams that long-term bonds have suffered a "historic" drawdown and that bond prices are poised to soar with the Fed about to start cutting rates. Since long-term treasuries are the most sensitive to interest rate changes (falling rates mean higher prices and vice versa), the standard argument is that they are the place to be for investors.
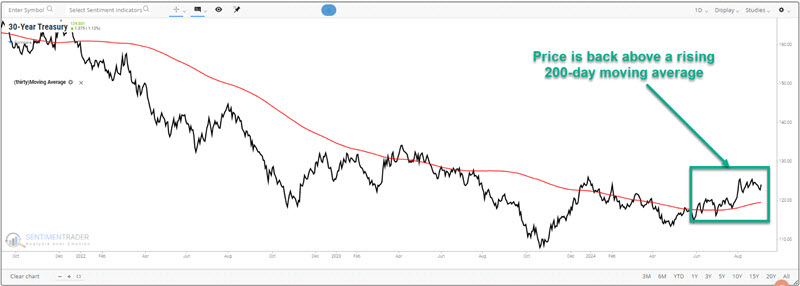
Likewise, on a technical basis, a bullish case can be made. The daily chart below shows that THIRTY is back above a rising 200-day moving average. As long as it remains the case, it does make sense to give the bullish case the benefit of the doubt (or at least not to play the short side).
So, given the "inevitability" of lower interest rates and an existing - if nascent - bullish trend, what possible reason could there be not to climb aboard? Let us count the potential ways.
First, the big picture for interest rates is unfavorable
The chart below displays the trend for 10-year treasury yields traced back to the late 1700s.
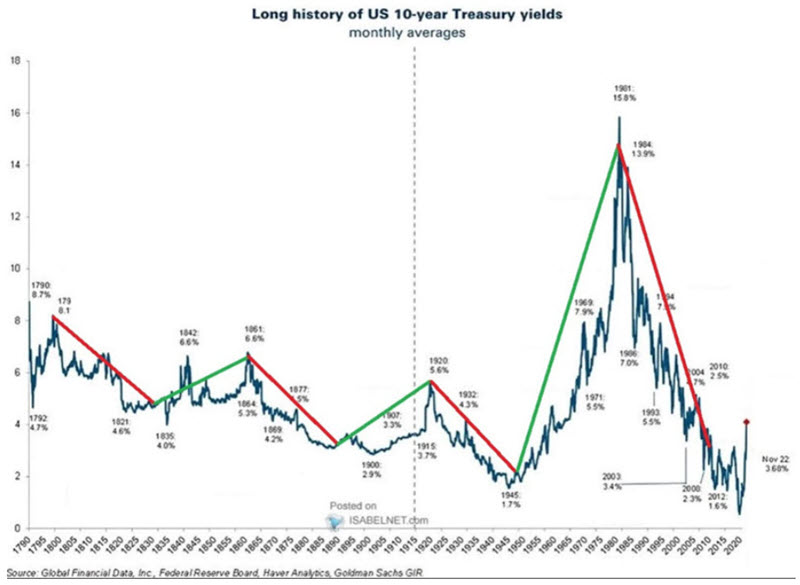
The critical thing to note is the tendency for yields (i.e., interest rates) to move in very long-term waves. The chart identifies a 60-year cycle, with roughly 30 years of falling rates followed by roughly 30 years of rising rates. The latest cycle bottomed out in 2010 and projects a generally rising rate environment until 2040.
This cycle is by no means "exact." Interest rates did not bottom out until 2020, and there is no "guarantee" that rates will rise until - nor top out in - 2040. Still, if this chart tells us anything, it is that interest rates may be more stubborn to sharp declines than most investors currently think.
JK Bond Cycle Thermometer and JK Bond Cycle Model remain bearish
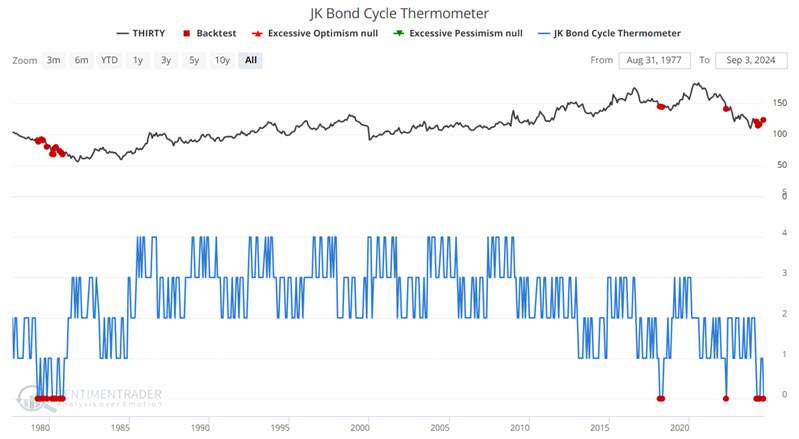
In a series of articles earlier this year (see here, here, and here), I introduced the JK Bond Cycle Thermometer and JK Bond Cycle Model. These models are based on very long-term cycles in interest rate trends. The good news is that they have a decent track record in backtesting. The bad news is that they are not very price-dependent. So, if bond prices do establish a meaningful rising price trend, these models can get left behind. That said, for now, they are flashing unfavorable signs for bonds.
The chart below displays the monthly action for the JK Bond Cycle Thermometer, which can range from zero to +4. The model is presently at a reading of zero.
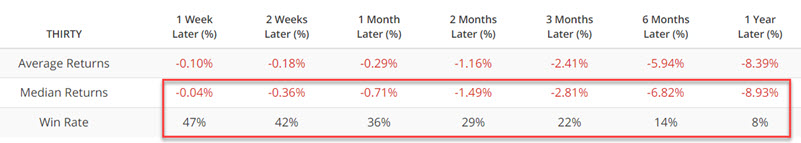
The table below summarizes THIRTY performance following previous zero readings for this model.
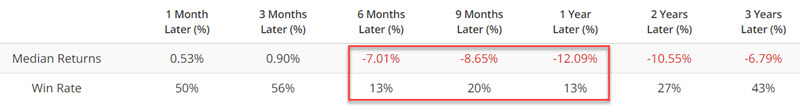
Do Win Rates of 13% guarantee that bond prices will fall in the next six to twelve months? Not at all. But they do provide an objective warning sign.
The following chart displays the monthly action for the JK Bond Cycle Model. Based on the action of the previous model, this model ranges from 0 (bearish for bond prices) to +1 (bullish for bond prices) and is currently at a zero reading.
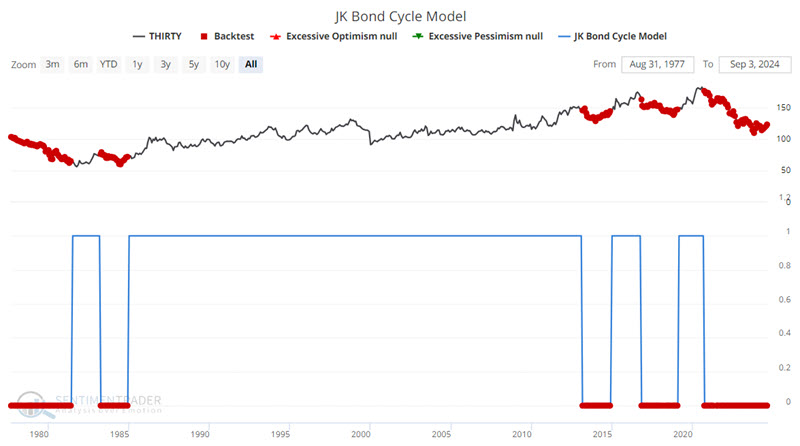
The table below summarizes THIRTY performance following previous zero readings for this model.
With the caveat that these models could be proven wrong at any given time, they stand objectively against the current bullish crescendo for the inevitability of higher bond prices.
Bond sentiment is highly bullish - which tends to be bearish
The chart below highlights with a red dot those weeks when the 10-week moving average of our 30-Year Optix indicator was above 80%.
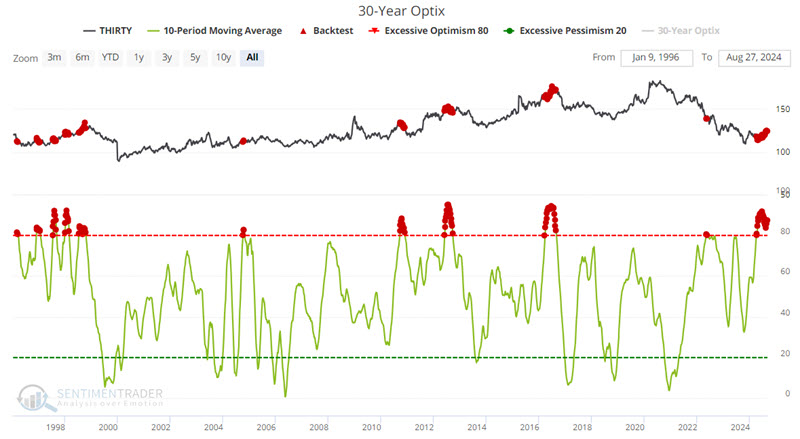
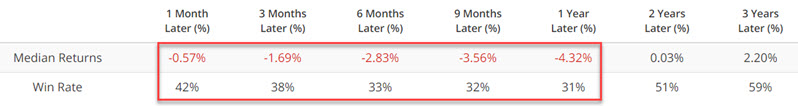
The table below summarizes THIRTY performance following the weeks highlighted in the chart above.
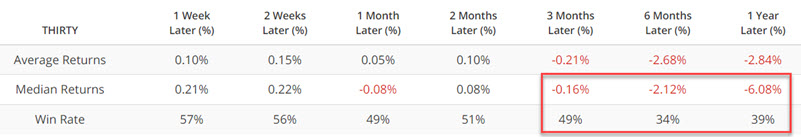
Once again, a history of subpar Win Rates (higher one year later only 39% of the time) does not guarantee a bond bear market in the year ahead. Still, this history stands in stark contrast to conventional wisdom.
Seasonality is now a headwind
The chart below displays the annual seasonal trend and average monthly results for 30-year t-bond futures.
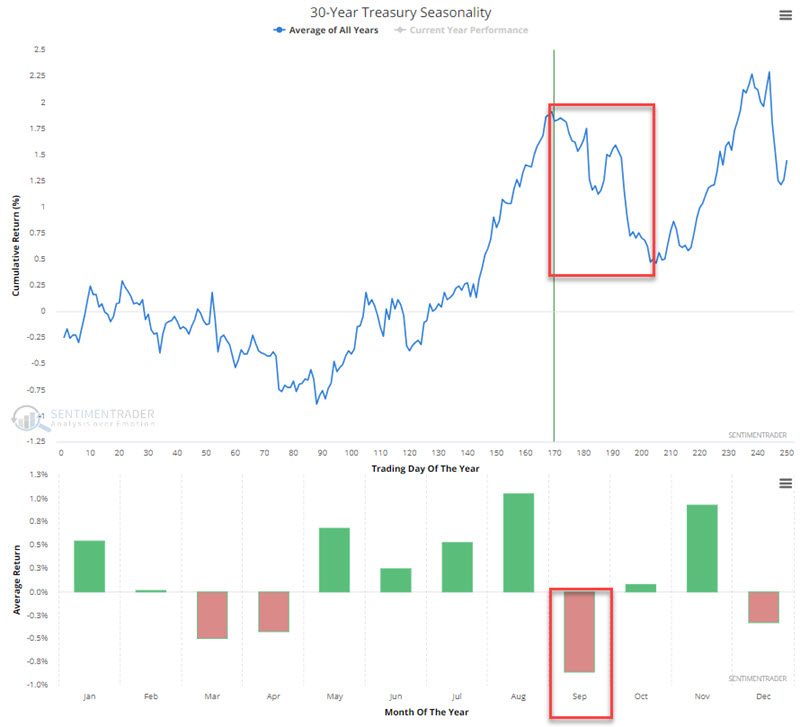
The implications are pretty obvious. We have entered one of the more unfavorable seasonal periods of the year, and September has historically seen the worst performance.
The chart below displays hypothetical growth of $1 invested in 30-year bonds only during the period highlighted in the red box in the top clip above. The results suggest early September is generally not the time to load up on long-term treasuries.
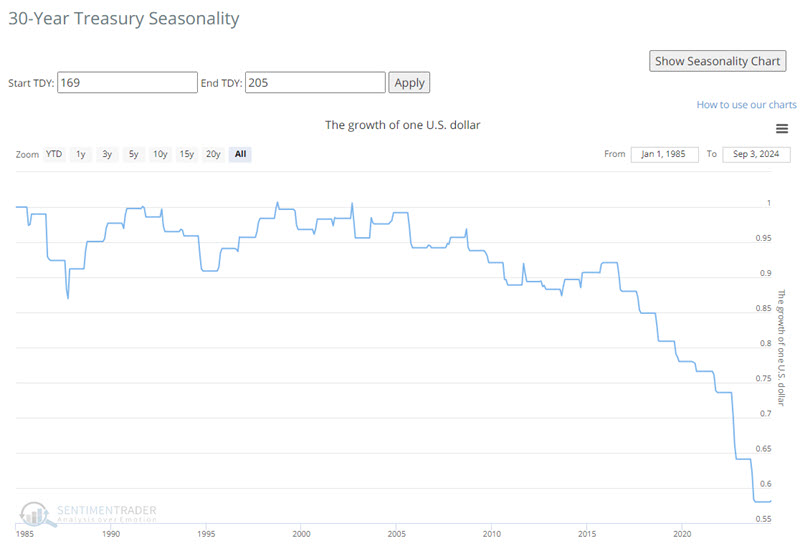
Seasonality is always the easiest to dismiss as a standalone tool since year-to-year results can vary widely. However, as part of a pattern of potential warning signs, the charts above offer another contrarian piece of evidence.
One more for the mix - the Copper/Gold Ratio
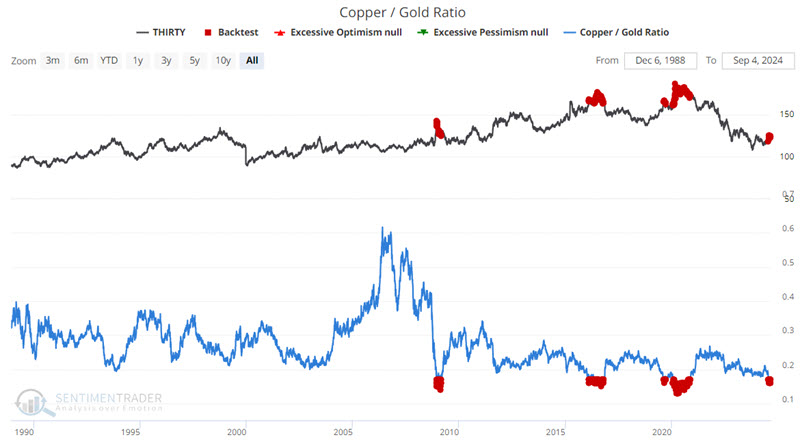
The chart below highlights all dates when the Copper/Gold Ratio is below 0.17. As you can see, this does not happen often (which admittedly leaves us with a relatively small sample size). But just eyeballing the chart below suggests that this has tended to occur as bond rallies were nearing a top.
The table below summarizes THIRTY performance following the dates highlighted in the chart above.
The results speak for themselves, albeit, again, based on a small sample size.
What the research tells us…
So, "the masses" appear convinced that interest rates are headed lower. Short-term interest rates may well be if the Fed acts as expected - and as the Fed has suggested, they will soon - by cutting short-term interest rates. However, an important side note: While the Fed has much control over short-term interest rates, it has limited ability to affect long-term rates. So, will the current bullish consensus we see in the bond market be proven wrong? As always, we cannot predict the future with any certainty. However, the information above suggests that there is a chance that those loading up on long-term treasuries might be disappointed and that for bond investors, short-term securities may be the place to be.