
The continuing case for technology

Key points
- Technology has rebounded hugely from its April low
- Oversold signals in April and current continuation signals suggest a favorable environment into 2026
- Insider buying and favorable seasonality suggest strong opportunities during the rest of 2025
The technology sector has been a wild ride
Talk about a comeback.
The technology sector topped out in February and was down 14% when tariff uncertainty hit the market in April. By the time the decline was over, the Technology Select Sector ETF (XLK) had shed 29%. Following the signals highlighted below, the sector then exploded higher; XLK has rallied over 50% since its low on April 11th.
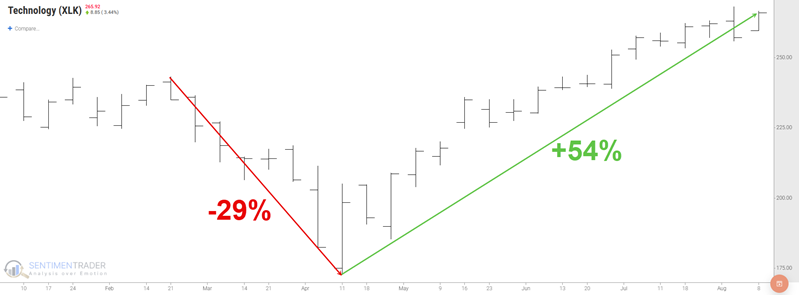
If XLK fails to take out its previous high of $268, a meaningful consolidation following a 54% gain in four months would come as no surprise. However, in the bigger picture, there are reasons to believe that - correction or no correction - technology could still have room to run.
Tech has rallied sharply following oversold signals
The magnitude of the post-tariff tantrum rally in tech is not surprising, given how oversold XLK became during the February to April selloff.
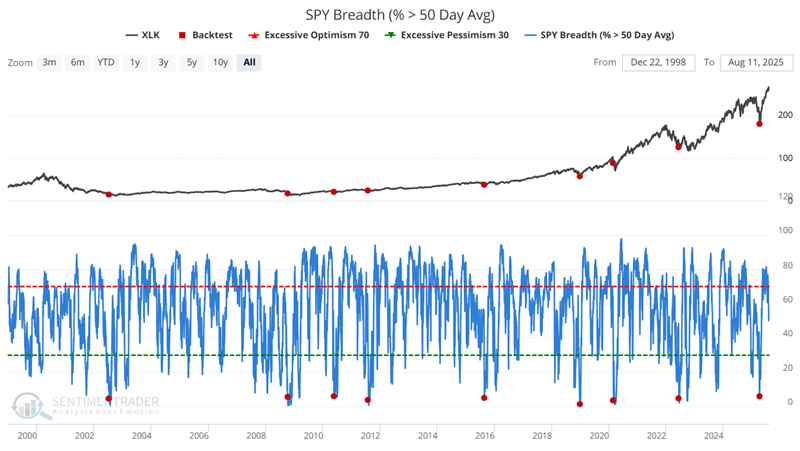
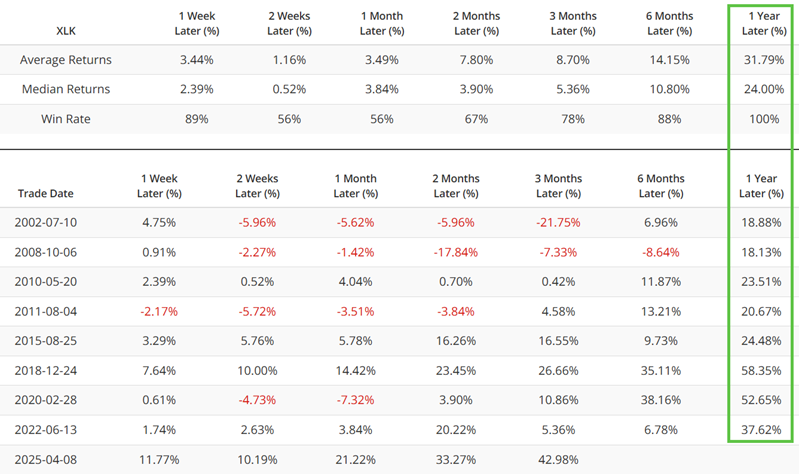
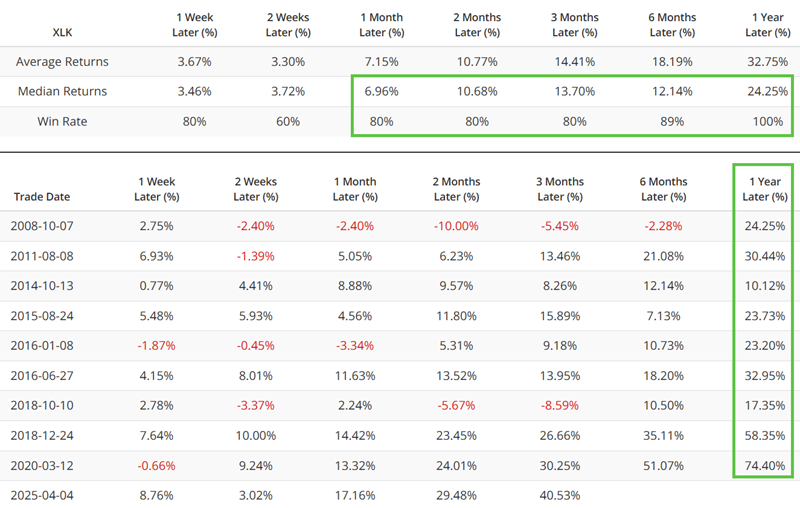
On April 8th, the SPY Breadth (% > 50 Day Avg) dropped below 6% for the first time in one year. The chart and table below display the performance of the SPDR S&P 500 Technology Sector ETF (XLK) following these signals. The good news is that all previous signals saw XLK rise over the next year, with a median gain of 24%. The bad news is that XLK has already rallied over 40% in the first three months since the latest signal.
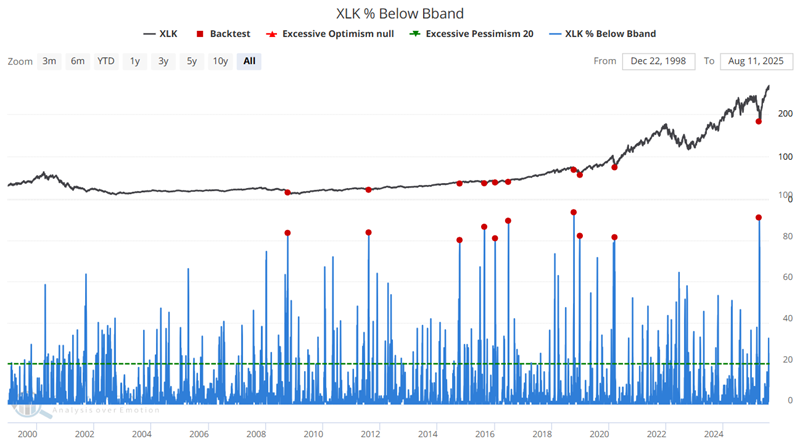
The XLK % Below Bband indicator shows the percentage of stocks in the sector index that are trading below their Bollinger Band. High readings imply an oversold situation ready for a rebound. XLK has bounced over 40% higher since the April 4th reading above 79%.
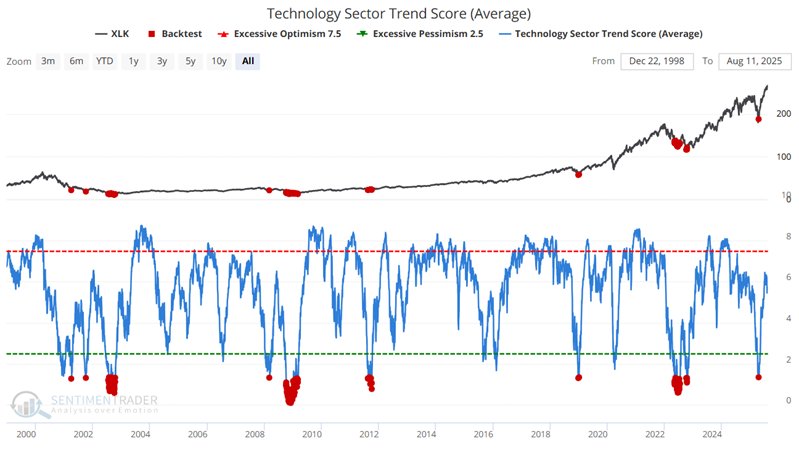
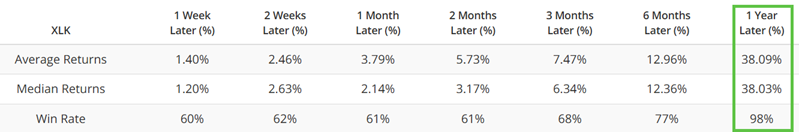
Another oversold sign pointing toward a sharp rebound occurred on April 21st, when the XLK Trend Score (Average) dropped below 1.35. Considering the history of the highlighted days, we find a median 1-year gain of 38% and a win rate of 98%.
Concerns regarding price consolidation are valid, particularly if the price fails to break out to a new high. However, various continuation signals suggest that now is not the time to exit the tech sector completely.
Continuation signals suggest the rally could continue
A continuation signal is a favorable signal that occurs after a price uptrend has already been established.
The XLK Component Correlation indicator tracks the degree to which stocks in the sector trade together. High readings tend to identify periods when investors are panicking and dumping stocks from a particular sector. The signals below mark each date when the XLK Component Correlation indicator crossed above 0.75 for the first time in six months.
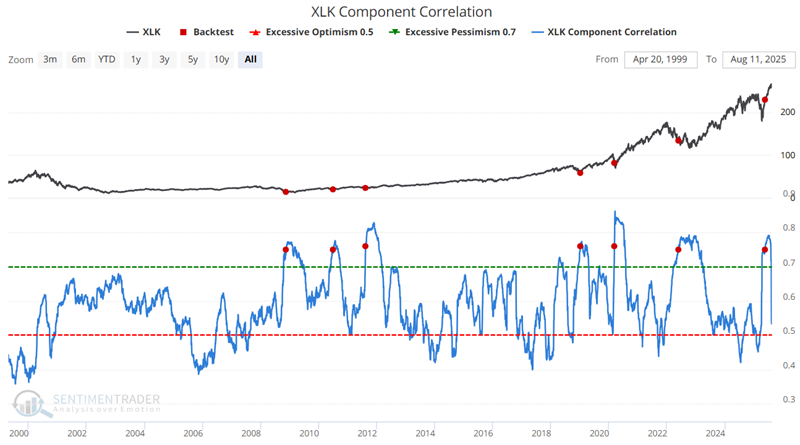
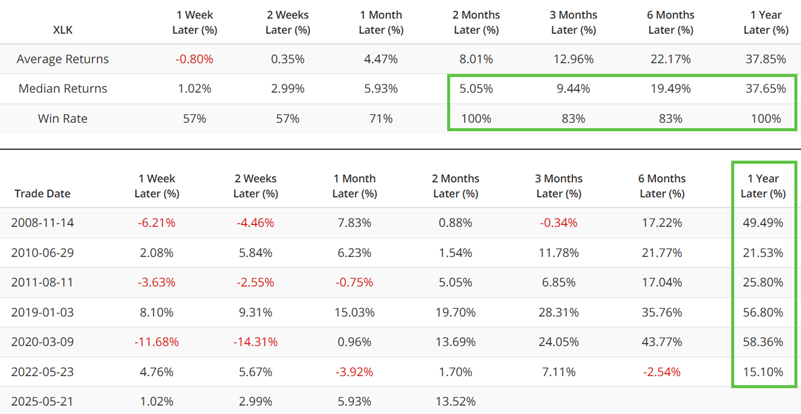
The most recent signal occurred on May 21st. XLK has been higher one year after all previous signals, with a median gain of 37%. XLK is 16% above its level on May 21st.
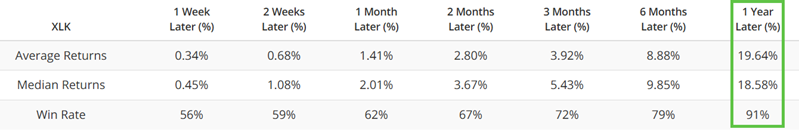
More potentially good news can be found in the fact that technology sector corporate insiders are showing faith in the rally with their own money. Corporate insider buying is not a precision market timing tool, as insiders sometimes are early with their buying. But when they keep buying, that is the surest sign that they expect even better days ahead. Technology sector insiders have been accumulating their shares since May 2025.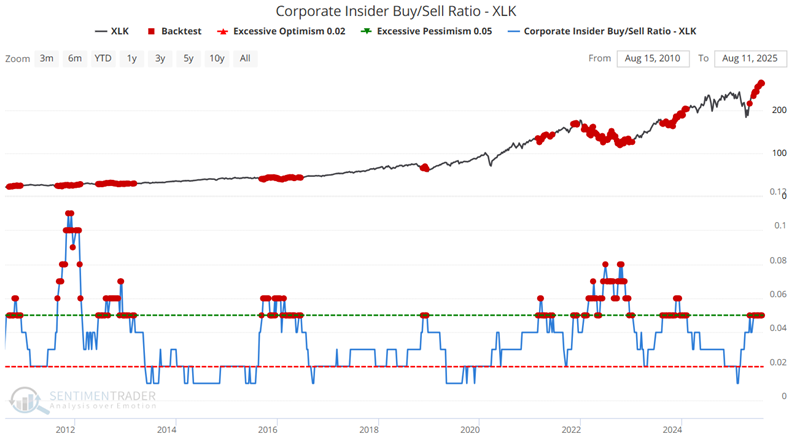
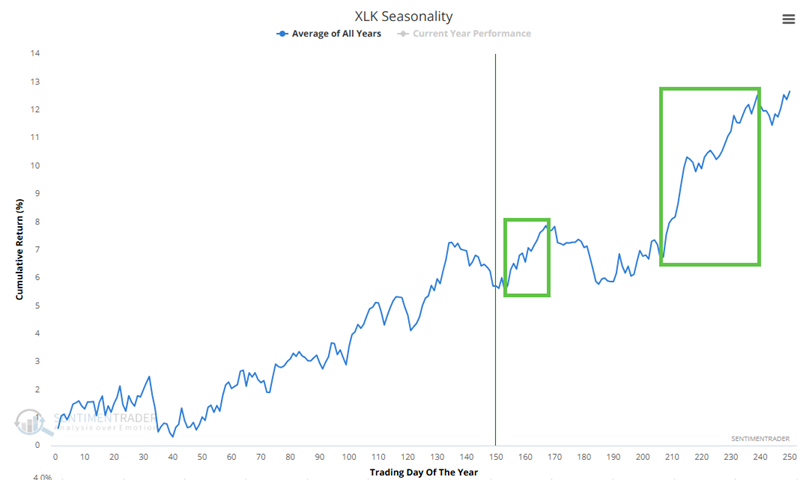
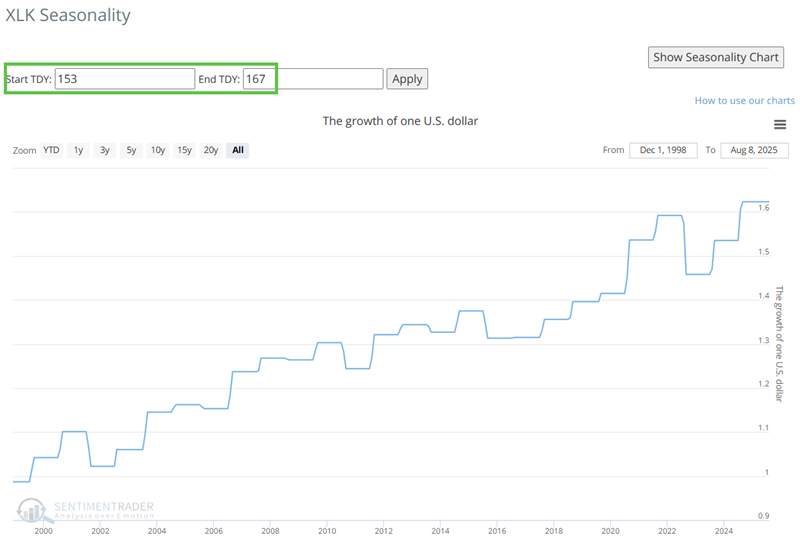
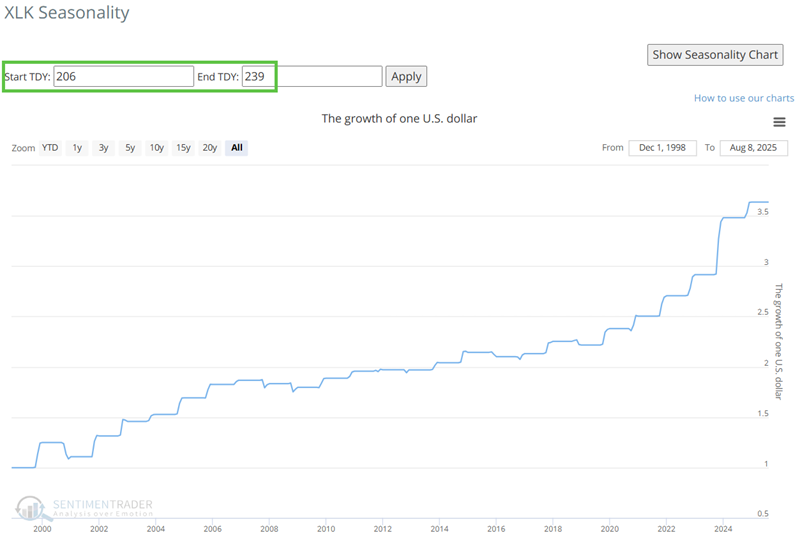
The last factor to touch on is seasonality. Ideally, we like to see seasonality and price action in agreement. As long as XLK price action remains strong, we look to the TDY (Trading Day of the Year) #153 to #167 (August 13th through September 3rd) and TDY #206 to #239 (October 28th through December 13th) periods as bullish trading opportunities for shorter-term traders.
What the research tells us
The oversold signals flashed in April alerted us that the tech sector was due for a serious rebound. The continuation signals from component correlation and insider buying strongly suggest that the rally has staying power. And favorable price action, combined with favorable seasonal periods in the months ahead, is essentially the "cherry on top" for investors. For most investors, the weight of the evidence suggests continuing to give the bullish case the benefit of the doubt.