
The Consumer Staples sector triggered a thrust signal

Key points:
- The Consumer Staples sector triggered a breadth composite net change thrust signal
- Similar thrusts produced excellent returns and win rates across all time frames
- Consumer Staples outperformed the S&P 500 and most sectors over the subsequent month
A surge in participation in a traditionally defensive sector
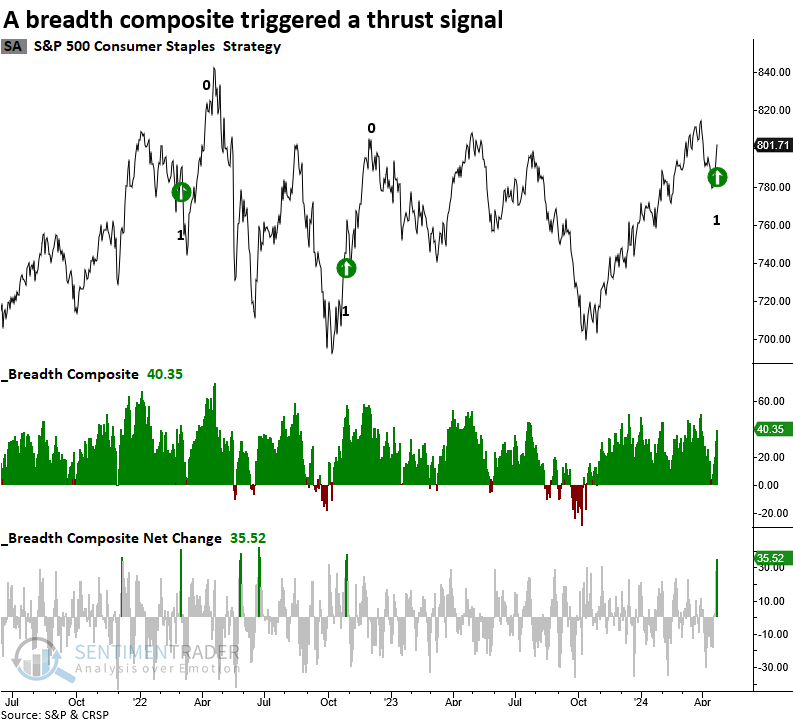
Despite initially tracking the downward trajectory of major indices like the S&P 500 in recent weeks, defensive sectors such as Consumer Staples and Utilities exhibited signs of resilience early last week. Starting Wednesday, they diverged from the broad market and turned up as the S&P 500 continued lower, eventually bottoming on Friday.
One of the sectors, Consumer Staples, triggered a thrust signal when the five-day net change for a breadth composite surged by 35%.
I usually avoid highlighting thrust signals for defensive sectors as they rarely provide a compelling outlook on an absolute or relative basis. However, this is one of the exceptions.
Similar thrusts preceded positive returns and favorable win rates
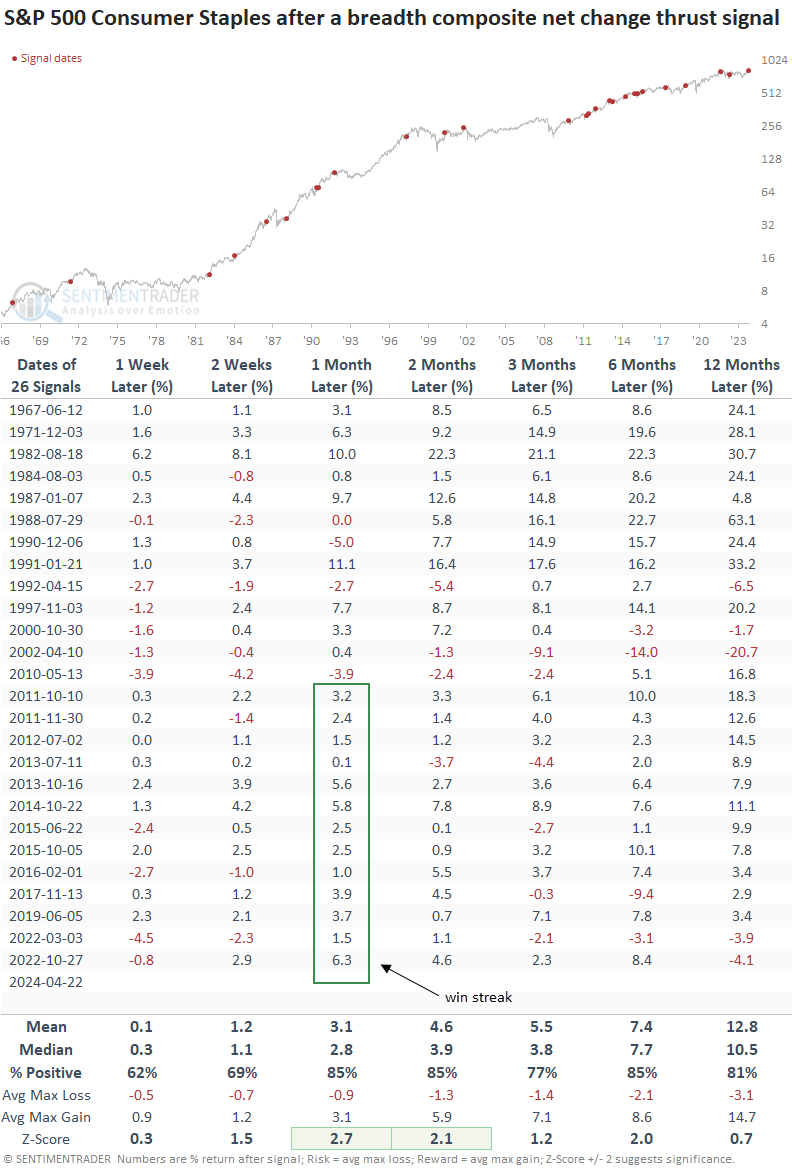
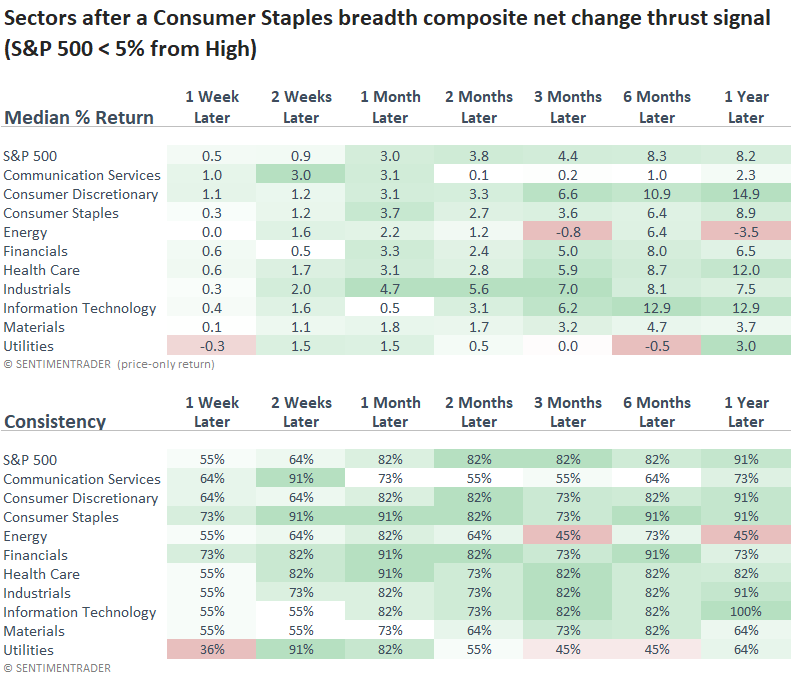
Following a breadth composite net change thrust signal, the Consumer staples sector exhibited excellent returns and win rates over all time horizons. That was especially the case over the following one and two-month periods, with both displaying 85% win rates and returns that were signficant relative to the study period.
Additionally, the one-month horizon has shown a gain for 13 consecutive signals.
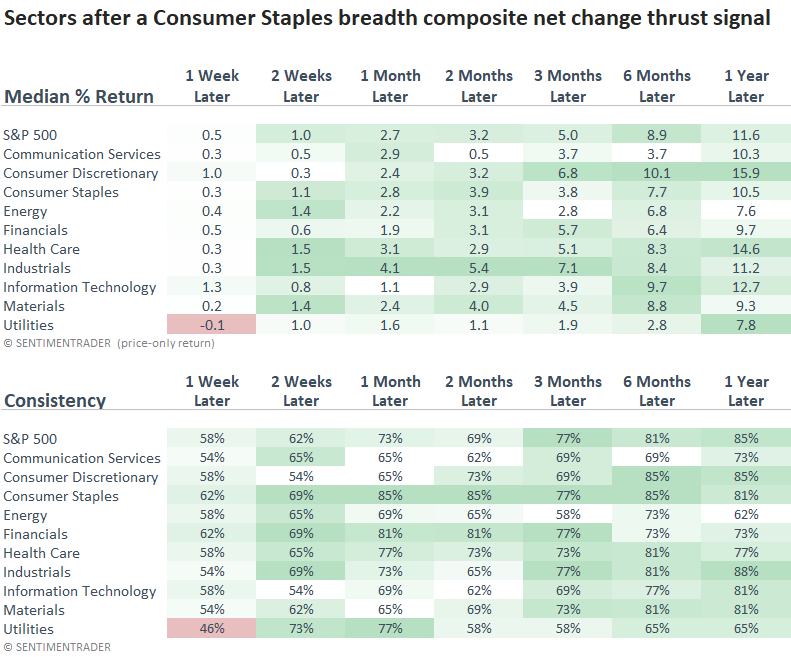
Over the subsequent one- and two-month horizons, the Staples sector outperformed the S&P 500. And in the two-month window, it ranked as the third-best-performing sector. Unsurprisingly, the traditionally defensive group lagged the world's most benchmarked index over long-term horizons.
Additional context
This most recent signal occurred with the S&P 500 down less than 5% from its recent high. When I isolated similar precedents, win rates improved across all but one horizon. While median returns improved in some cases, it's crucial to remember that these signals triggered near highs, where returns tend to be lower than instances coming out of significant corrections or bear markets.
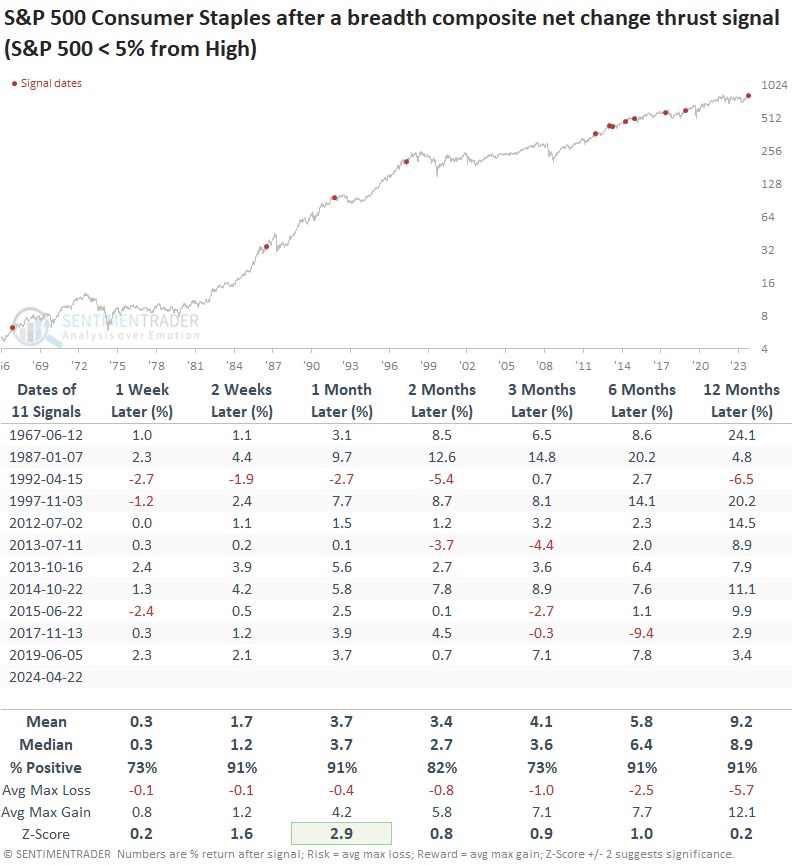
While the one-month horizon for Staples outperformed the S&P 500, the two-month window did not. Interestingly, a year later, the median return for the defensive sector exceeded the world's most benchmarked index.
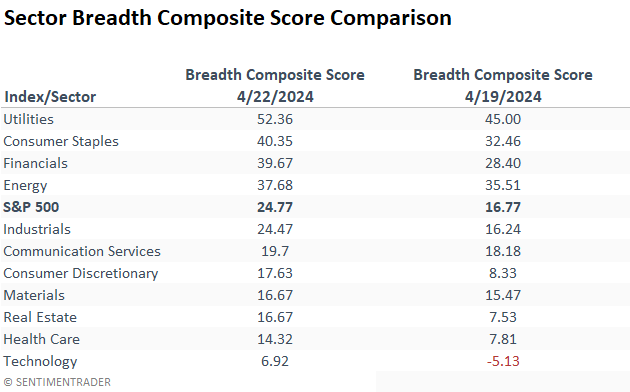
A fascinating market breadth backdrop
As of Monday, Utilities and Consumer Staples maintained the highest breadth composite scores. This is an intriguing scenario, given the persistent struggles of these sectors during the Fed's tightening cycle. Is this improvement signaling a shift in market sentiment regarding rates? Only time will tell.
What the research tells us...
Consumer Staples, a traditionally defensive sector, triggered a thrust signal when the 5-day net change for a breadth composite surged above 35%, indicating increased market participation. After similar alerts, the Staples sector tended to rally with remarkable consistency across all time horizons. Consistency was even better when precedents occurred, with the S&P 500 near a high. Despite Staples's defensive qualities, it displayed the ability to outperform the S&P 500 and several other sectors from one to two months later.