
The Consumer Discretionary sector suggests the bear market is over

Key points:
- The percentage of Consumer Discretionary stocks in a bear market cycled from > 89% to < 50%
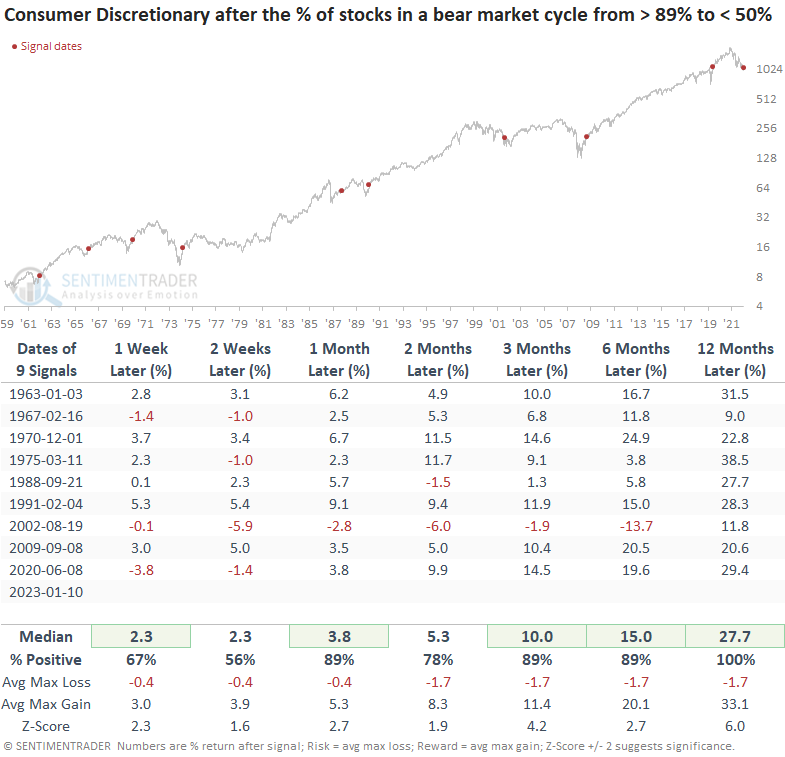
- After similar reversals, the Discretionary sector was higher 100% of the time a year later
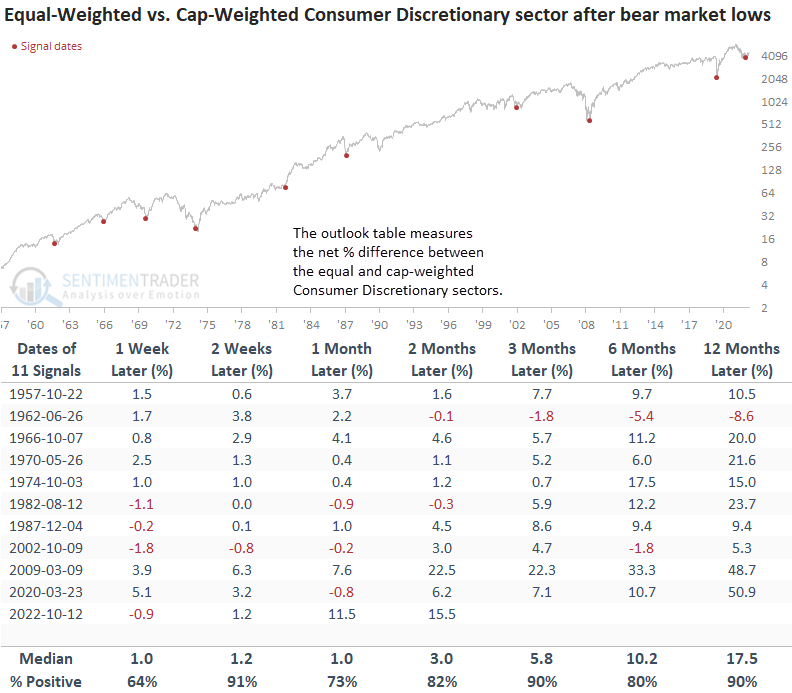
- With the recovery suggesting an end to the bear market, the equal-weighted Discretionary sector looks attractive
A significant recovery in an early cycle sector
The percentage of S&P 500 Consumer Discretionary stocks in a bear market cycled from > 89% to < 50% for the 10th time in more than 70 years.
The improvement in Discretionary stocks is a significant development in the debate around whether the broad market has formed a bear market bottom, as the signal has marked an end to significant drawdowns in all but one case. So, the recovery bodes well for the bulls.
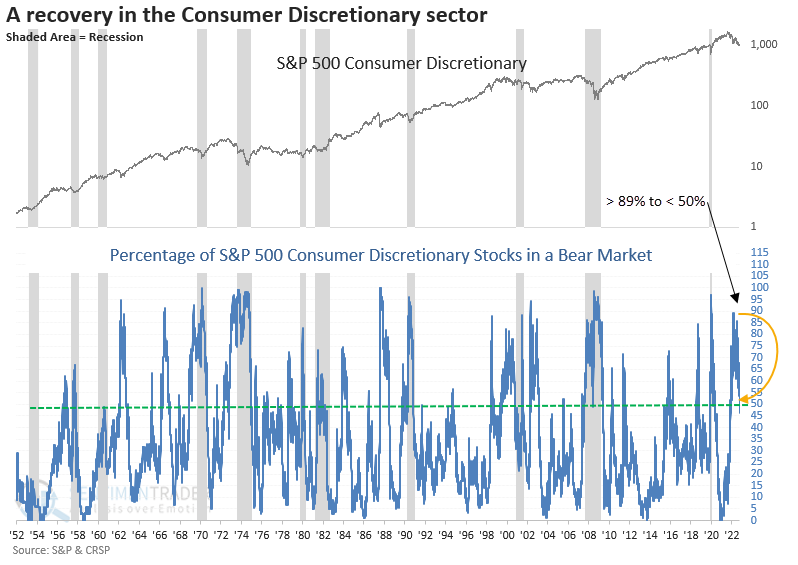
On two occasions, the percentage reached the mid to high 80s range but did not exceed 89%. Both of those instances crossed below 50% on countertrend rallies, which would have led to significant drawdowns and lower lows. And readings above 85% have typically been associated with a recession. However, 1962, 1966, and 1987 were the exceptions.
Similar reversals preceded a 100% win rate over the following year
When the percentage of Consumer Discretionary stocks in a bear market cycle from > 89% to < 50%, the Consumer Discretionary sector performed extremely well over the next year. The signal was triggered a few months early in 2002, which is unsurprising as the sector can exhibit strength before a broad market bottom.
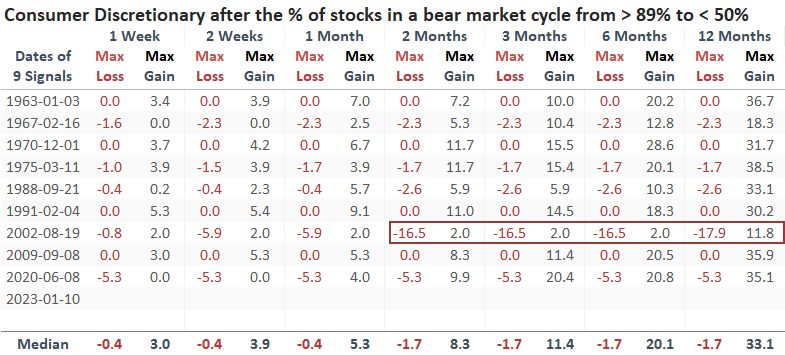
The signal shows only one unfavorable max loss to max gain profile in the two to the twelve-month range.
One option for exposure to the Discretionary sector if the bear market is over
With the advent of ETFs, it's now more accessible and cheaper than ever to allocate to a basket of stocks to take advantage of historical trends. Suppose the recovery in consumer discretionary stocks signals that the bear market is over. In that case, one might consider a position in the equal-weighted discretionary ETF (RCD) versus the cap-weighted discretionary ETF (XLY).
After bear market bottoms, the equal-weighted Consumer Discretionary sector consistently outperforms the cap-weighted version.
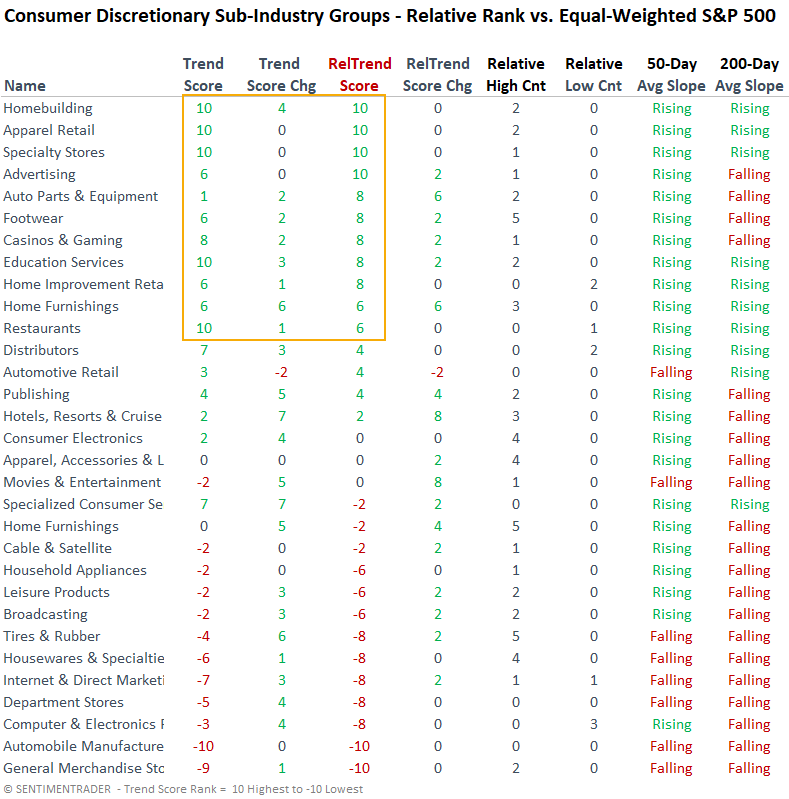
Several sub-industry groups within the Consumer Discretionary sector look excellent
Trends for sub-industry groups within the Consumer Discretionary sector continue to strengthen, with over 54% of the components exhibiting a positive absolute trend score. And several groups have a rising 200-day average, indicating a long-term uptrend. From a relative trend score perspective, four groups now have a perfect score versus the equal-weighted S&P 500.
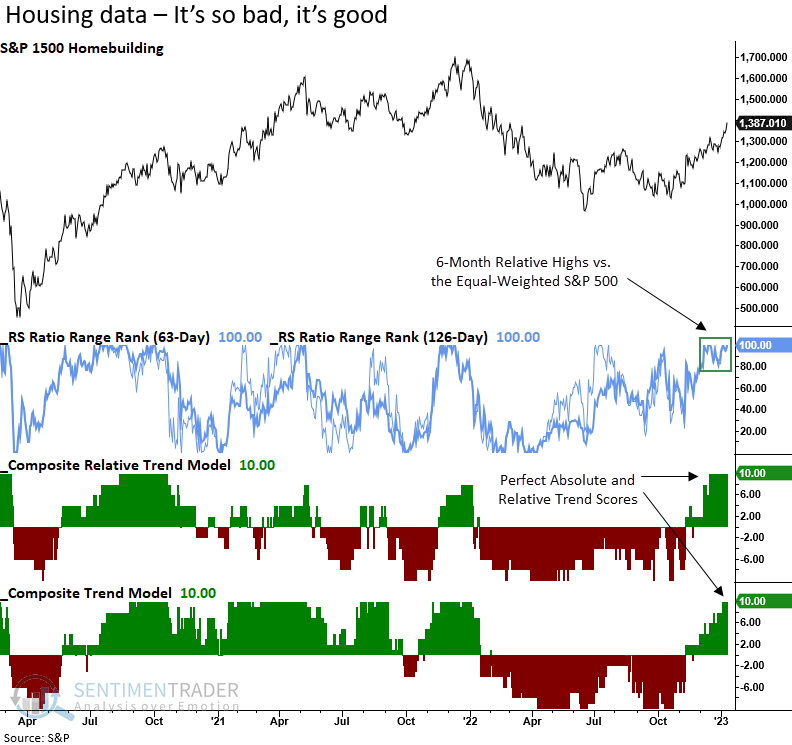
A chart is worth a thousand words
When stocks rally in the face of negative news, it typically suggests an environment that has discounted all the bad news.
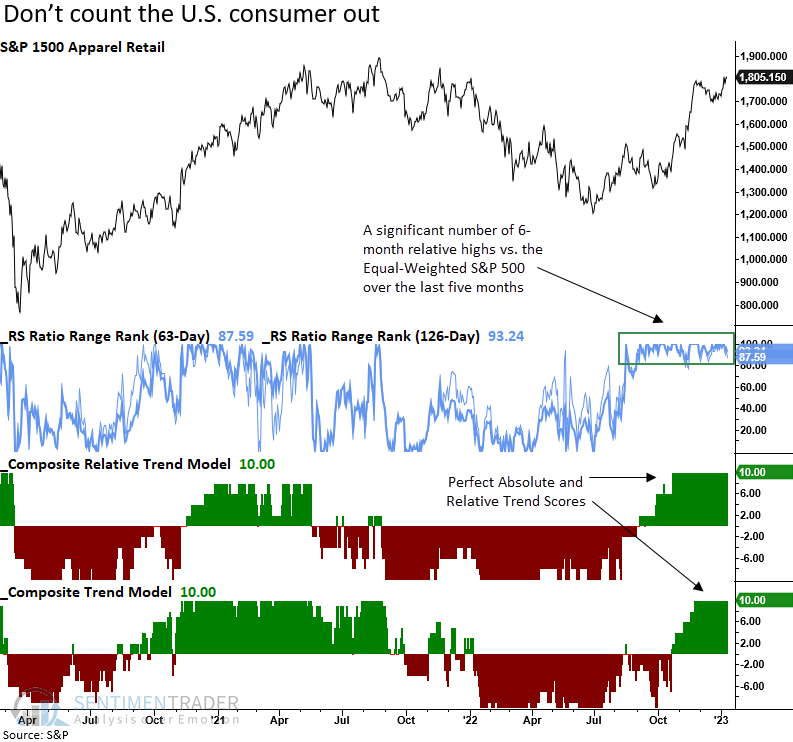
The apparel retail sub-industry group continues to exhibit excellent absolute and relative trend scores.
What the research tells us...
When the percentage of Consumer Discretionary stocks in a bear market cycles from > 89% to < 50%, the recovery in a crucial early cycle sector bodes well for consumer cyclical stocks and the broad market. The signal marked the end of bear markets in all but one case. One option to play a continuation of the recovery in the group would be an allocation to the equal-weighted Consumer Discretionary ETF (RCD), which typically outperforms the cap-weighted version after bear markets. Otherwise, one could use relative strength indicators to identify individual groups or stocks outperforming the broad market.