
The Composite Combined Thrust and Confirmation Model Triggers a Buy Signal

Key points
- The S-TCTM Composite Combined Thrust and Confirmation Model-a sophisticated weight-of-the-evidence system utilizing ten core sub-signals-triggered a new high-conviction buy alert on April 29, 2026.
- Since 1962, this composite model has generated 67 alerts, consistently displaying a massive long-term bullish edge with win rates typically exceeding 70% across the 1-to-12-month forward windows.
- Following these thrust signals, the magnitude and frequency of maximum gains significantly eclipse severe drawdowns, creating an environment where cyclical sectors heavily outperform defensive proxies.
Composite models use a weight of the evidence approach
Identifying the primary market trend is one of the most critical tasks for any trader or investor. The Tactical Composite Trend Model (TCTM) is the culmination of decades of professional trading and financial market research, designed to aid in this process. The S-TCTM utilizes a weight-of-the-evidence approach, combining seven key time-tested components to identify major market turning points.
For live updates on the S-TCTM website, please click here.

The following analysis utilizes a Composite Combined Thrust and Confirmation Model that includes ten measures for identifying extreme momentum through internal and external participation.
The Composite Combined Thrust and Confirmation Model represents an intelligent reconstruction of the existing pool of thrust and confirmation signals. We utilized artificial intelligence algorithms to weigh and optimize across multiple dimensions-win rate, expected return, and signal trigger frequency. Ultimately, we selected ten core sub-signals to construct this new analytical system.
(For detailed introductions to the foundational models, please refer to the background materials on The Composite Thrust Model and The Composite Confirmation Model: [1][2][3][4].)
Component Descriptions
- ISM Liquidity Signals
- 2 Day Vol Ratio
- Rate of change Thrust
- Percent of issues Overbought Spike
- Moving Average Bearish to Bullish Reversal Streak
- Percent of issues above 10-Day Reversal
- OECD LEI Signal
- Surge Volume
- 2/3 Vol Ratio
- Composite Trend Model
Composite Combined Thrust and Confirmation Model Signal Criteria
- Condition = Composite Signal Count >= 30%.
Current Day Chart
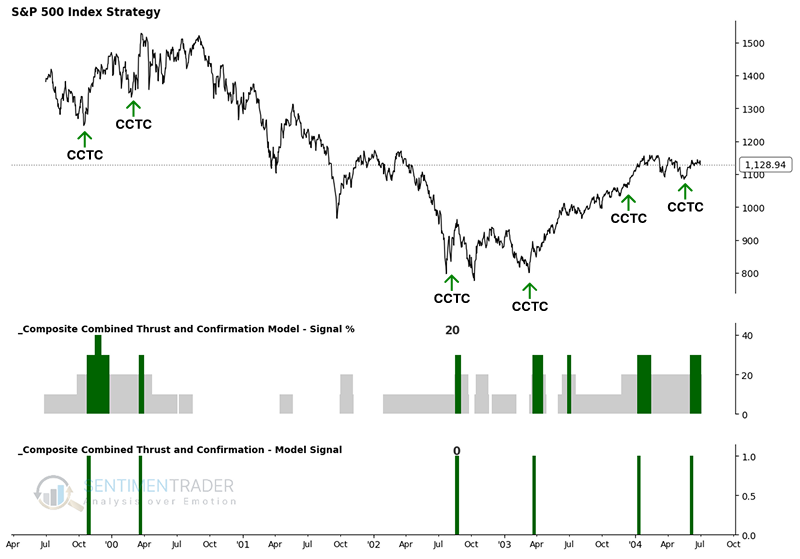
As the chart below illustrates, these individual components are combined into a single composite indicator-the Composite Combined Thrust and Confirmation Model-which uses a 0 or 1 value to issue alerts. The most recent signal triggered on April 29, 2026.
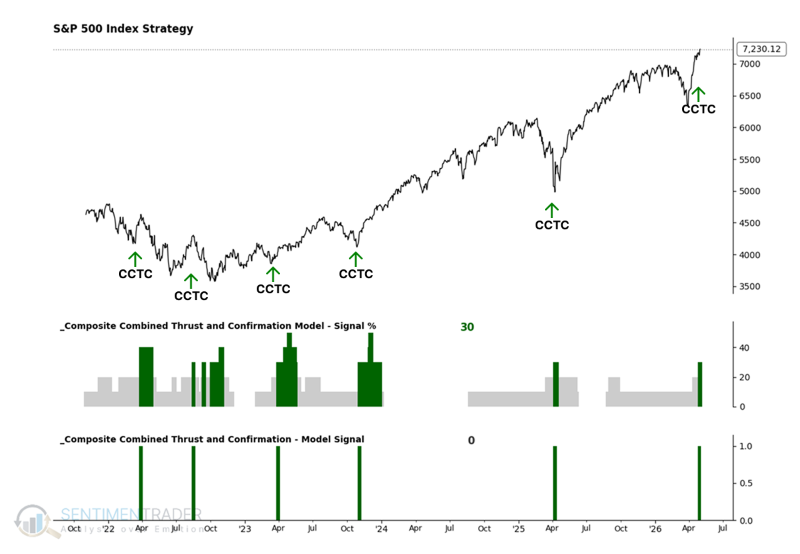
Let's take a look at some charts and the historical signal performance.
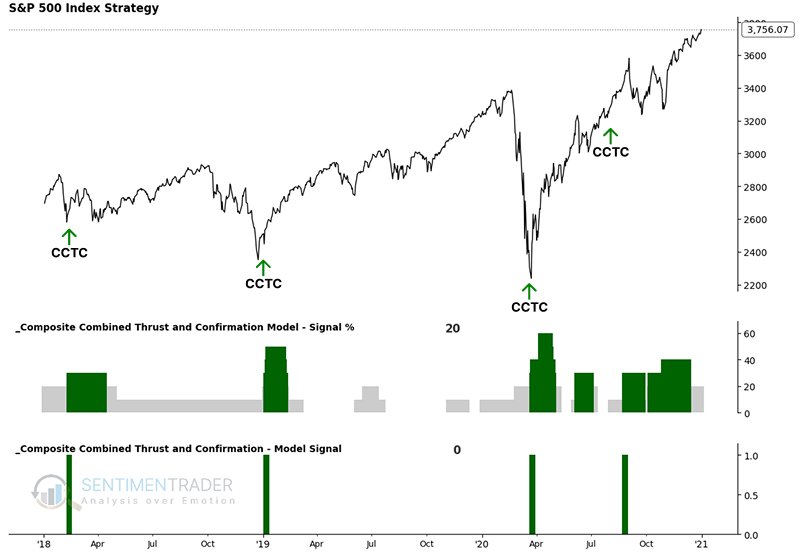
2018-2020 Market
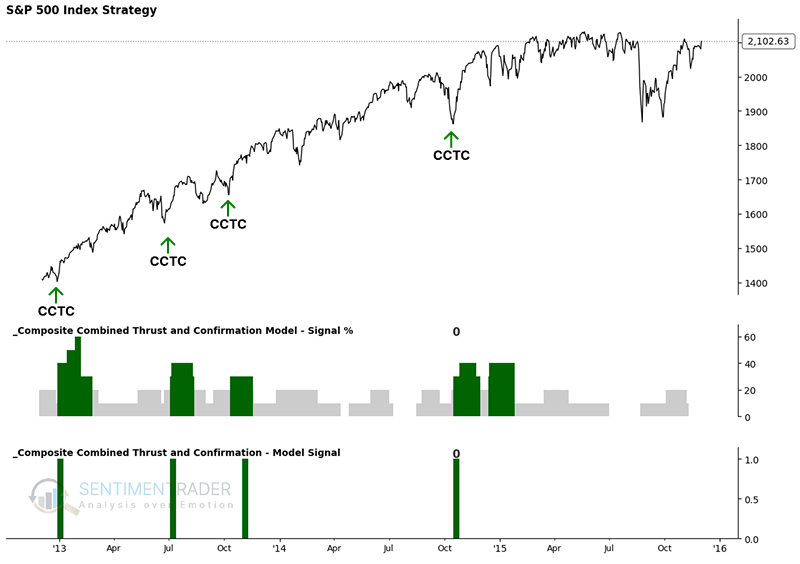
2013-2015 Market
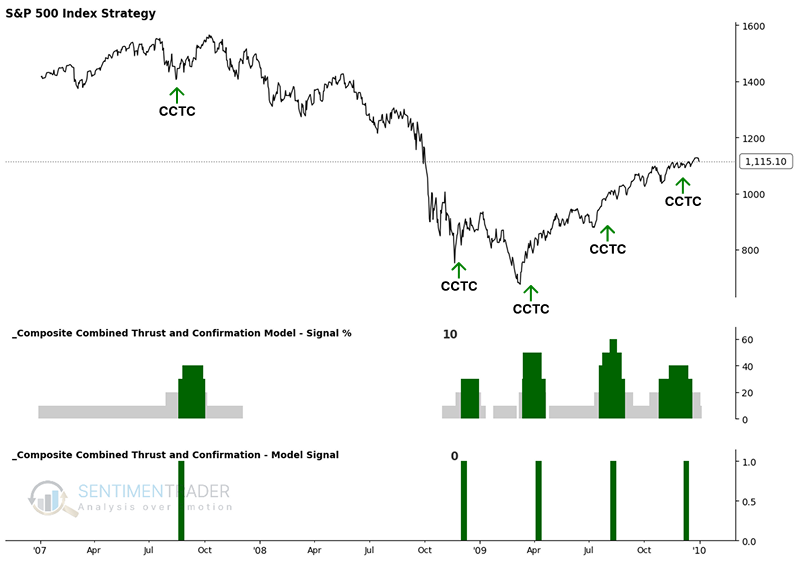
2007-2008 Market
2000-2002 Market
Similar Signals Point to Underlying Market Strength
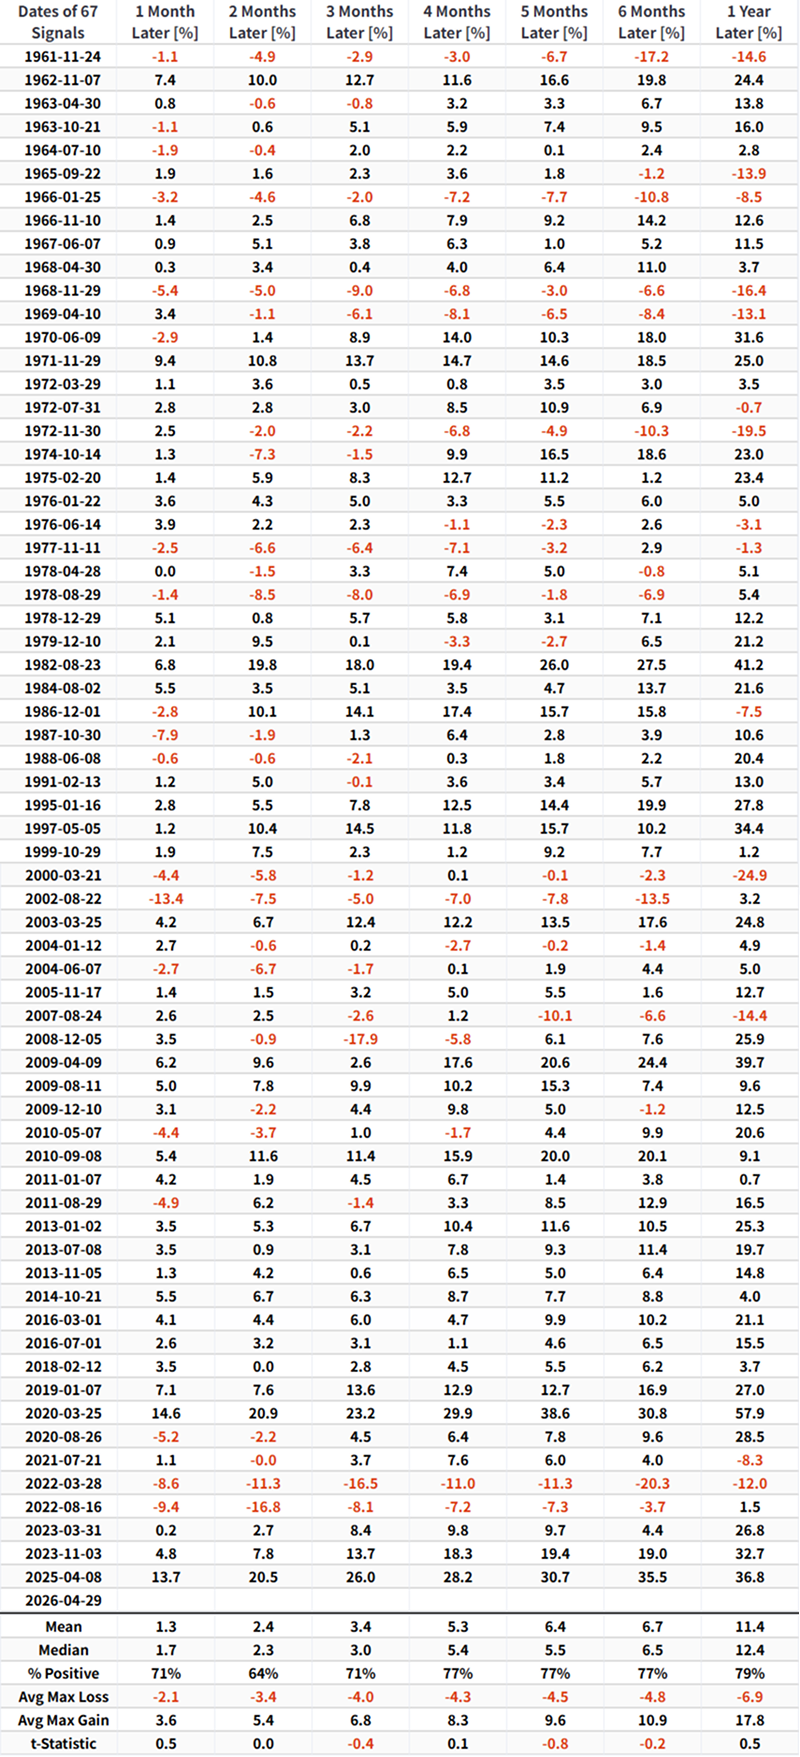
As you can see, this model has issued 67 alerts since 1962. The S-TCTM Composite Combined Thrust and Confirmation Model aggregates the most effective thrust and confirmation metrics, aiming to identify high-conviction market turning points. As the table below illustrates, this signal exhibits a significant long-term bullish edge. Across all observation windows (from 1 to 12 months), the signal maintains high win rates (typically exceeding 70%) alongside steadily compounding average returns. For the related backtest, please click here.
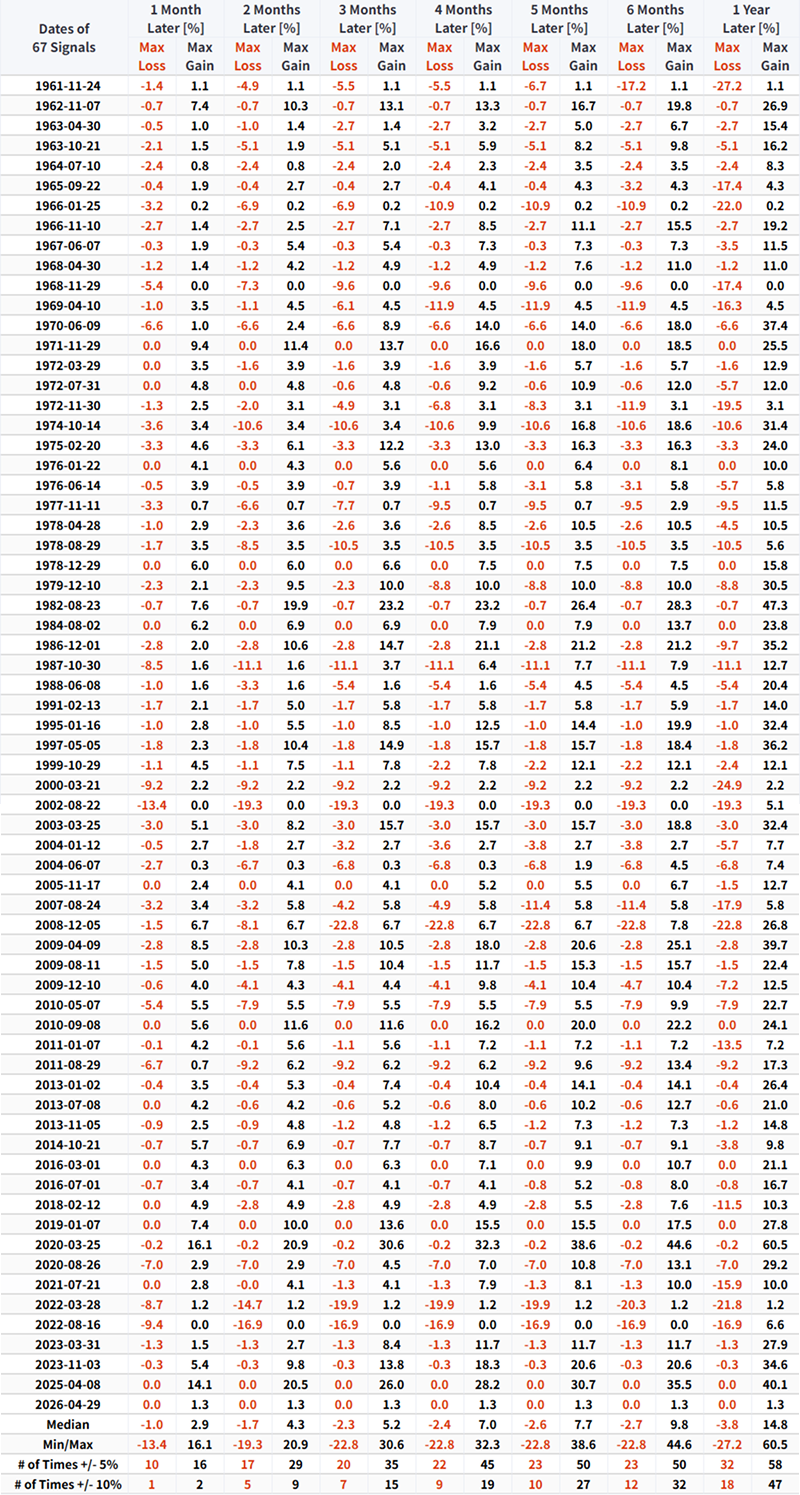
Following this alert, the magnitude of maximum gains significantly eclipses maximum drawdowns across all timeframes. Furthermore, the frequency of massive runs exceeding 10% drastically outpaces the occurrence of severe market corrections.
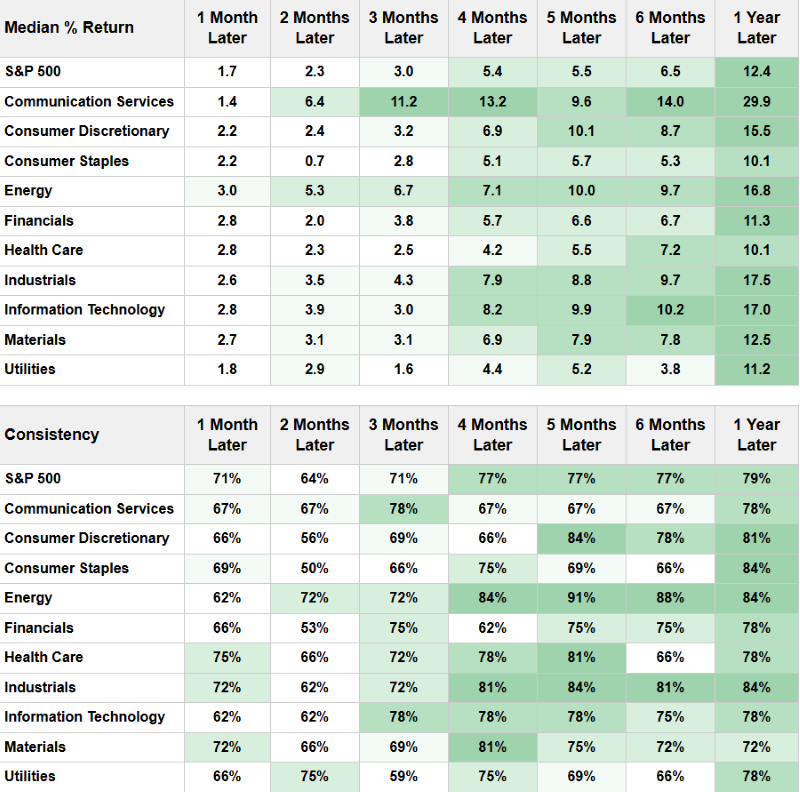
Given the robust broad market outlook following this signal, it is no surprise that cyclical sectors tend to rally and systematically outperform their defensive counterparts.
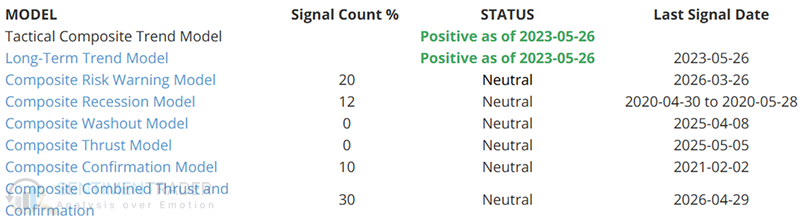
Tactical Composite Trend Model - Cautious Bull
With the new composite combined thrust and confirmation model signal, the S-TCTM status changes to a cautious bull outlook.
What the research tells us...
With a fresh buy signal triggering on April 29, 2026, the historical data suggests an bullish setup for equities over the next year. Because maximum upside gains heavily skew the risk/reward profile in favor of the bulls, momentum investors should view this as a high-conviction opportunity to maintain broad market exposure, specifically leaning into cyclical leadership over defensive names.
A confluence of bullish signals points to a highly constructive outlook for the S&P 500, suggesting investors can treat any near-term pullbacks as tactical entry points. However, given the unique macroeconomic backdrop of the current cycle, we must caution that price action remains susceptible to abrupt and unexpected reversals