
The commodities conundrum

Key points
- One prominent long-term cycle suggests that commodities will vastly outperform in the years ahead, but investors face a conundrum
- The recent action of our Macro Index Model portends favorable action for commodities in the year ahead
- Conversely, Hedge Fund Exposure to Gold can act as a leading indicator for commodities and energies, grains and softs have historically shown weakness following a signal from hedge fund exposure to gold
- Silver is one market that tends to show particular weakness following both signals
Commodities in a favorable long-term cycle
A 30-year cycle in commodity prices entered a favorable 15-year period. As I wrote about here, here, here, and here, the potential for substantial gains in commodities - both on an absolute basis and relative to stocks - appears high in the years ahead. This can create enormous opportunities for commodity traders. Also, thanks to the advent of commodity-based ETFs, investors may also stand to benefit from allocating a portion of their portfolio to commodities as an asset class, particularly if the stock market struggles.
At any given point, traders must pay close attention to price action and other indicators that might confirm or deny an overall bullish trend. This is tricky at the moment, as commodity price action is very mixed, and - as we will see in a moment, some typically reliable indicators are sending decidedly mixed signals.
The Macro Index Model flashes a favorable signal for commodities… but Hedge Fund Exposure to Gold does the opposite
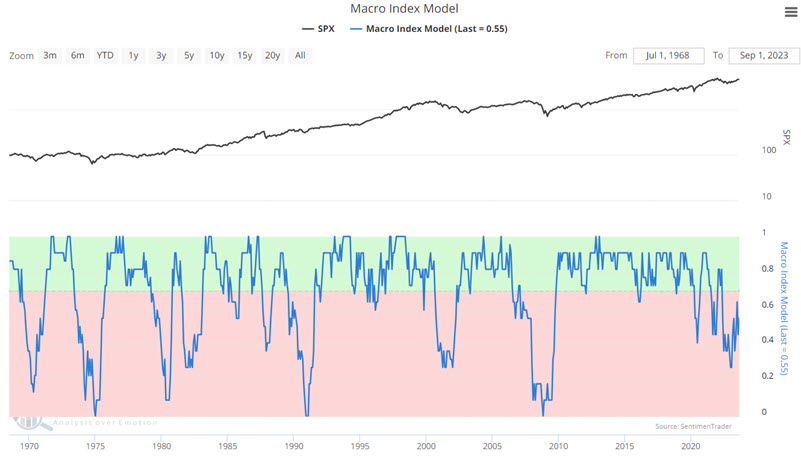
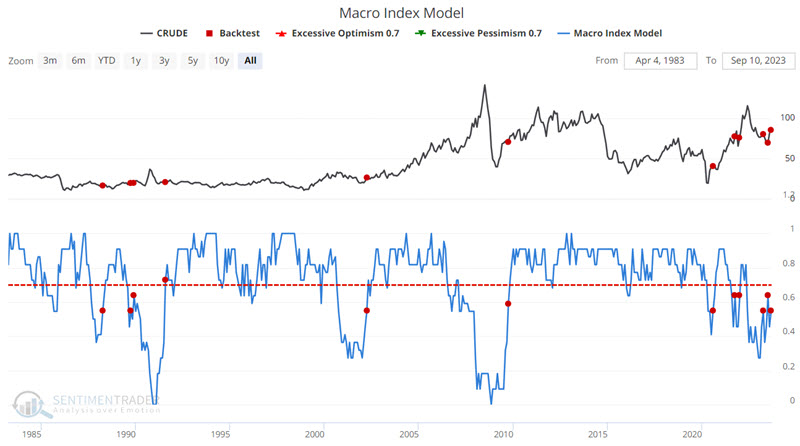
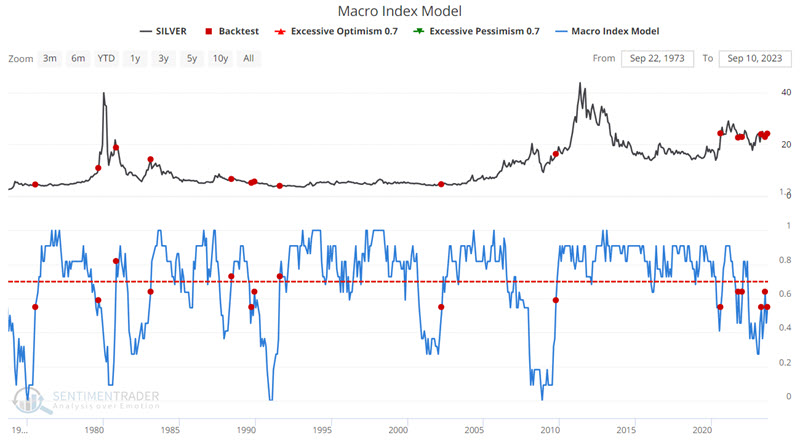
The chart below displays our Macro Index Model. After the monthly reading crosses above 0.50, commodities as an asset class tend to perform well.
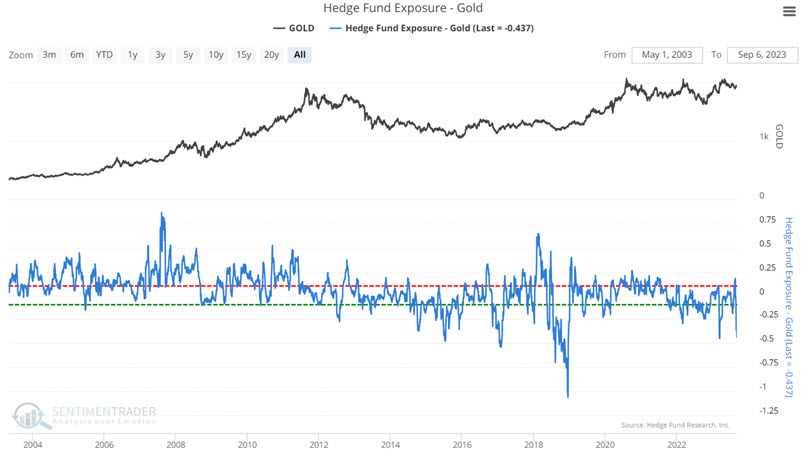
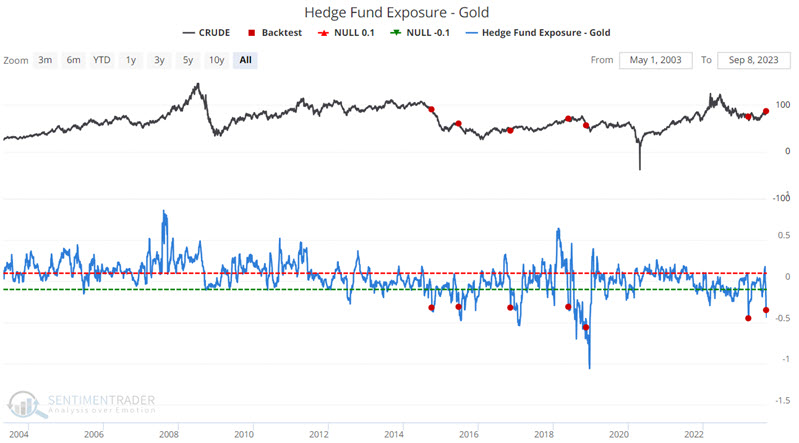
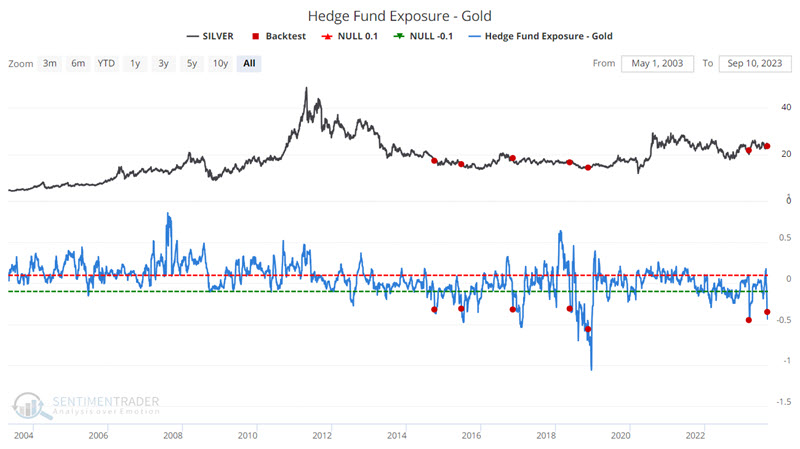
The following chart displays our Hedge Fund Exposure - Gold indicator. Commodities as an asset class tend to perform poorly when this indicator is below -0.30 for the first time in six months.
These two indicators just flashed essentially diametrically opposed signals - hence the "commodity conundrum." Rather than picking a side, we will merely present the information and allow traders and investors to decide what to make of it (with a straightforward suggestion at the end).
Indicators versus commodities as an asset class
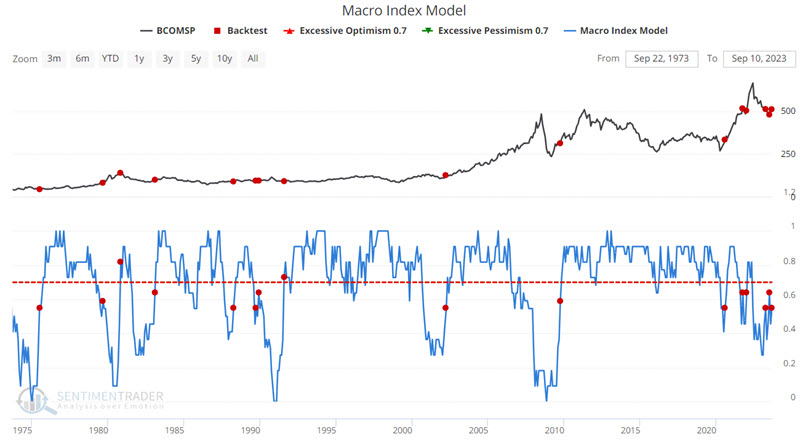
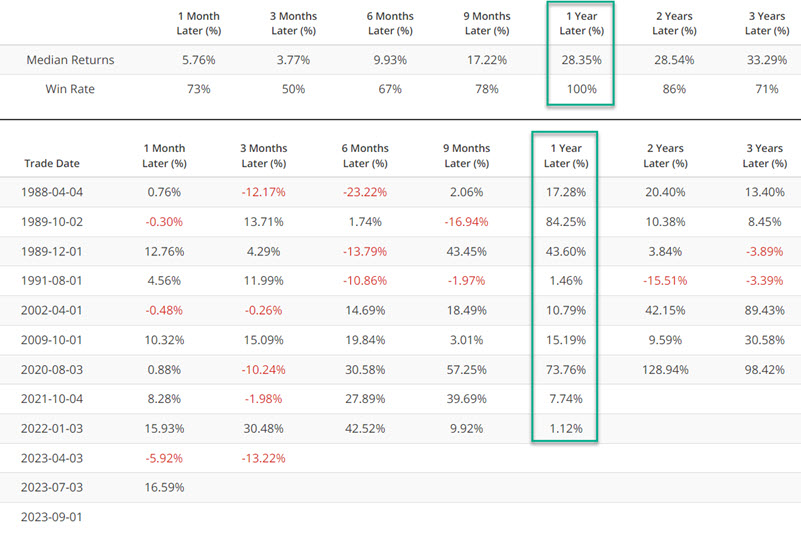
The Bloomberg Commodity Spot Price Index (BCOMSP) tracks a basket of commodities. The chart and table below display BCOMSP performance after the Macro Index Model crossed above 0.50.
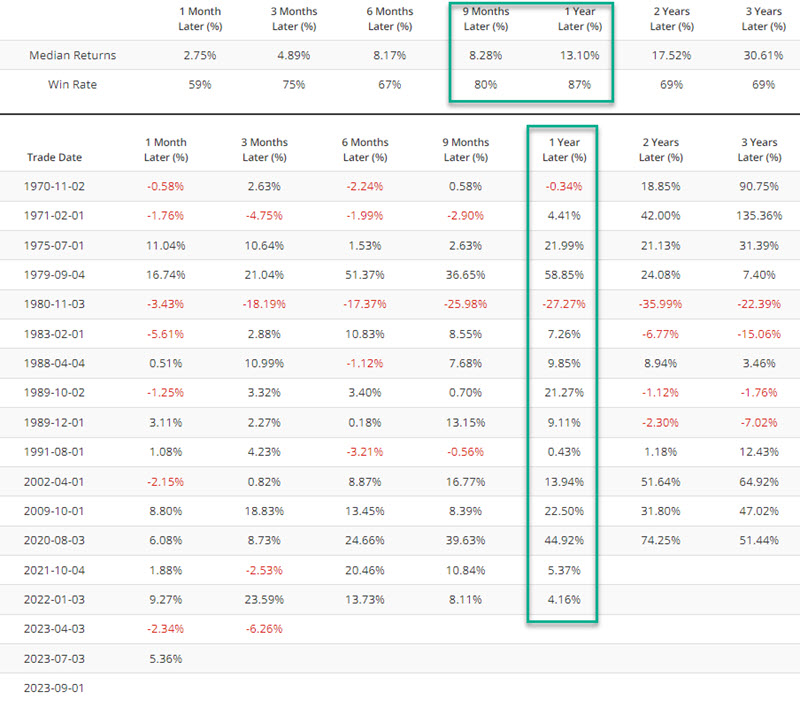
Commodity performance one year later tends to be quite positive. That's the good news. The bad news appears in the chart and tables below, which displays BCOMSP performance when the Hedge Fund Exposure - Gold indicator was below -0.3 for the first time in six months.
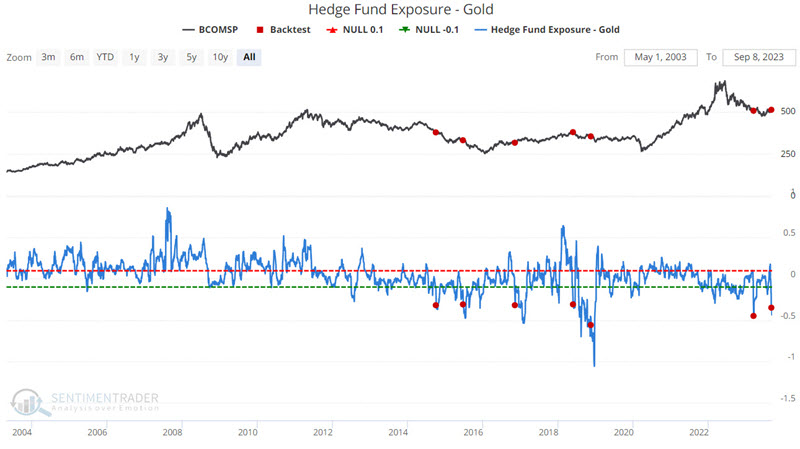
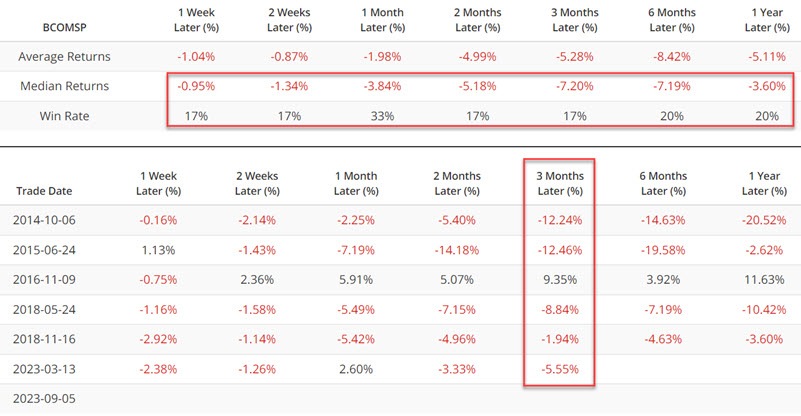
Except for the 2016 signal, results skew heavily to the negative side for twelve months after a signal.
Crude oil poses even more of a conundrum
As if the performance of commodities as an asset class based on our two indicators is not vexing enough, crude oil specifically goes even a step further. The chart and table below display crude oil performance after the Macro Index Model crossed above 0.50.
1 Year returns look pretty great. Still, the chart and table below display crude oil performance after the Hedge Fund Exposure - Gold indicator was below -0.3 for the first time in six months.
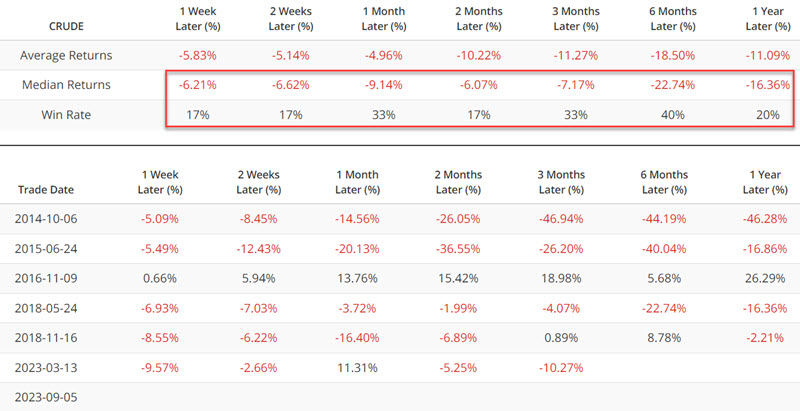
Once again, we see almost diametrically opposed results, leaving traders to answer the question, "Which one to believe?"
It's more of the same with Soybeans
It's more of the same in the grain markets. The chart and table below display soybean performance after the Macro Index Model crossed above 0.50.
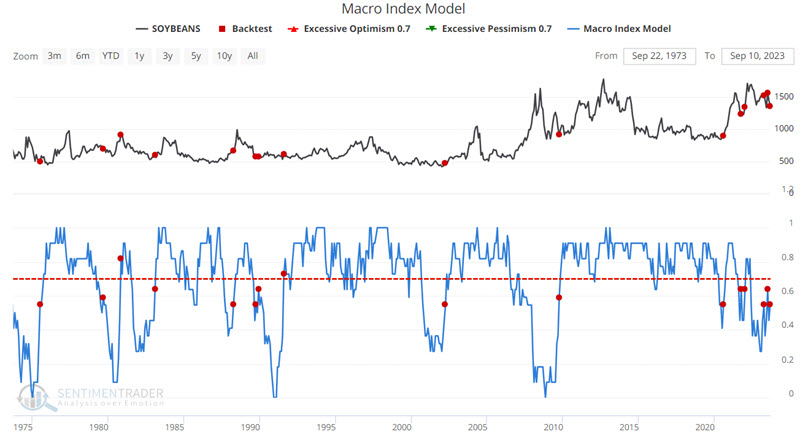
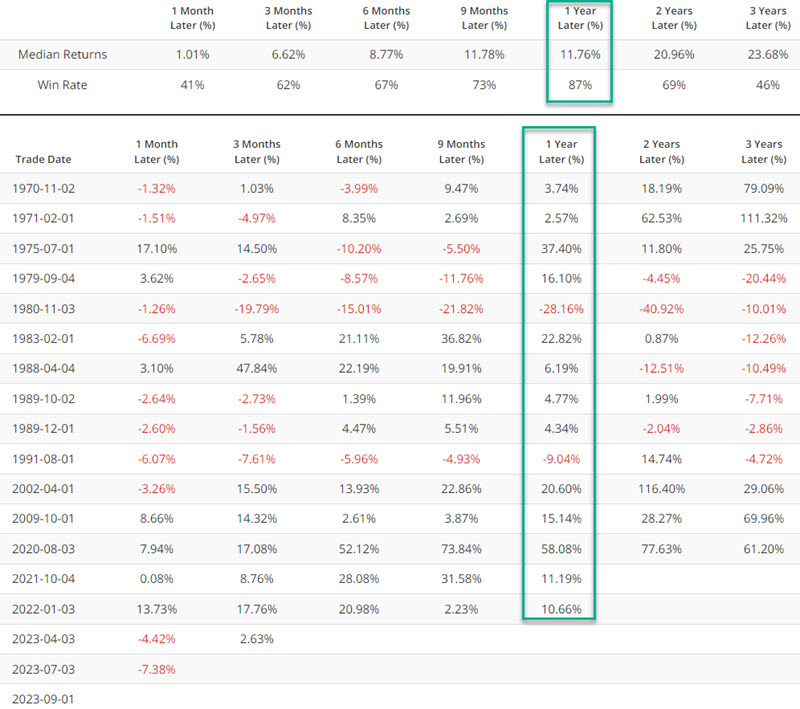
Very positive results are common during the 12 months following a signal. On the other hand, soybean performance after the Hedge Fund Exposure - Gold indicator was below -0.3 for the first time in six months.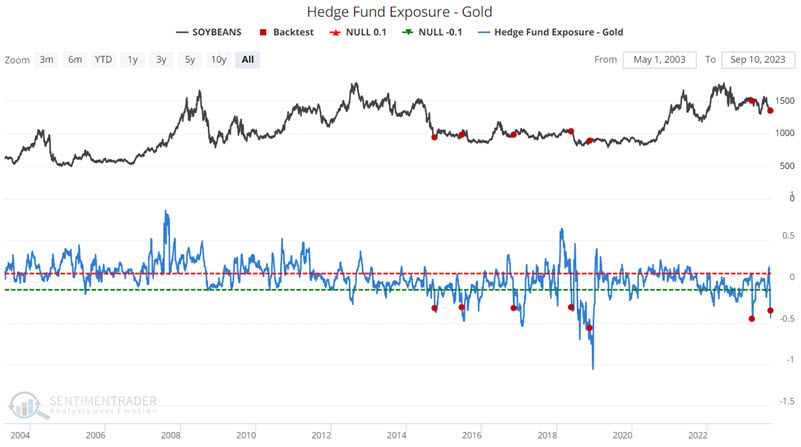
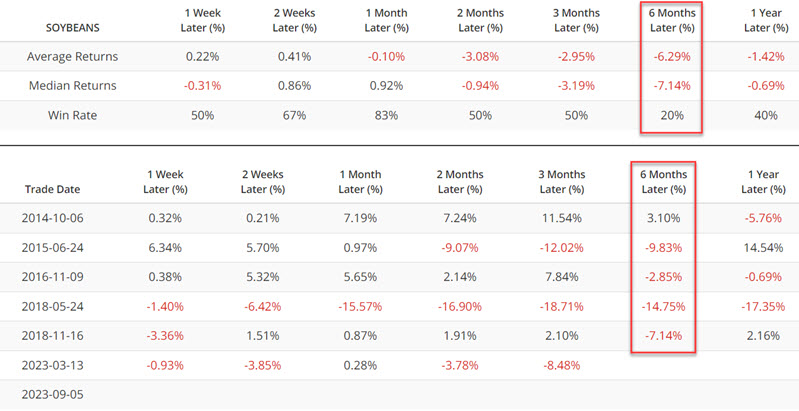
2-months to 1-year results have shown negative Median Returns and subpar Win Rates.
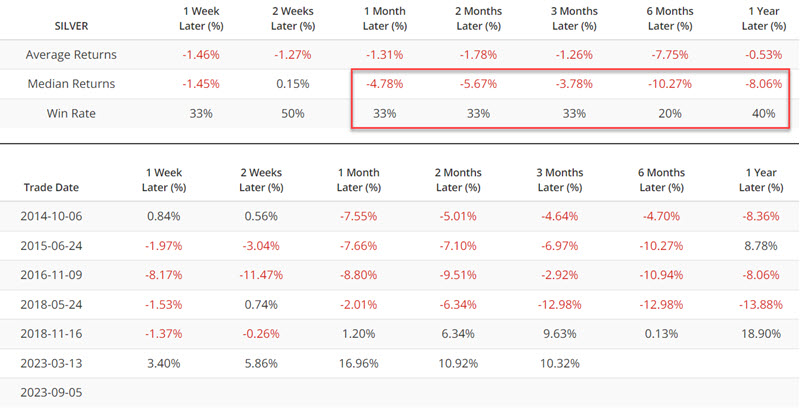
Silver is the one consistently bearish market
One market that tends to show subpar results from both of the signals we have been highlighting is silver. The chart and table below display silver performance after the Macro Index Model crossed above 0.50.
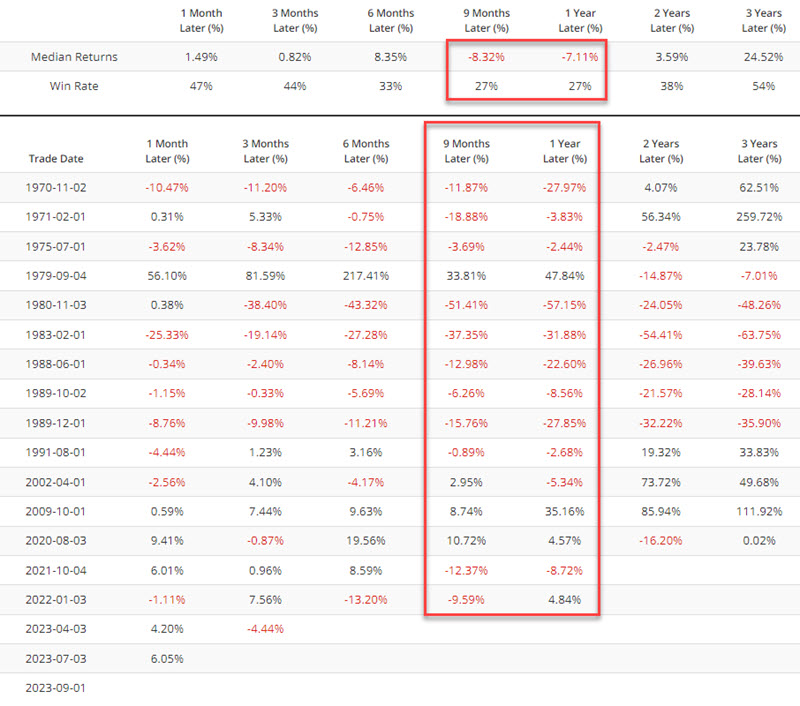
Silver performance has also been unfavorable after the Hedge Fund Exposure - Gold indicator was below -0.3 for the first time in six months.
What the research tells us…
Both of the indicator signals highlighted above have generated compelling results. Unfortunately, except for silver, those results have been diametrically opposed. So what's a trader to do? Probably the best suggestion is to follow the adage, "The trend is your friend." Commodities appear to be poised for a significant move in the year ahead. If so, one of the indicators highlighted here will be flat-out wrong. Now is the time for commodity traders to "listen to the market."