
The Combined Credit Spread Model Falls to Unfavorable - Part II

Key points:
- Credit spreads measure the difference in yield between a higher quality issue and a lower quality issue
- Rising credit spreads signify risk-off behavior among very large and sophisticated investors
- The Combined Credit Spreads Model recently fell into unfavorable status - suggesting limited upside for stocks while this status remains
The Combined Credit Spread Model
In Part I, we detailed the components that comprise our Combined Credit Spreads Model and why they matter. The model recently fell into unfavorable territory. In Part II, we will take a closer look at S&P 500 performance during previous instances.
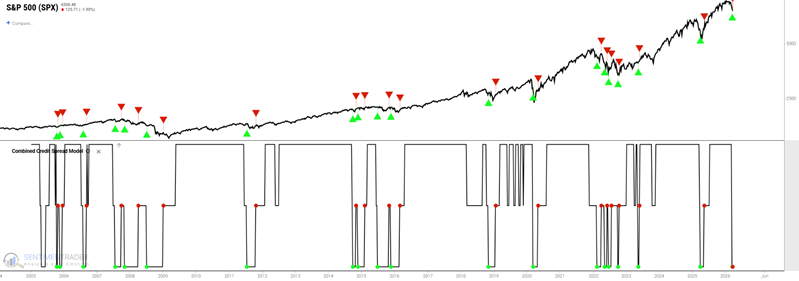
In the chart below, a green arrow marks the beginning of an unfavorable period. This happens when the Model drops to 0. The subsequent red arrow indicates the end of a given unfavorable period. The most recent signal occurred the week ending March 13th.
The table below summarizes the S&P 500's performance during unfavorable periods. Key things to note:
- The model has been unfavorable 16.2% of the time (the rest of the time it is favorable for stocks)
- The Win Rate in