
The Combined Credit Spread Model Falls to Unfavorable

Key points:
- Credit spreads serve as a "fear gauge" in the credit markets - narrow/falling spreads suggest calm, rising spreads suggest concerns
- Our Combined Credit Spreads Model recently fell into unfavorable status - suggesting limited upside and increased volatility for stocks while this status remains
- The Combined Credit Spreads Model is comprised of two credit spread-related indicators - ICE BofA US High Yield Option-Adjusted Spread and the CDX Index
- Part I reviews the indicators that comprise the Combined Credit Spreads Model
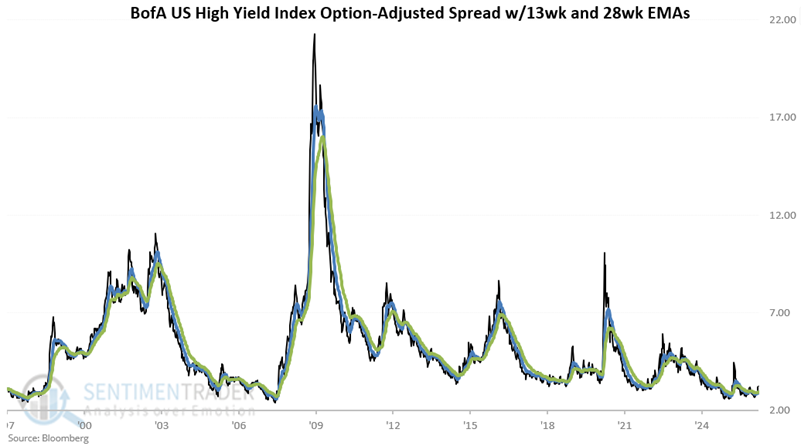
Indicator #1: ICE BofA US High Yield Index Option-Adjusted Spread
The ICE BofA US High Yield Index Option-Adjusted Spread (HYCS) measures the spread between the computed index of below-investment-grade bonds and the spot Treasury curve.
We rate the spread as favorable when it is in a downtrend and unfavorable when it is in an uptrend. We designate its trend as follows:
A = HYCS weekly close
B = 13-week exponential average of A
C = 28-week exponential average of B
The chart below displays these variables.
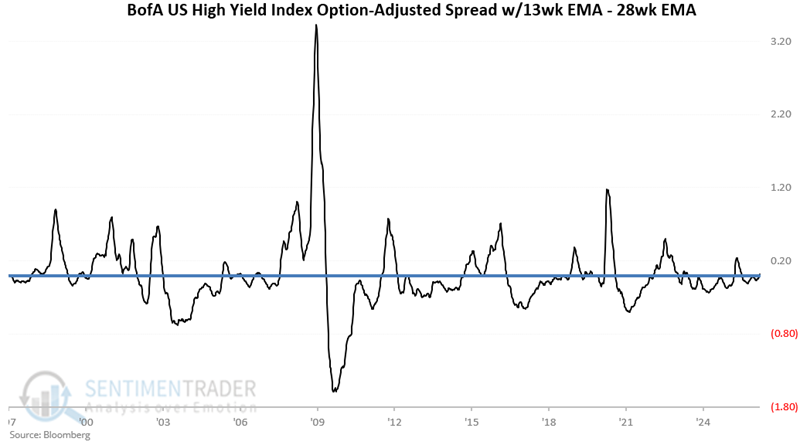
From here, we take the difference between the two moving averages.
D = A - B
The chart below displays the value for Variable D.
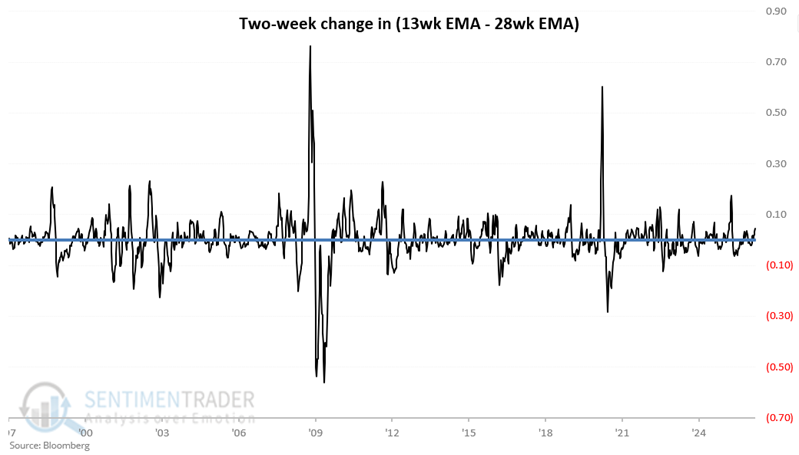
Next, we compare this week's 13-week EMA minus the 28-week EMA value to the value from two weeks ago.
E = Value for D two weeks ago
F = D - E
The chart below displays the two-week change in the 13-week minus 28-week spread.
We use variables D and F to determine the trend of our indicator.
G = If D and F are both positive, then G = 0 else G = 1 (i.e., this indicator is unfavorable when both D and F are above 0)
If G = 1, we consider this indicator favorable, and if G = 0, we consider this indicator unfavorable
In English:
If a) the 13-week EMA is above the 28-week EMA AND b) the difference between the 13 and 28-week EMAs this week is above the difference two weeks ago (i.e., if both of these measures are in uptrends), then we rate this indicator as "unfavorable." If either measure is in a downtrend, this indicator is "favorable."
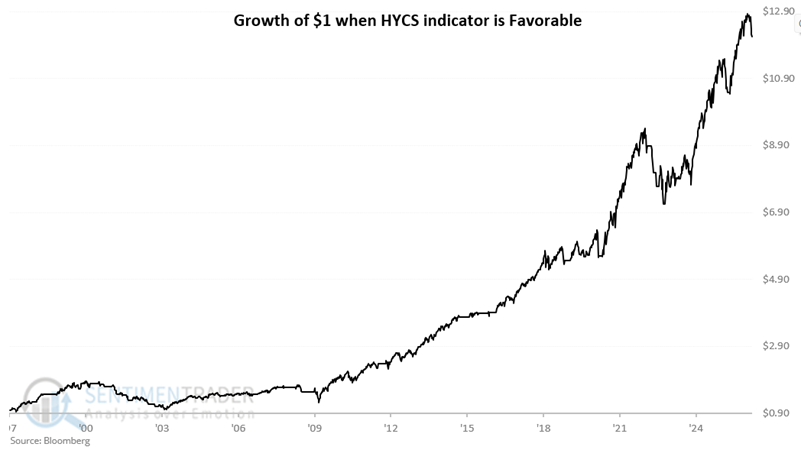
The chart below displays the hypothetical growth of $1 in the S&P 500 only when this model is favorable (i.e., G = 1). Since 1997, $1 grew to $12.22.
The chart below displays the growth of $1 in the S&P 500 only when the model is unfavorable. Since 1997, $1 has declined to $0.69.
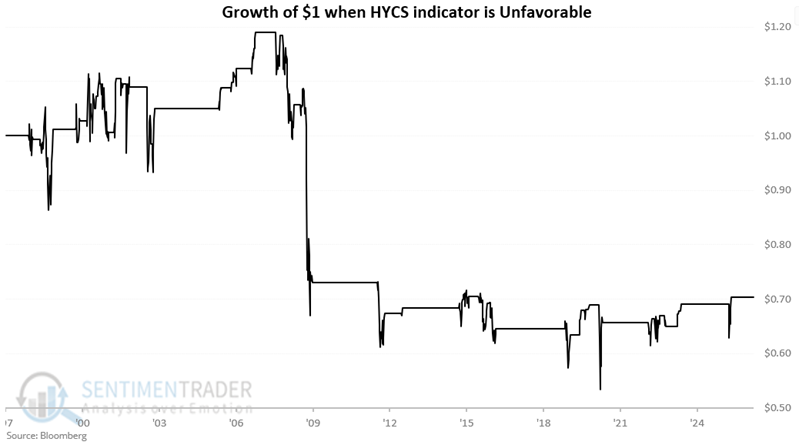
The message from the historical results is not that the stock market is doomed to decline while this particular indicator is unfavorable. As a weight-of-the-evidence indicator, an unfavorable signal merely suggests that the probability of rising stock prices is much lower and that higher volatility is much more likely.
Indicator #2: Credit Default Swaps (CDX Index)
Next, let's turn our attention to the CDX Index. Per our website:
Over the past few years, one of the fastest-growing derivatives markets has been that for credit default swaps (CDS). A CDS allows the various parties to swap the exposure of default of the underlying credit (i.e., bond). For example, the investor in a relatively risky bond might be uncomfortable that the bond issuer could default on their payments. To hedge that risk, the investor buys a CDS.
When they buy the CDS, the investor pays another trader (the seller) a periodic payment. That other trader then assumes the risk that the bond issuer will default. If that happens, the seller is responsible for paying the bond investor an agreed-upon amount. This allows the original investors to offset some of their risk, the seller to generate a stable flow of income, and the bond market to enjoy more liquidity. Of course, just as with selling options, the seller of a CDS takes on potentially significant risks, and a major system-wide event could trigger a massive wave of trouble since this market has become so large.
As posted on the site, the indicator tracks an index created by Dow Jones that monitors the spread between credit default swaps on high-yield (i.e., junk) bonds and Treasury securities. The higher the index, the wider the spread...this means that credit investors are increasingly worried about defaults and are willing to pay higher prices for default protection. We expect it to track volatility measurements like the VIX quite closely, as times of fear should see this index spike higher, and times of complacency should see it become very subdued. In that sense, it is a contrary indicator.
For this model:
A = CDX Index weekly close
B = 14-week exponential average of A
C = 25-week exponential average of A
D = B - C
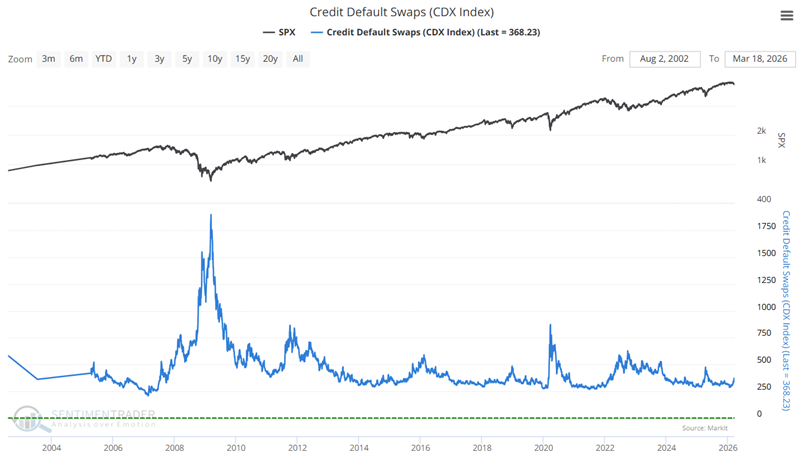
The chart below displays the CDX Index. Note the tendency to rise during times of stock market turmoil.
The chart below displays the value for variable D above (the difference between the 14-week and 25-week EMAs).
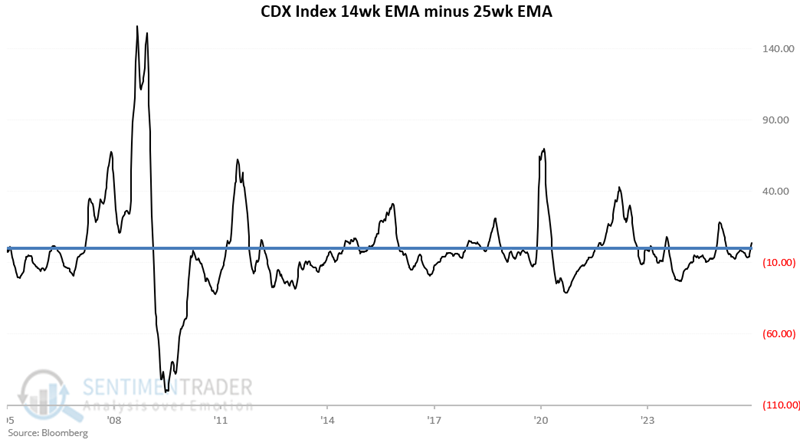
Readings for variable D below zero are considered favorable, and readings above zero are considered unfavorable.
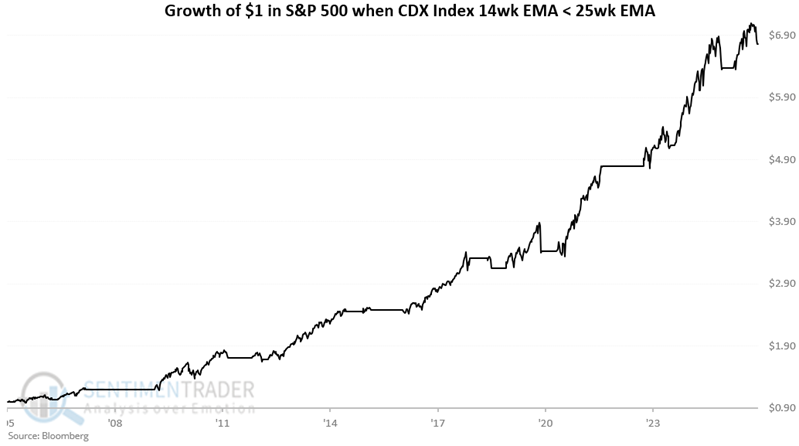
The chart below displays the hypothetical growth of $1 in the S&P 500 only when this model is favorable (i.e., D <= 0). Since 2005, $1 grew to $6.76.
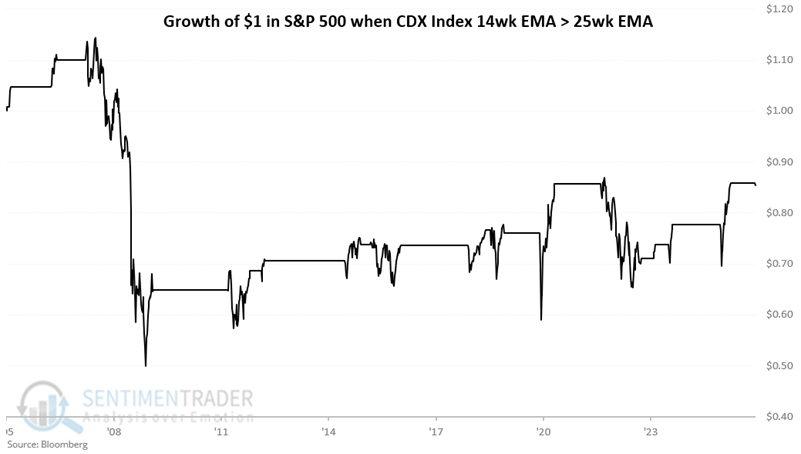
The chart below displays the hypothetical growth of $1 in the S&P 500 only when this model is unfavorable (i.e., D > 0). Since 2005, $1 fell to $0.85.
Once again, an unfavorable reading does not "guarantee" a bear market in stocks. Unfavorable readings do, however, suggest that the potential for a sharp drawdown, and/or for an extended period of volatile sideways action, is much higher.
The Combined Credit Spread Model
The Combined Credit Spread Model synthesizes the signals from the High-Yield Credit Spread Weekly Model and the CDX Index Model into a single indicator. It sums the individual binary outputs (where 1 represents 'Favorable' and 0 represents 'Unfavorable') of the two component models. The resulting value for the Combined Model can be 0, 1, or 2. This aggregated score aims to provide a more comprehensive assessment of credit market conditions and perceived risk, leveraging insights from both high-yield bond spreads and credit default swaps. A score of 0 indicates that both underlying models signal unfavorable conditions (heightened risk aversion); a score of 2 indicates that both signals are favorable (calmer conditions); and a score of 1 indicates a mixed signal. Historically, a score of 0 has been associated with challenging periods and limited upside for the stock market, whereas a score of 2 points has been associated with more supportive conditions.
As seen in the chart below, the model recently dropped to an unfavorable reading of 0.
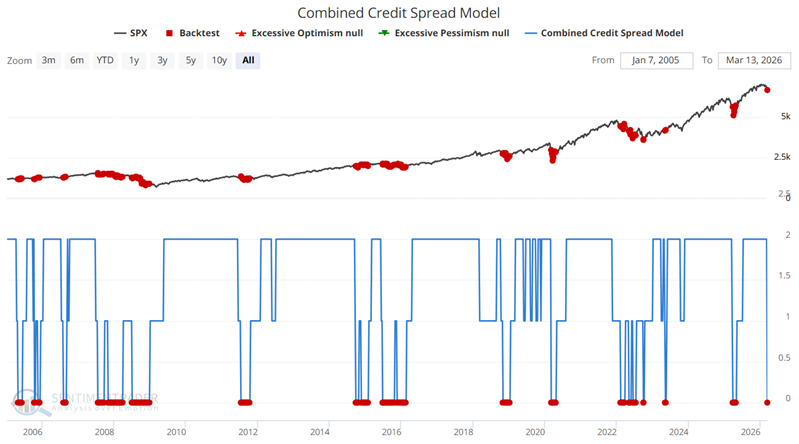
While this model is not recommended as a standalone trading model, Part II will examine S&P 500 performance when the Combined Credit Spread Model equals 0.
What the research tells us…
Credit spreads reflect the collective sentiment of credit markets. When spreads are calm and quiet and generally trend lower, it typically reflects a favorable environment for stocks. When spreads are volatile, chaotic, and widening, they usually reflect significant uncertainty. And as the old adage goes, "The stock market hates uncertainty." Our credit spread Combined Model is presently in an unfavorable status. While we do not recommend using this model as a standalone buy-and-sell strategy, the chart above shows that stocks have made little headway when both parts of the Combined Model are unfavorable. If history proves a useful guide, the stock market may not reverse higher in any significant way until either high-yield credit spreads begin to narrow and/or the Credit Default Swap Index turns down,