
The CBOE total put/call ratio triggered a buy signal for stocks

Key points:
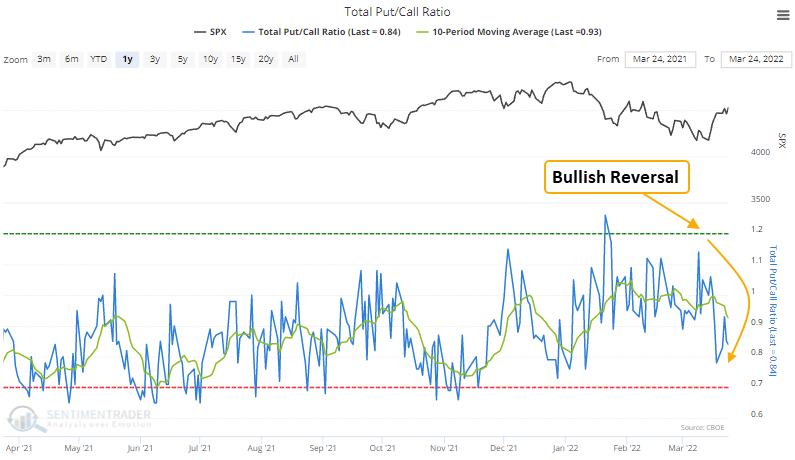
- CBOE total put volume increased relative to call volume
- The put/call ratio has now reversed lower from an elevated level
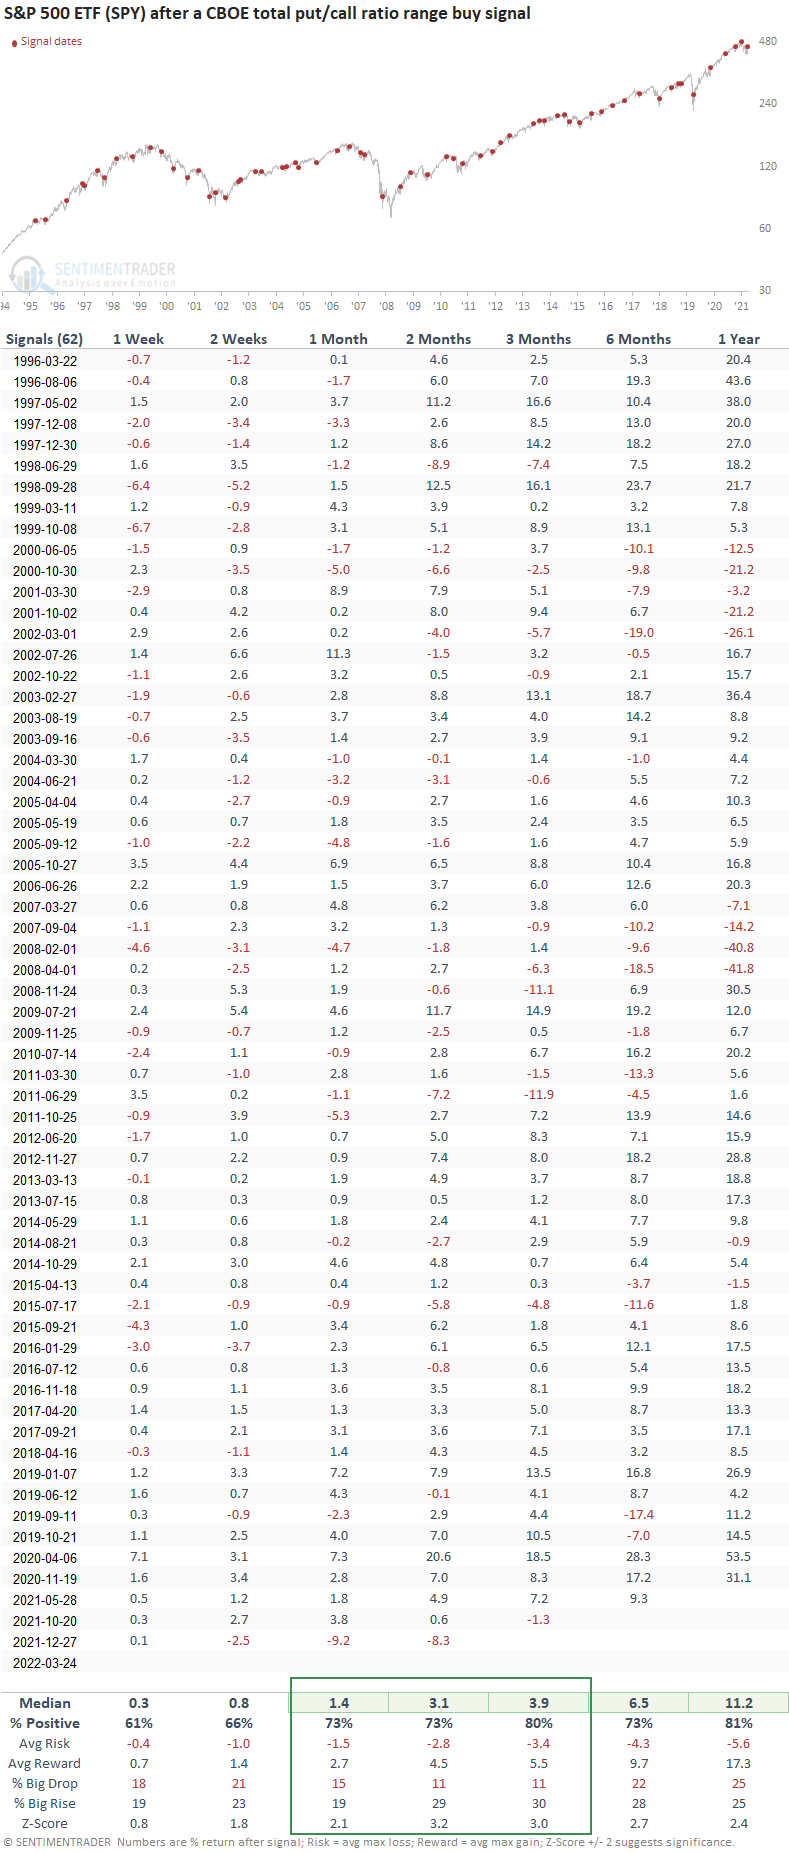
- The S&P 500 has rallied 80% of the time after other signals
The put-call ratio as a contrary sentiment indicator
When investors are bullish on stocks, they buy call options to bet on rising prices. Conversely, when they are bearish on stocks, they buy put options to bet on declining stocks. The CBOE total put/call ratio can be used as a contrary indicator to identify an environment where sentiment has become too pessimistic on the future direction of stocks. When opinions become too bearish, stocks tend to rally.
A trading model that identifies a reversal in the put/call ratio
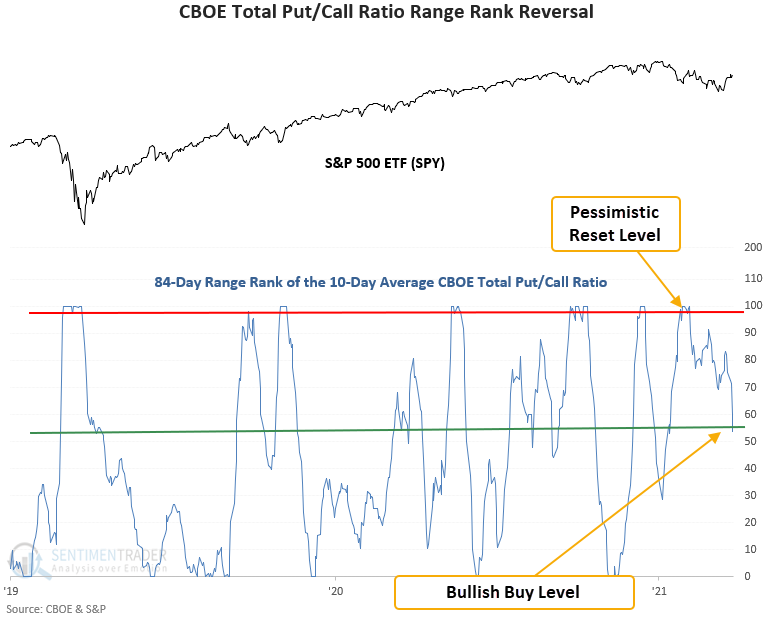
The total put/call ratio trading model applies an 84-day range rank to a 10-day average of the total put/call ratio. As a reminder, the range rank measures the current value relative to all other values over a lookback period. 100 is the highest, and 0 is the lowest. The pessimistic reset condition is confirmed when the range rank indicator crosses above the 99th percentile. A new buy signal triggers when the range rank falls below the 56th percentile. Within 5 days of the cross, the 5-day rate of change for the S&P 500 must be >= 0%. i.e., market momentum is positive.
Similar reversals in the put/call ratio have preceded gains 80% of the time
This signal triggered 62 other times over the past 26 years. After the others, future returns, win rates, and risk/reward profiles were excellent across all time frames, especially on a medium-term basis. Suppose we look at the signals during unfavorable environments like 2000-03 and 2007-09. In that case, the 1-month time frame shows 9 out of 12 winners. And the drawdowns in that time frame were minimal, except for the previous signal.
CBOE equity put/call ratio signal update
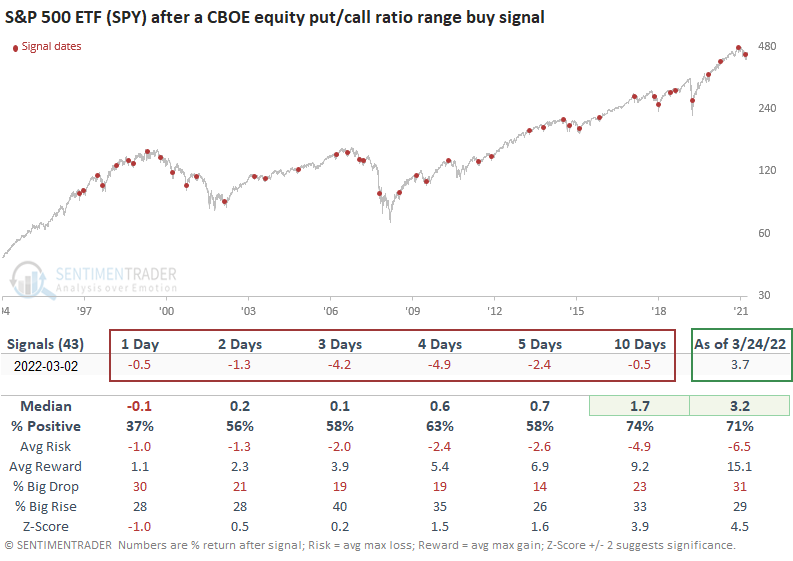
The equity put/call trading model triggered a buy signal on 3/2/22. That signal got off to a shaky start. However, it has subsequently recovered and now shows a gain of 3.7%. With the S&P 500 well off the lows, I would not rule out some backing and filling with the total put/call signal.
 What the research tells us...
When CBOE total put volume increases relative to call volume, traders have become too pessimistic on the outlook for stocks. Stocks are likely to trade higher when the pessimistic extreme reverses. Similar setups to what we're seeing now have preceded rising prices for the S&P 500, with a 3-month win rate of 80%. I like how the model performed during challenging market environments, which is something we might expect now with a federal reserve that is less friendly.