
The Capitulation in Utilities

Key Points:
- The percentage of Utilities sector stocks trading above their 50-day moving average (50-day MA) has dropped to 0%.
- The breadth spread between Utilities and Health Care has fallen below -60.
- This is not overly negative for the broader market (S&P 500).
The Breadth Collapse in Utilities
Defensive stocks earn their name because they often act as a hedge during economic distress. No matter how bad conditions get, people still need to keep their homes running and access basic healthcare. For this reason, Utilities and Health Care typically serve as a buffer during prolonged downturns. Due to these characteristics, they tend to move in tandem. However, the recent performance of these two sectors has diverged sharply.
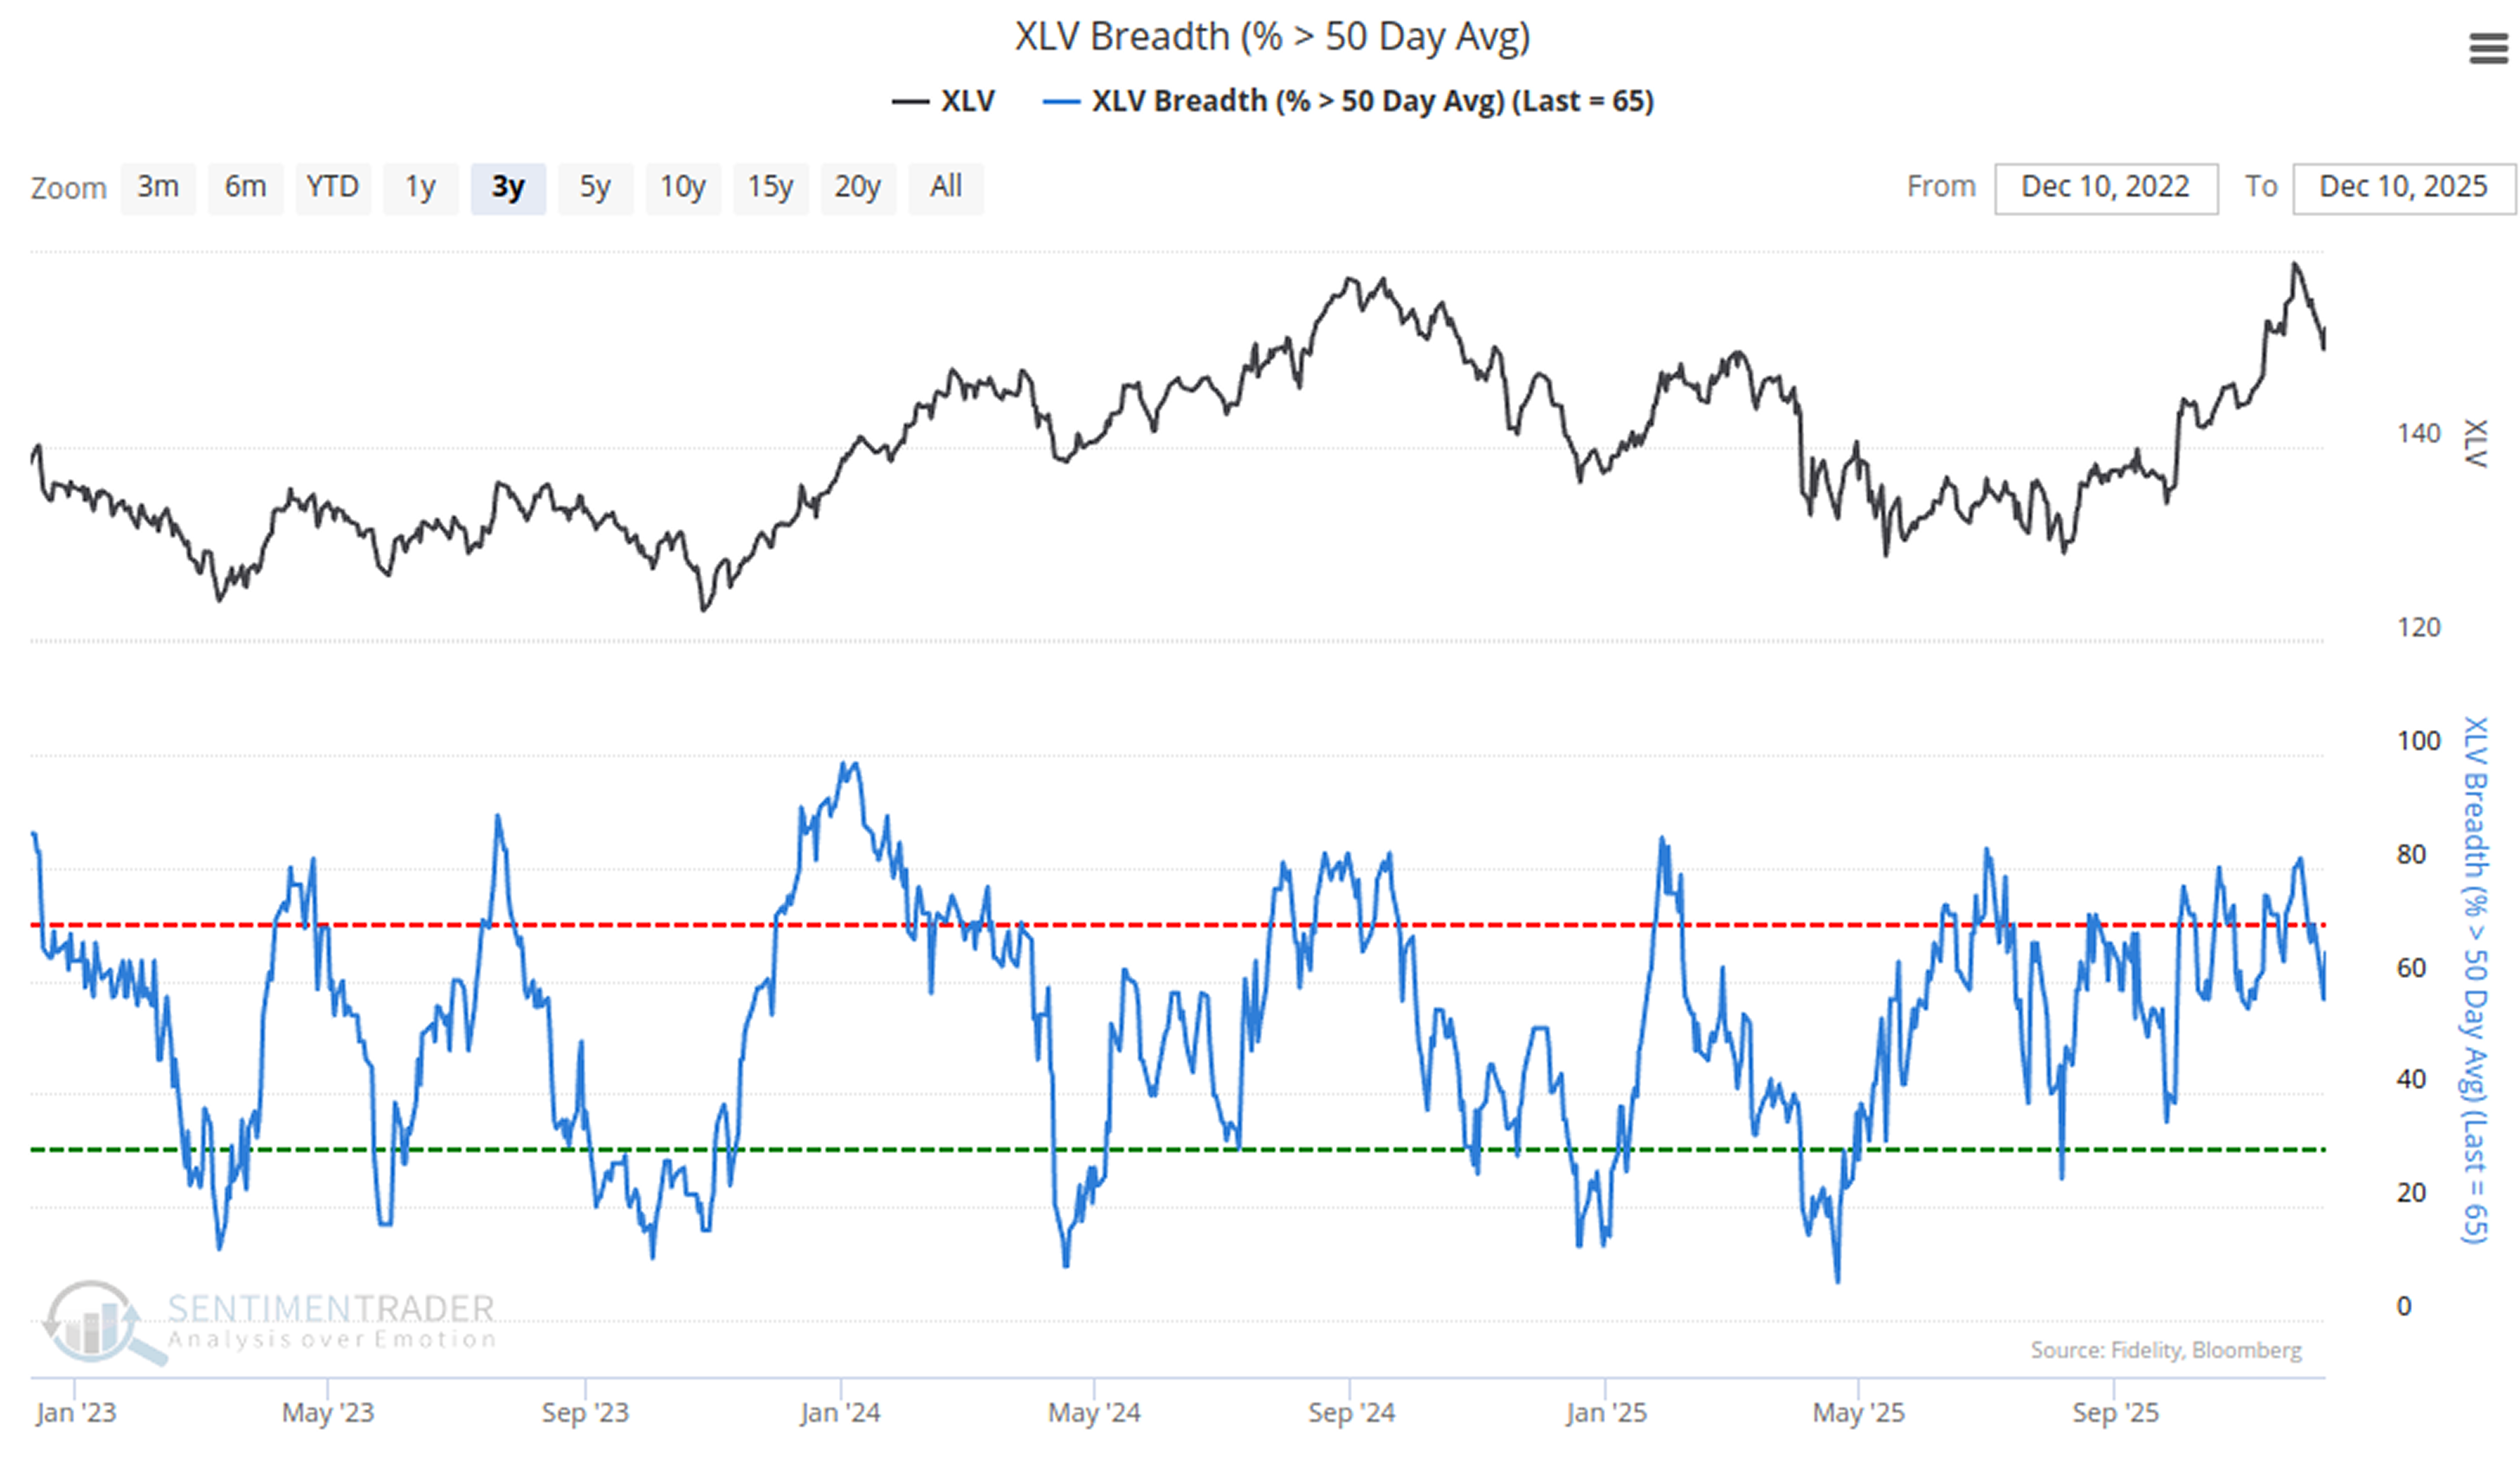
Most Health Care stocks remain in relatively healthy trends.Below Show Its' chart.
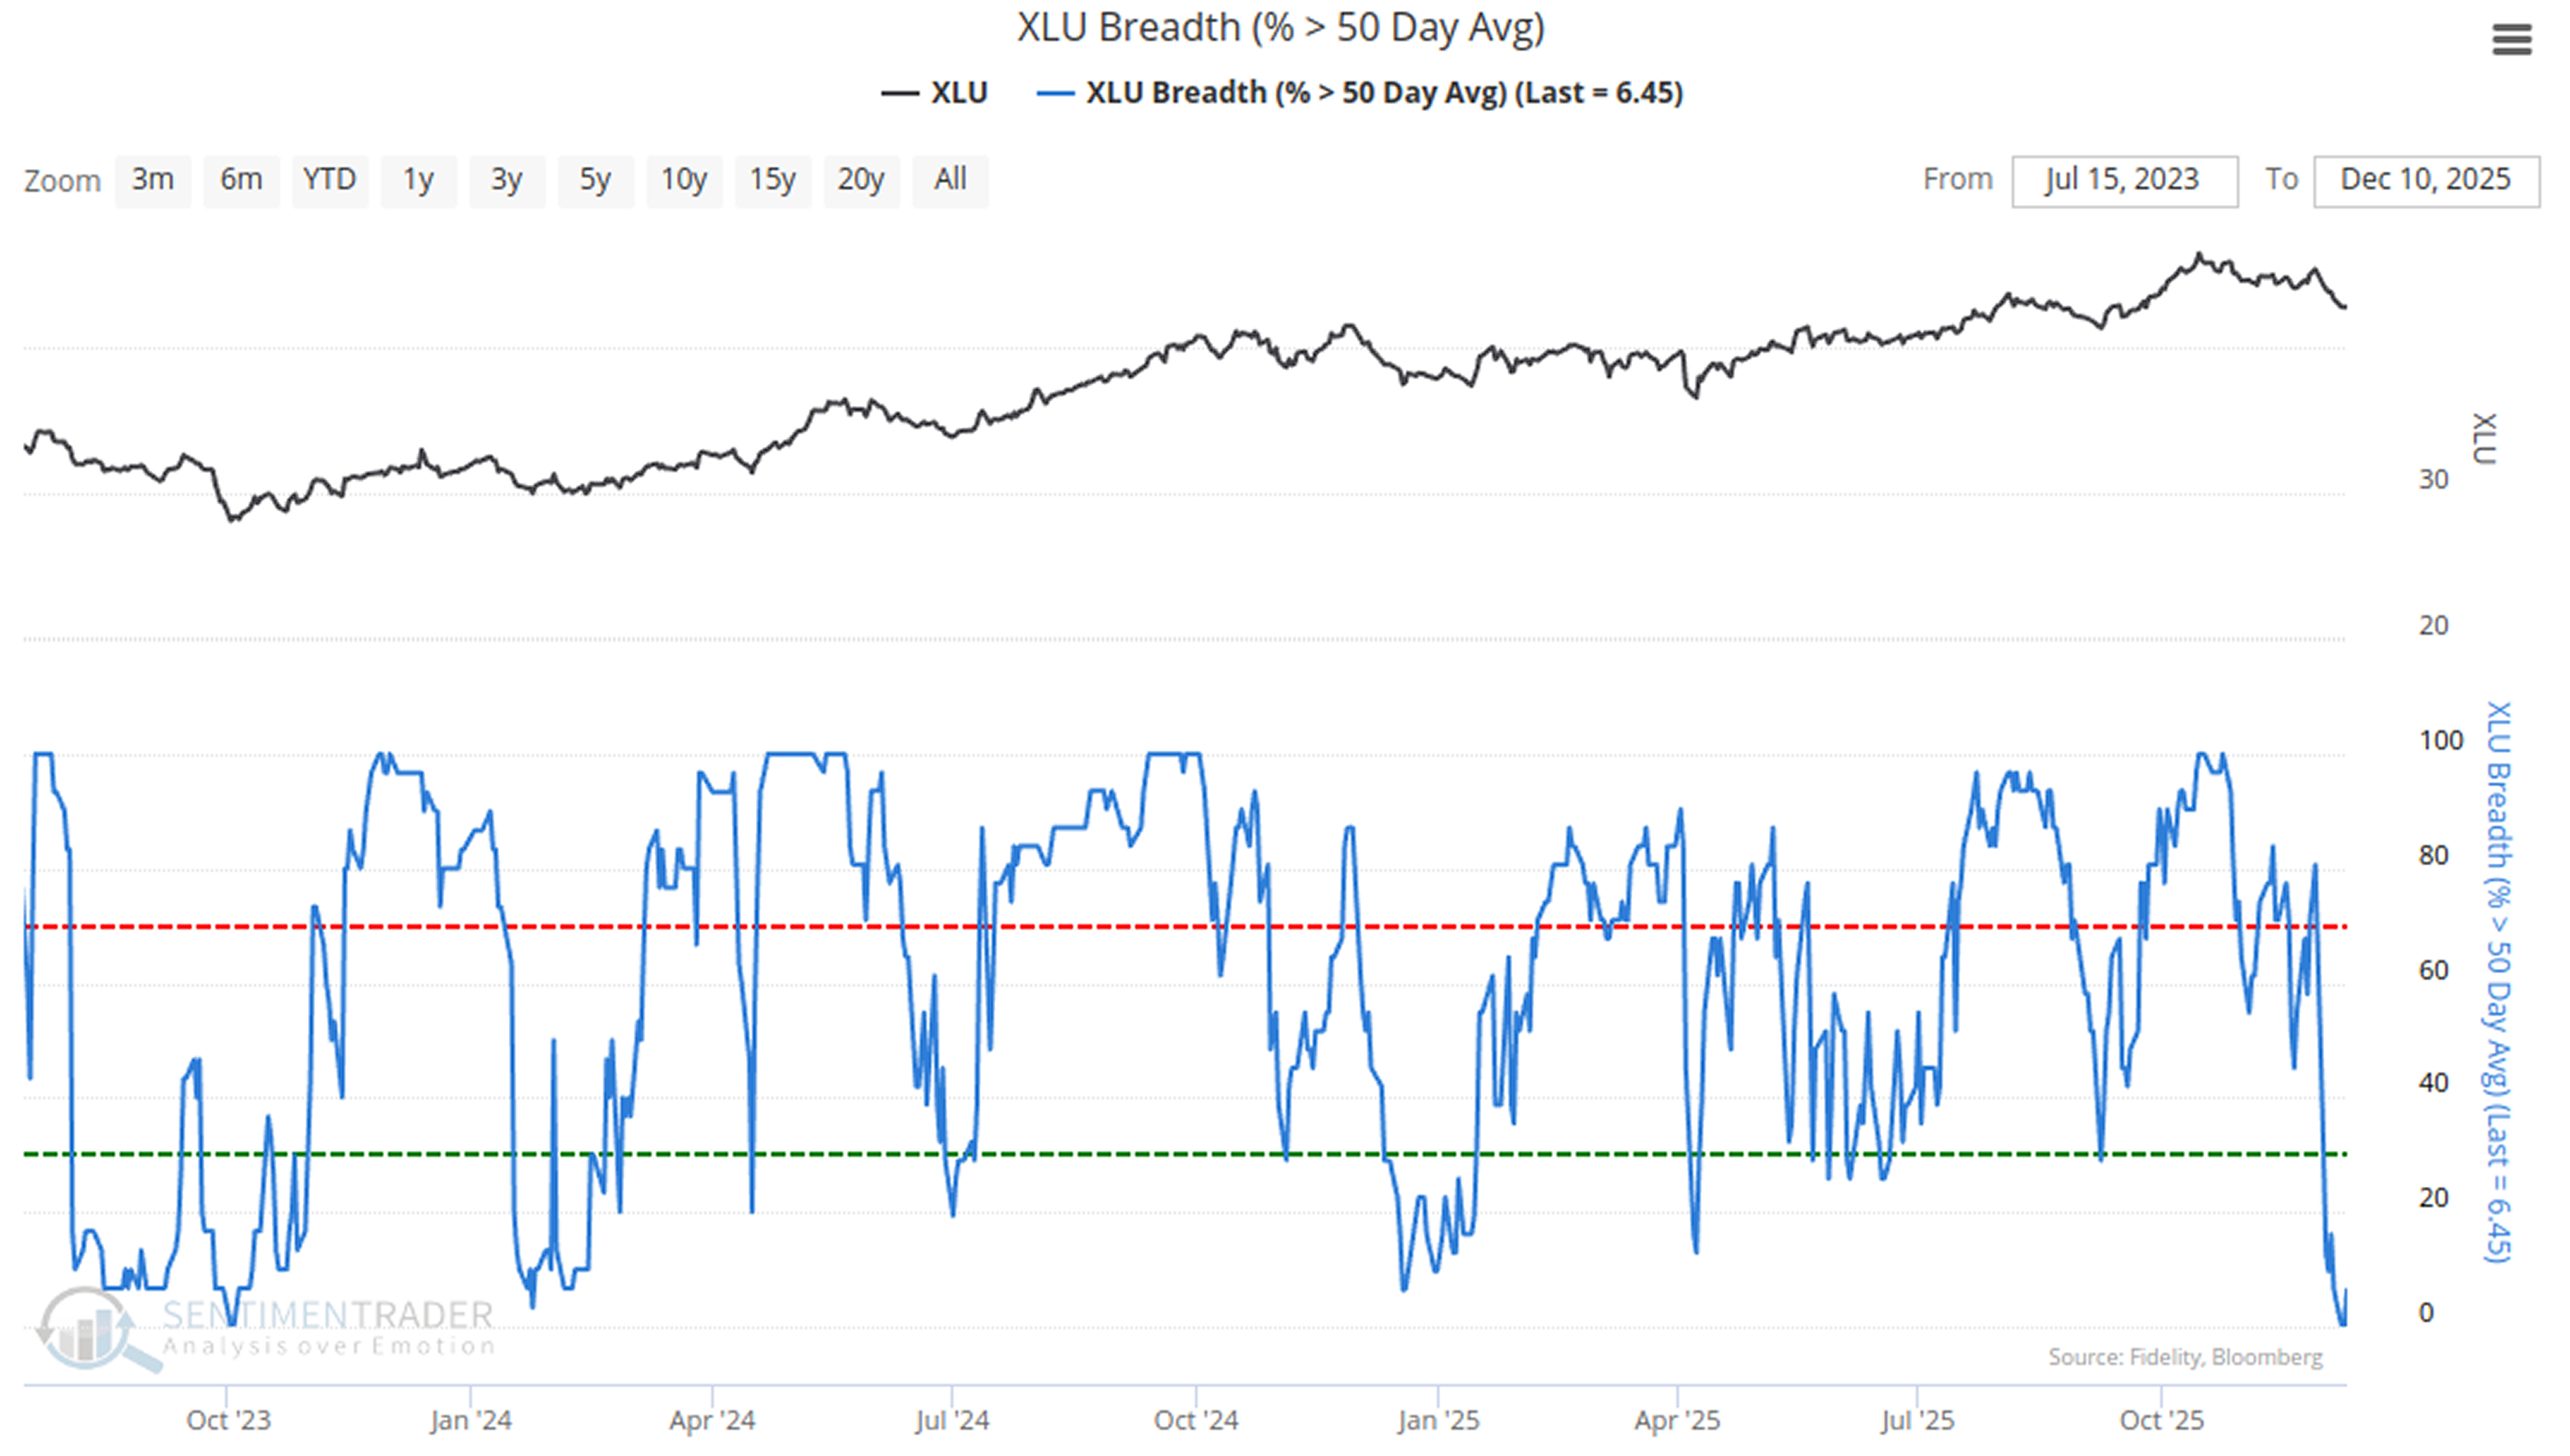
But Utilities stocks have underperformed significantly-by this week, 0% of Utilities stocks are trading above their 50-day MA.
This Is Not a Bad Omen for Stocks
Historically, when we calculate the spread between the percentage of Utilities stocks above their 50-day MA minus the percentage of Health Care stocks above their 50-day MA, a drop below -60 is relatively rare.
The table below shows that this is not a worrying signal for the S&P 500, but rather a sign of health.Related Backtest Click Here.
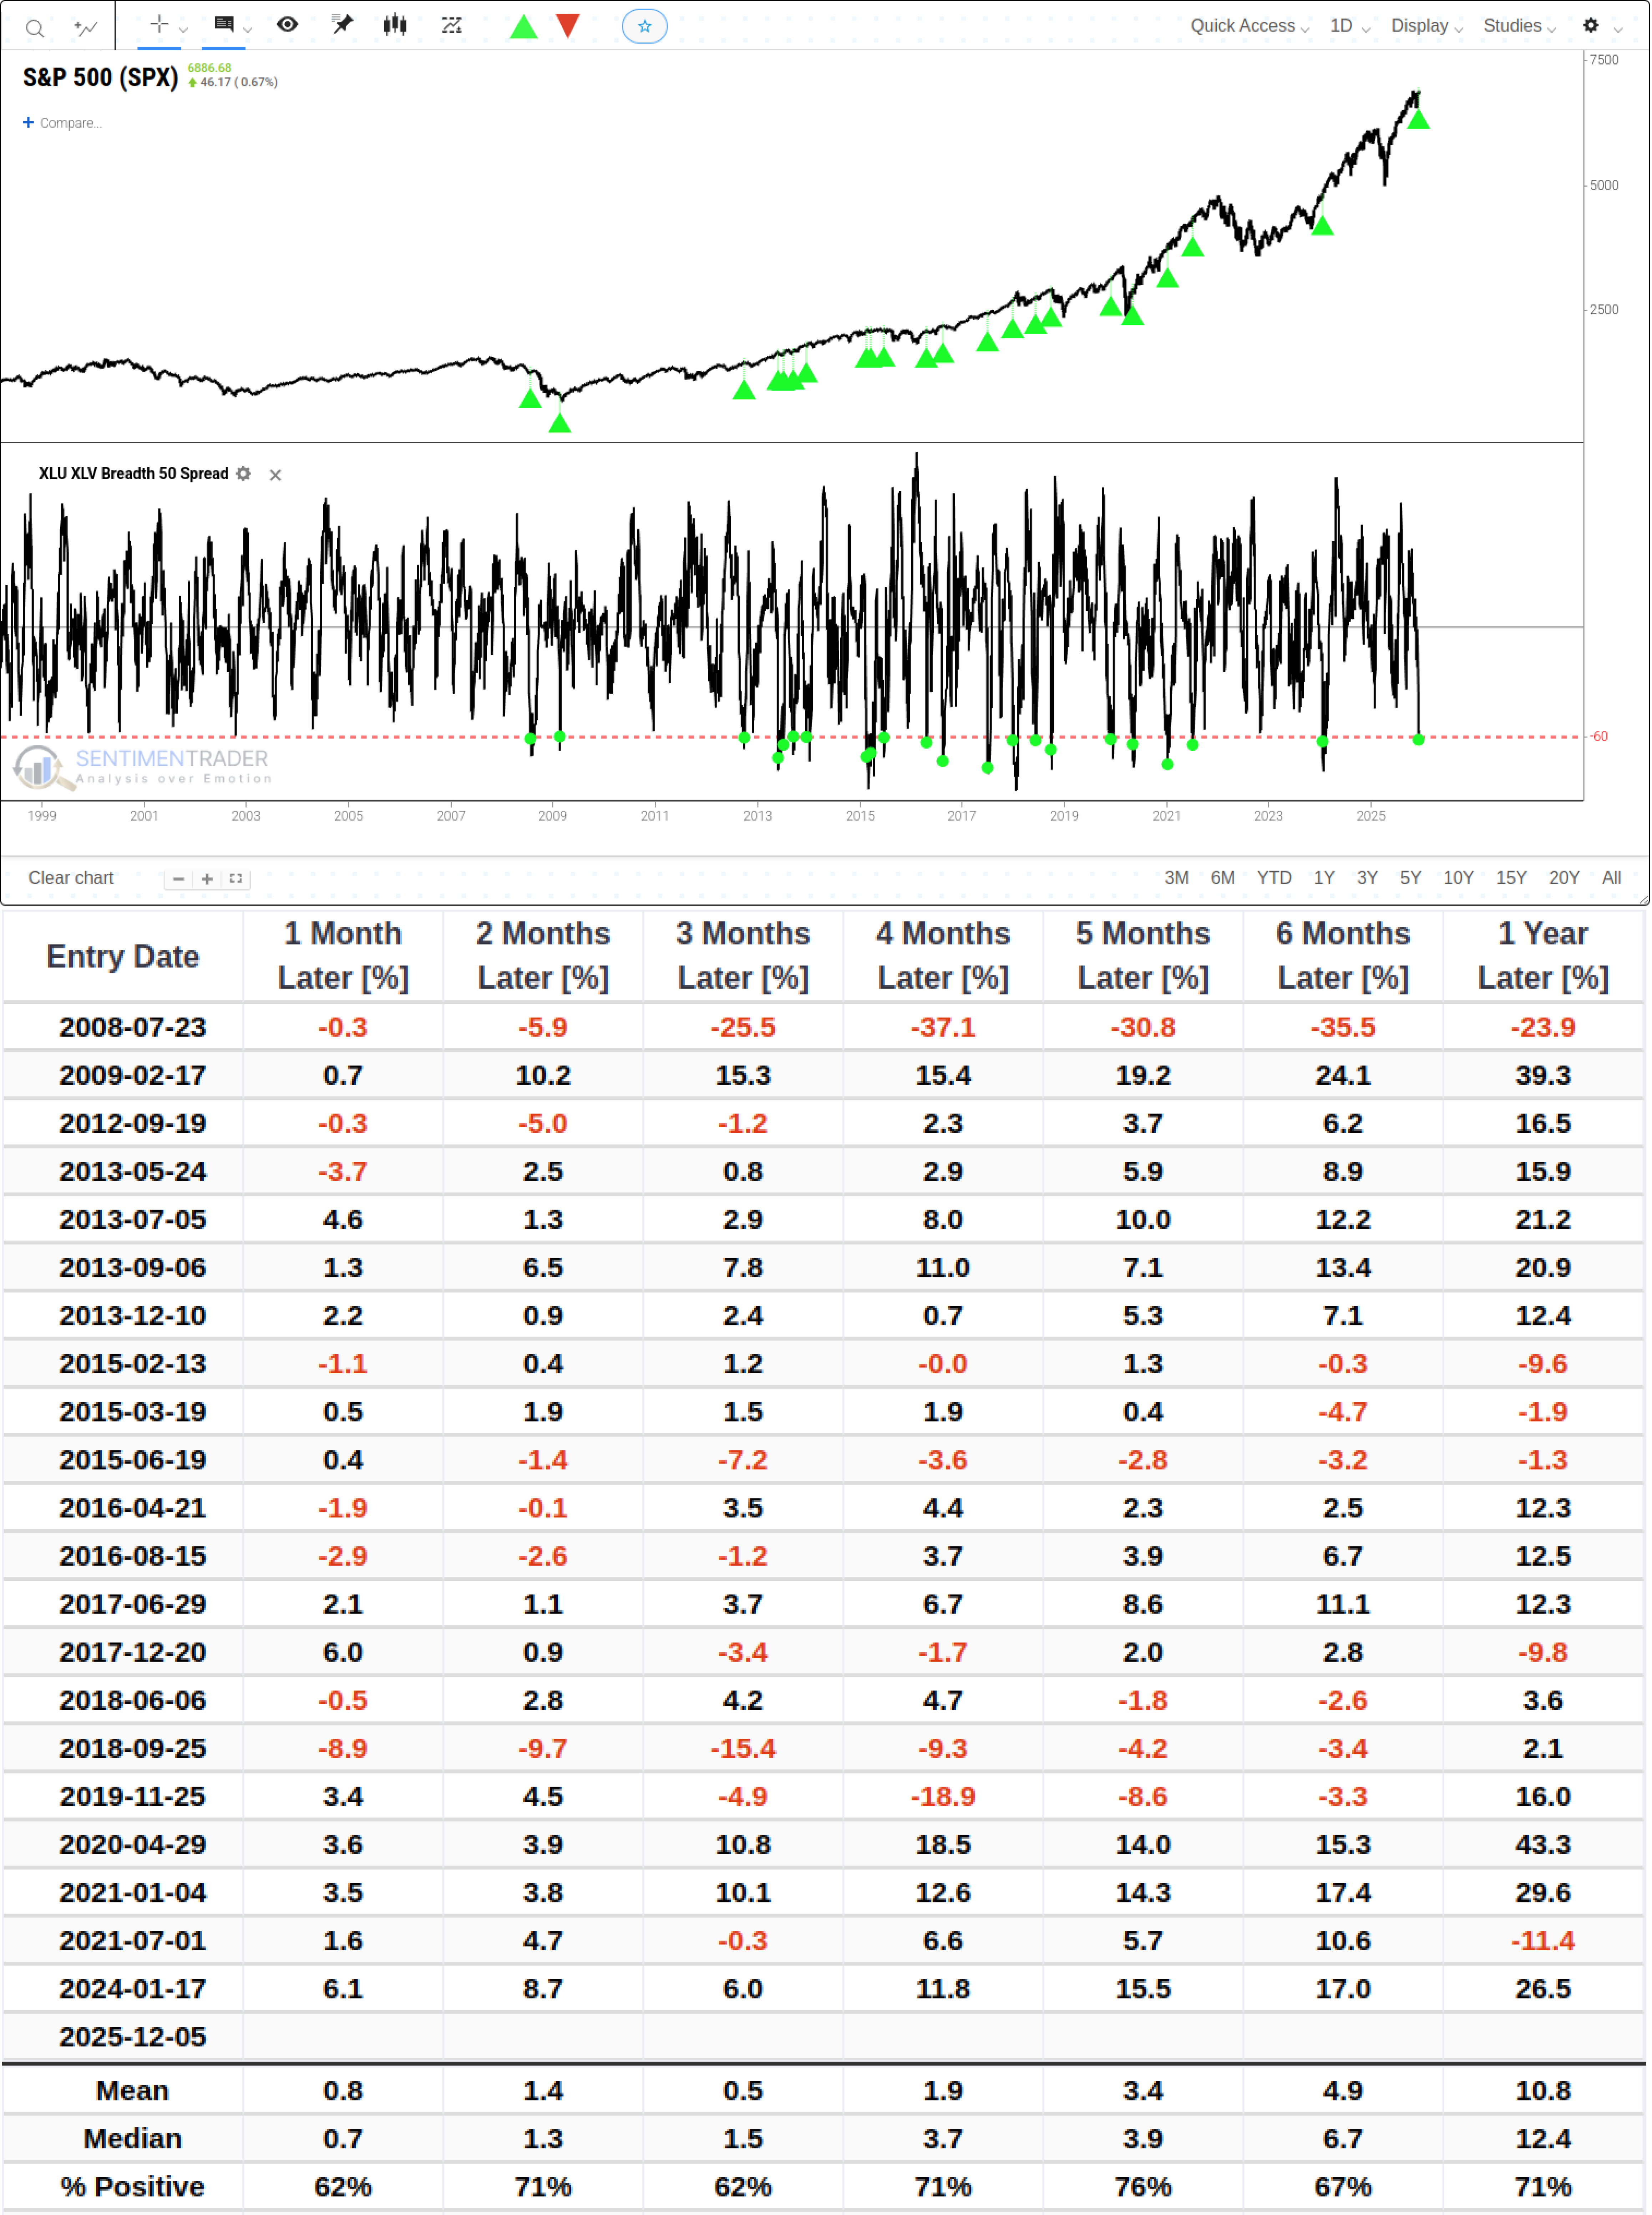
Although the market experienced some volatility in the short term (1 month) with a win rate of only 62%, the win rate ranged between 67% and 71% over the subsequent 6 months to 1 year. This indicates that capital did not exit the market but rather shifted away from interest rate-sensitive utility sectors and was reallocated elsewhere.
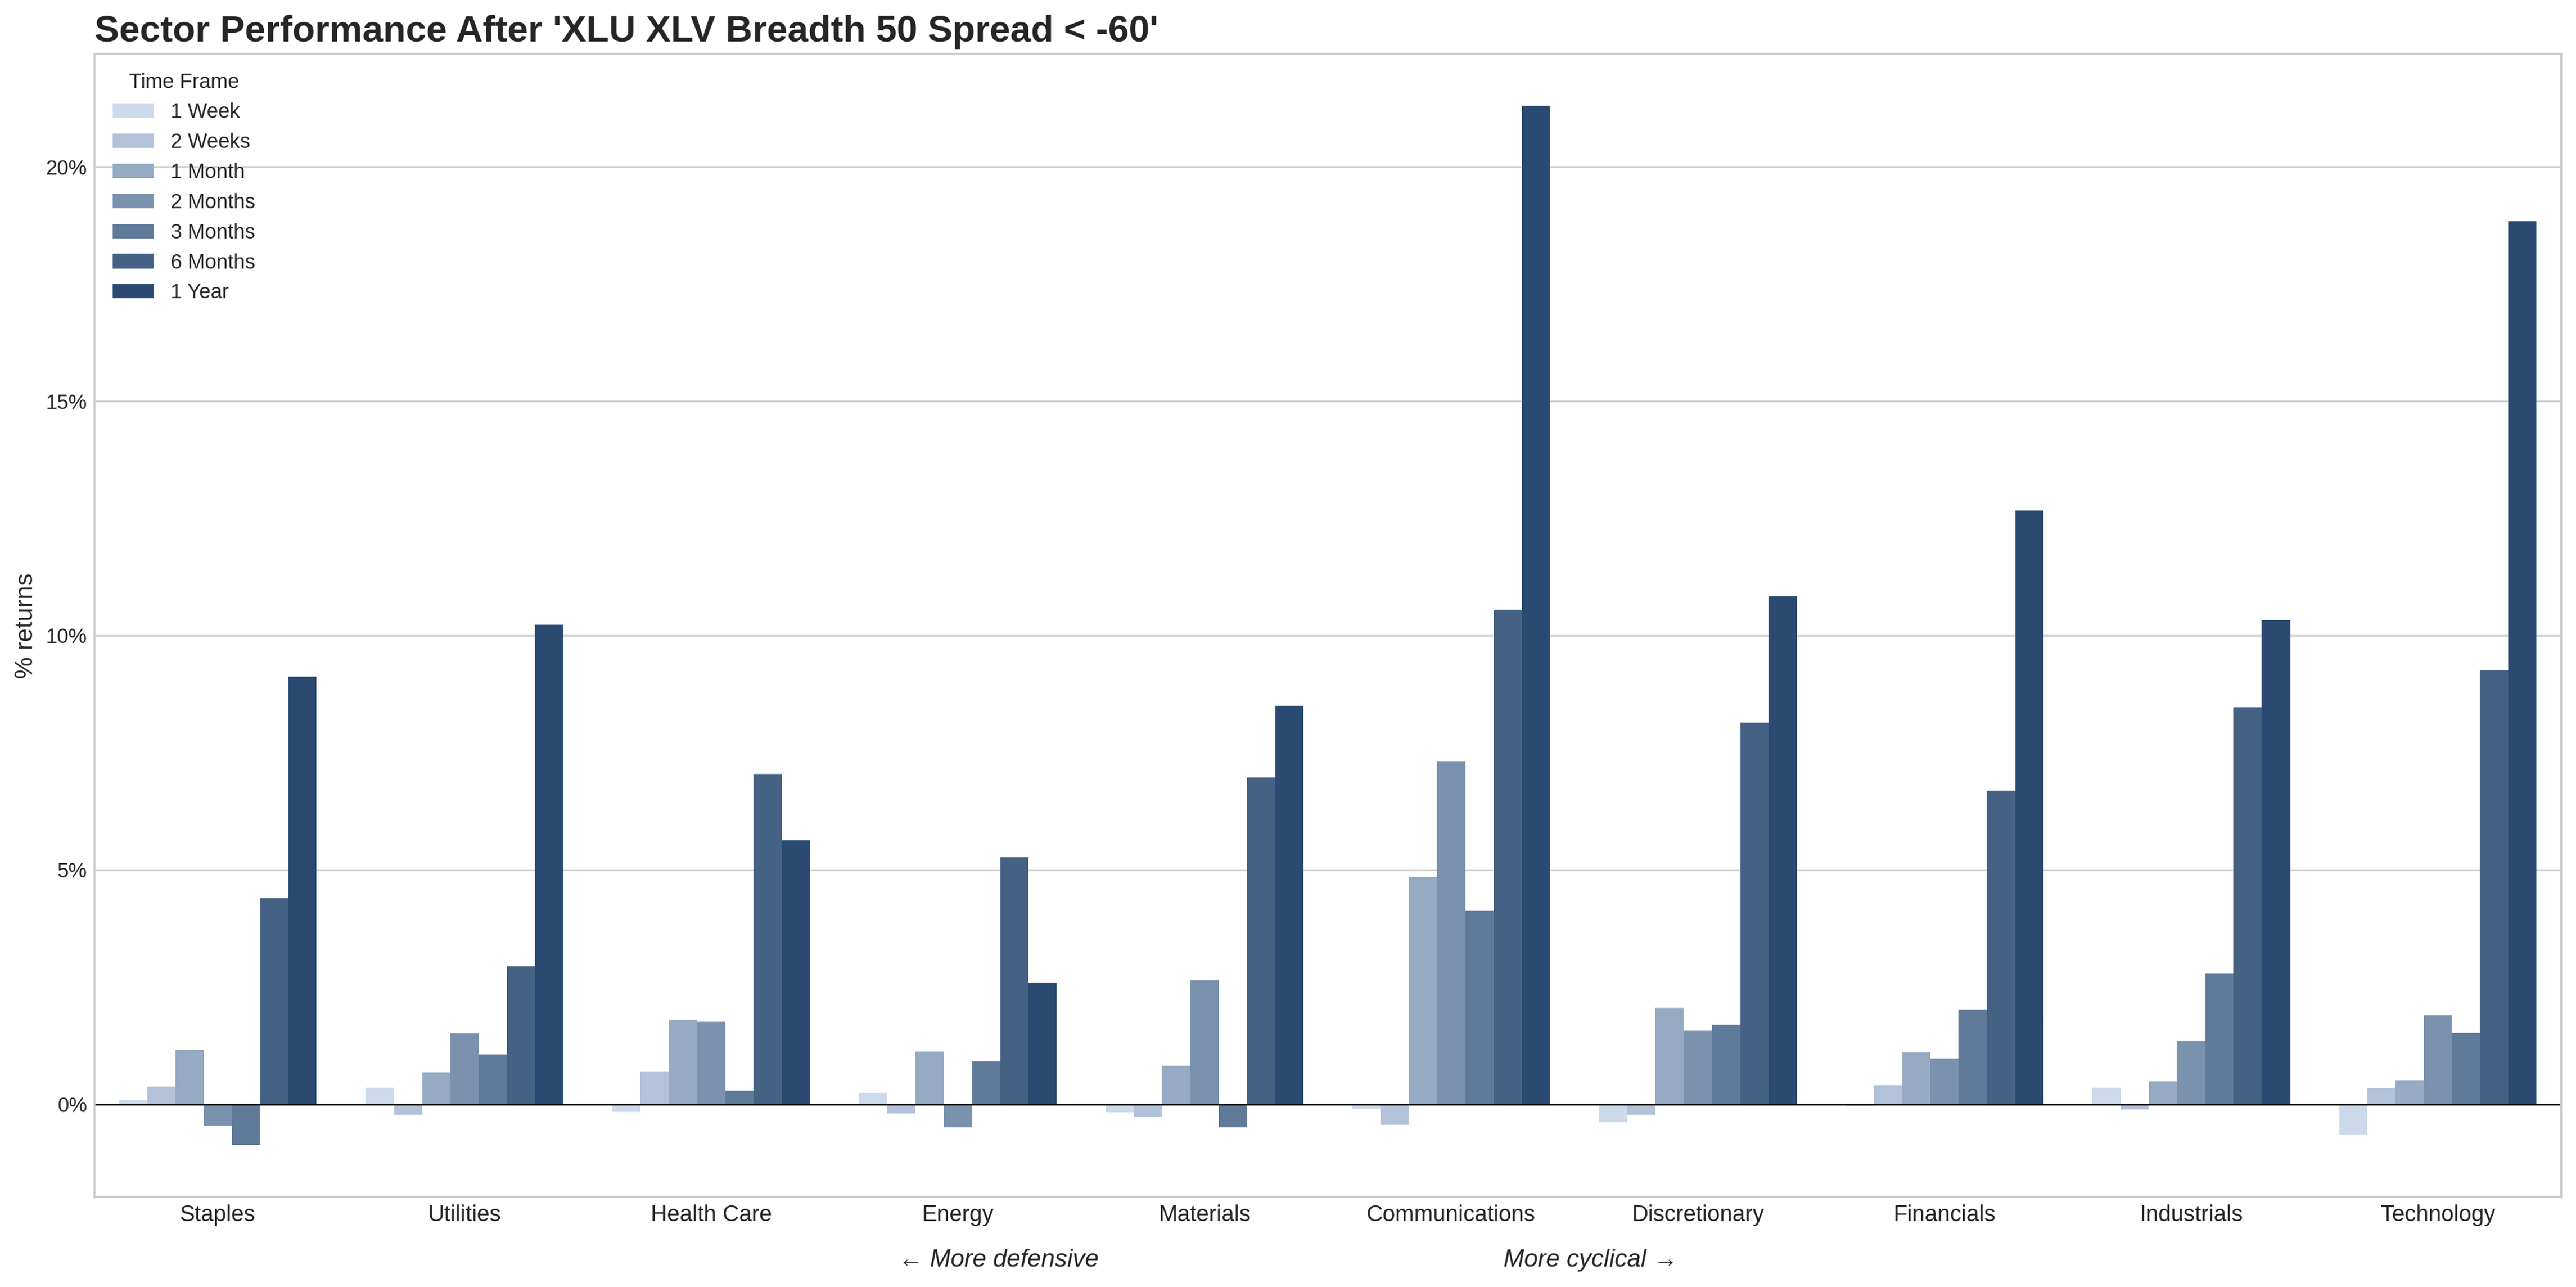
Focusing on other sectors, we find that growth-oriented sectors attract capital following this signal. Over the year after the signal triggers, the best-performing sectors include Communication Services, Information Technology, and Consumer Discretionary.
As the adage goes, "The steeper the decline, the stronger the rebound." With Utilities breadth hitting zero and significantly underperforming Health Care, Utilities stocks do not continue to fall in the subsequent year but instead stage a recovery.
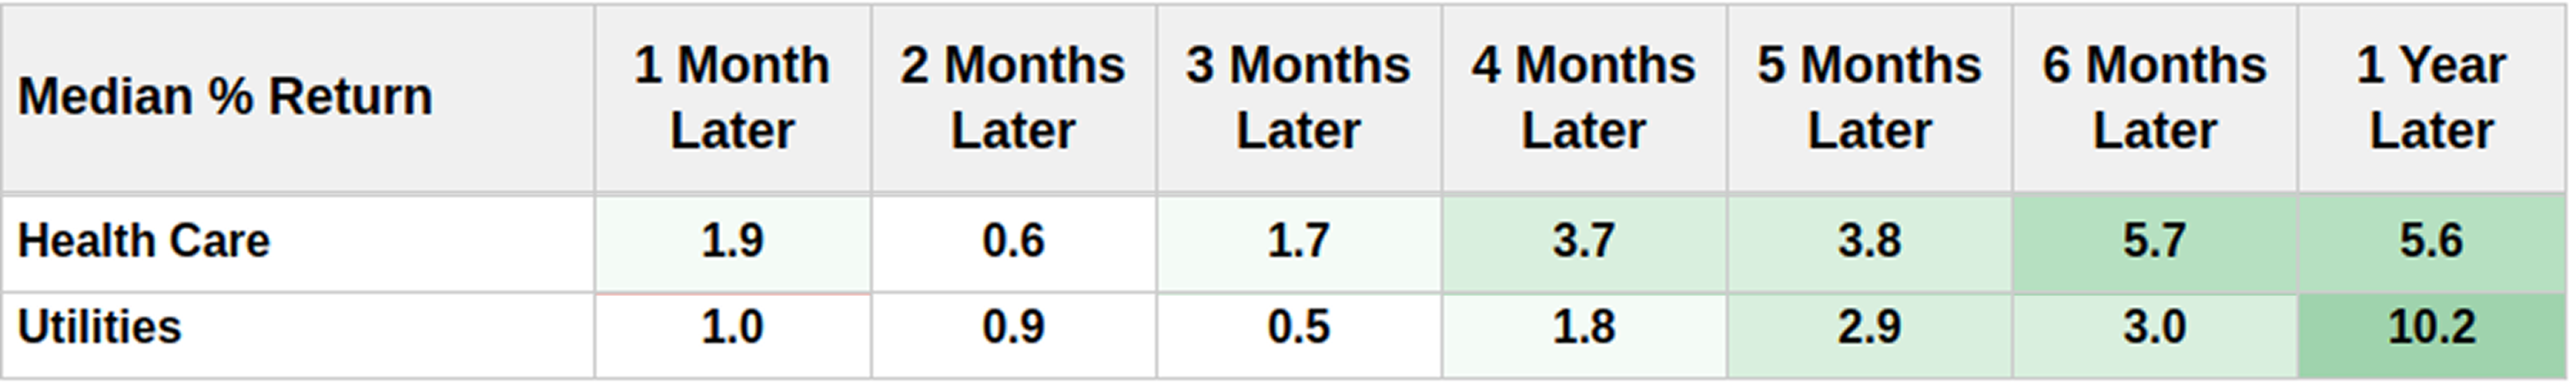
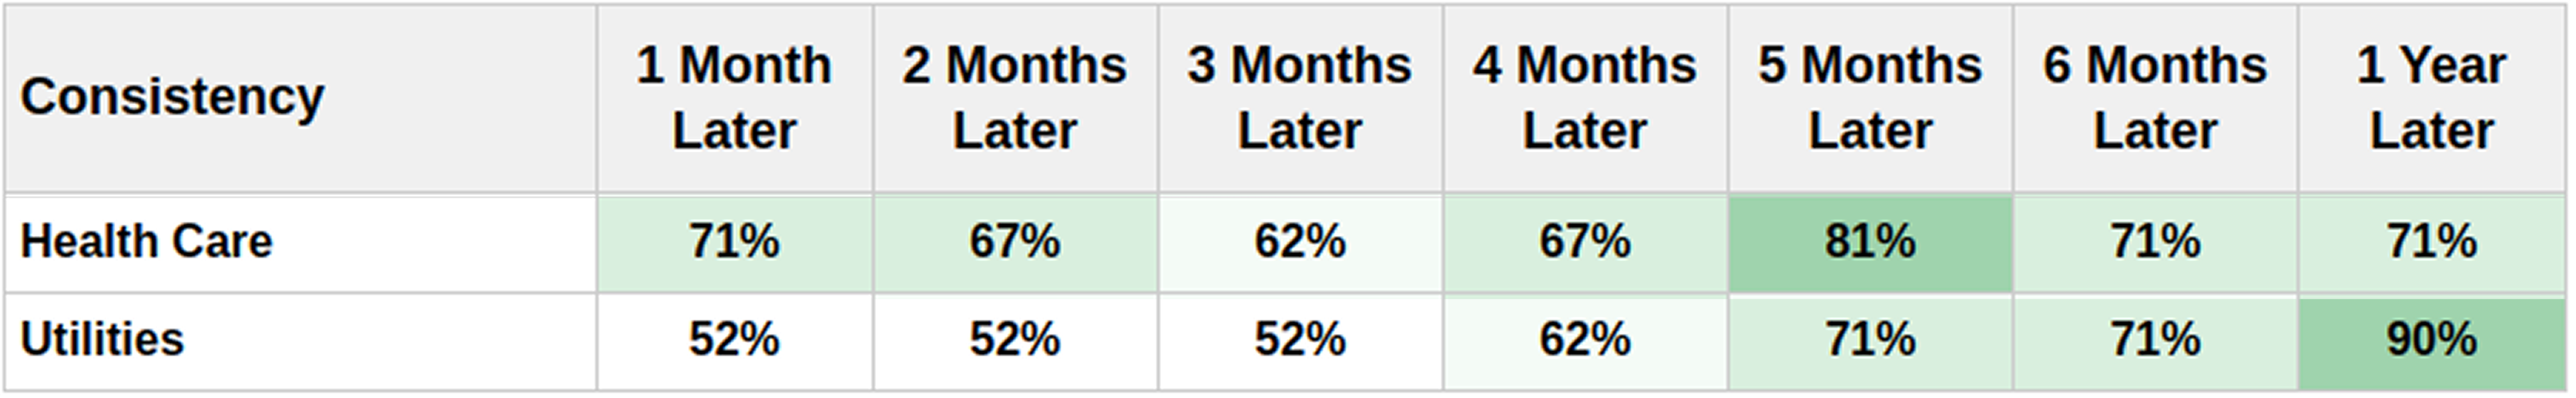
As shown in the figure, after one year, the median return was +10.2%, with a win rate as high as 90%. The data above paints a picture where investors have recently been abandoning bond-like assets in favor of growth-oriented assets.
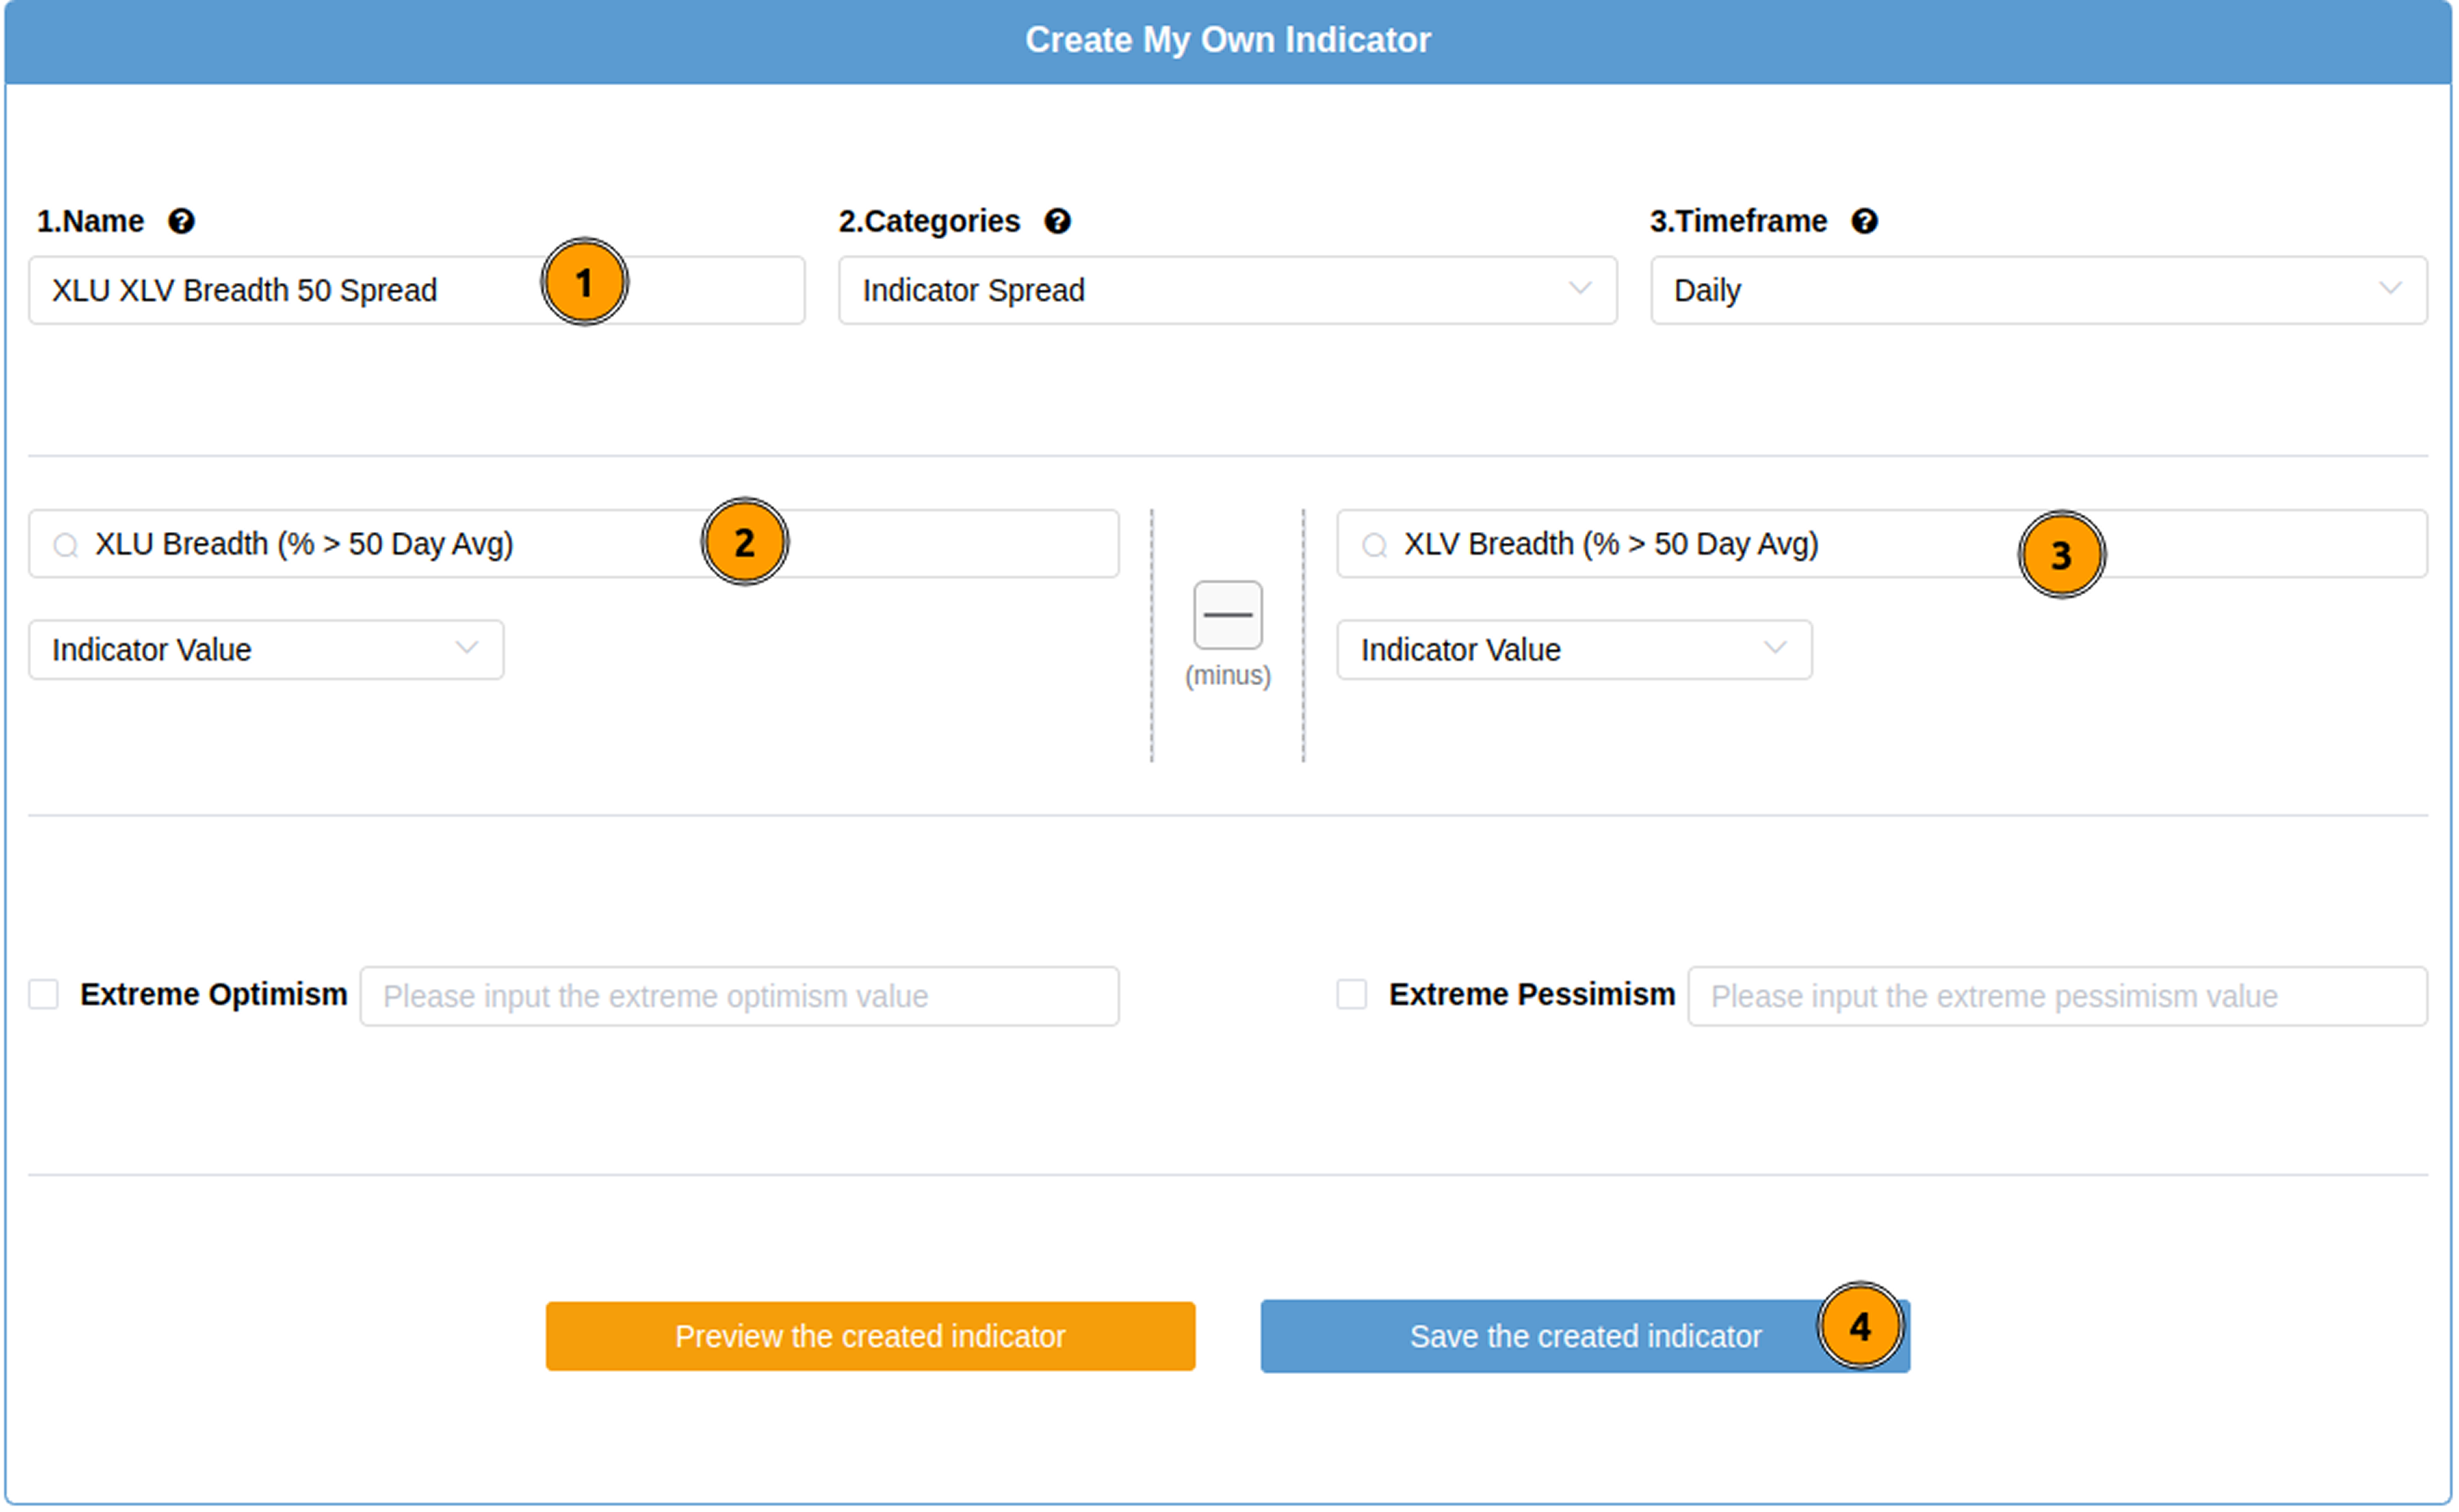
With the "My Indicators" feature, you can replicate this study or nearly an unlimited number of combinations.

After clicking this tab, you can create your own indicator using almost any two metrics from the database. For this test, we only need to perform the following steps:
- Name it arbitrarily, and leave (2) and (3) as "Spread" and "Daily" (default values).
- Enter "xlu", then click "XLU Breadth (% > 50 Day Avg)", and keep the function as "-" (subtraction).
- Enter "xlv" and select "XLV Breadth (% > 50 Day Avg)".
- Click the "Save Created Indicator" button, and we can then use it in backtests.
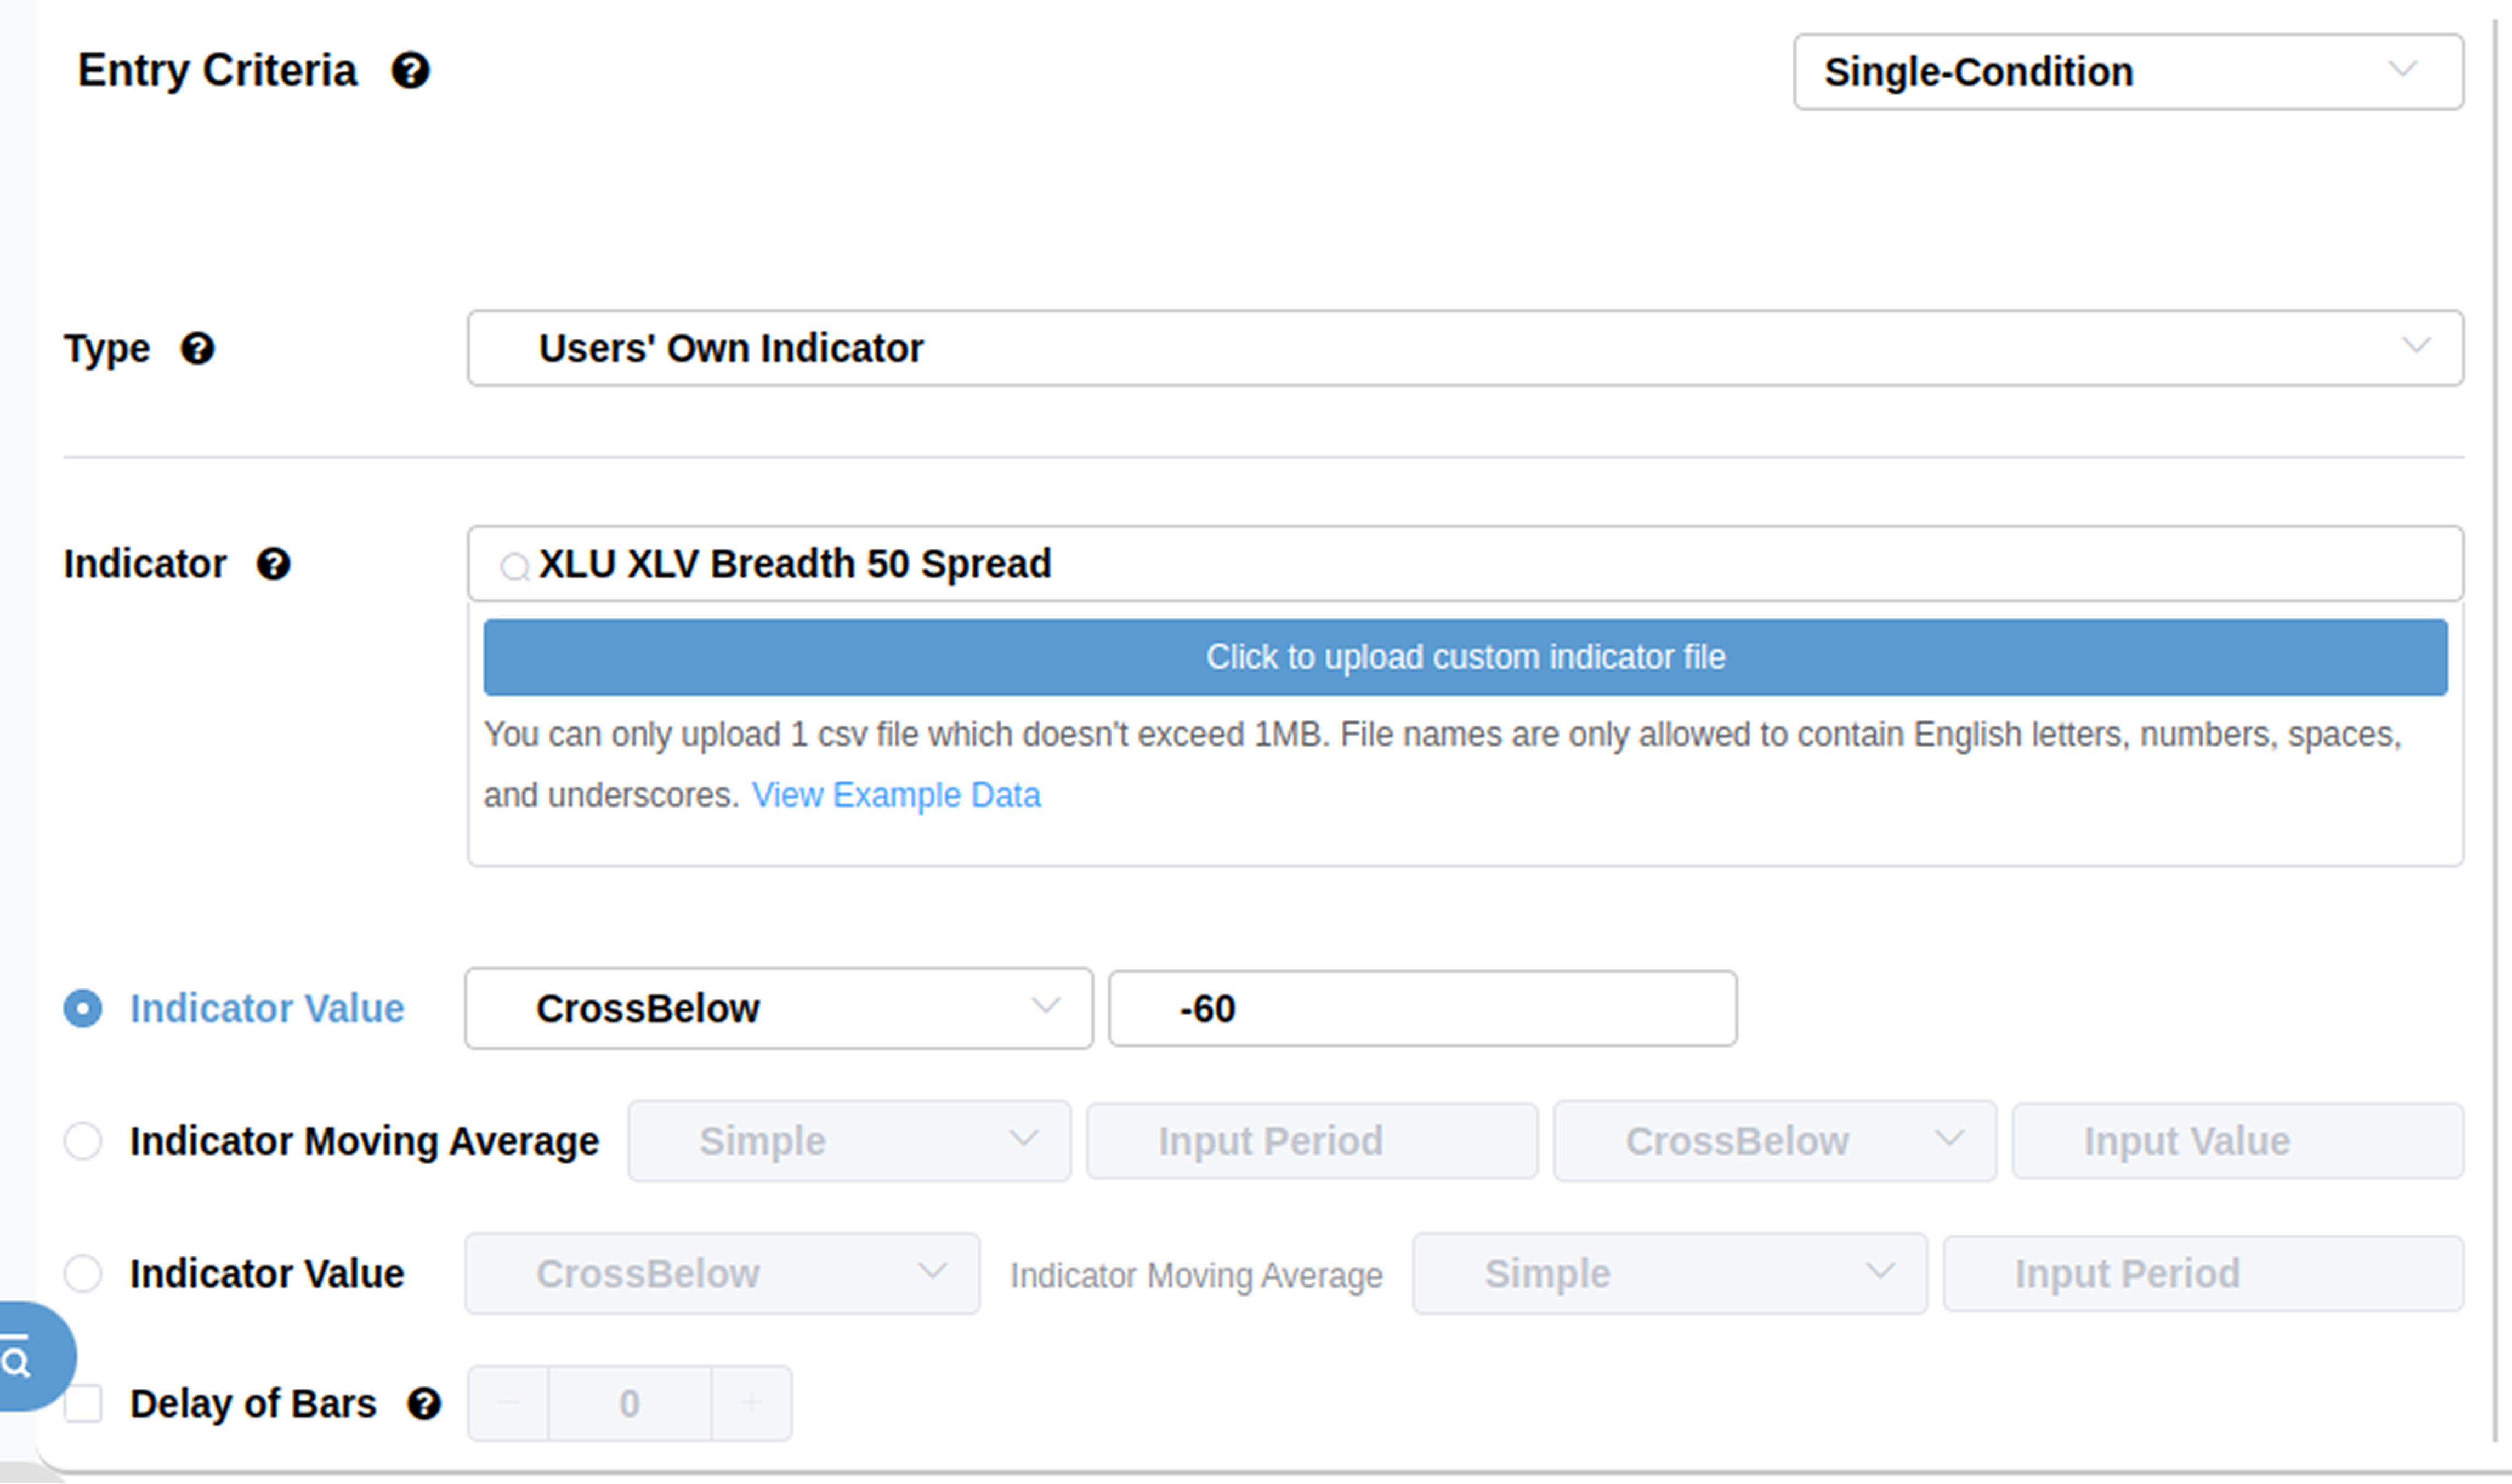
When using the backtesting engine, we simply select the "User-Defined Indicator" type and then choose the indicator we just created from the indicator box.
Back to Utilities
To supplement data on Utilities stocks, the chart below shows how XLU performed historically after its Breadth (% > 50 Day Avg) dropped to 0.
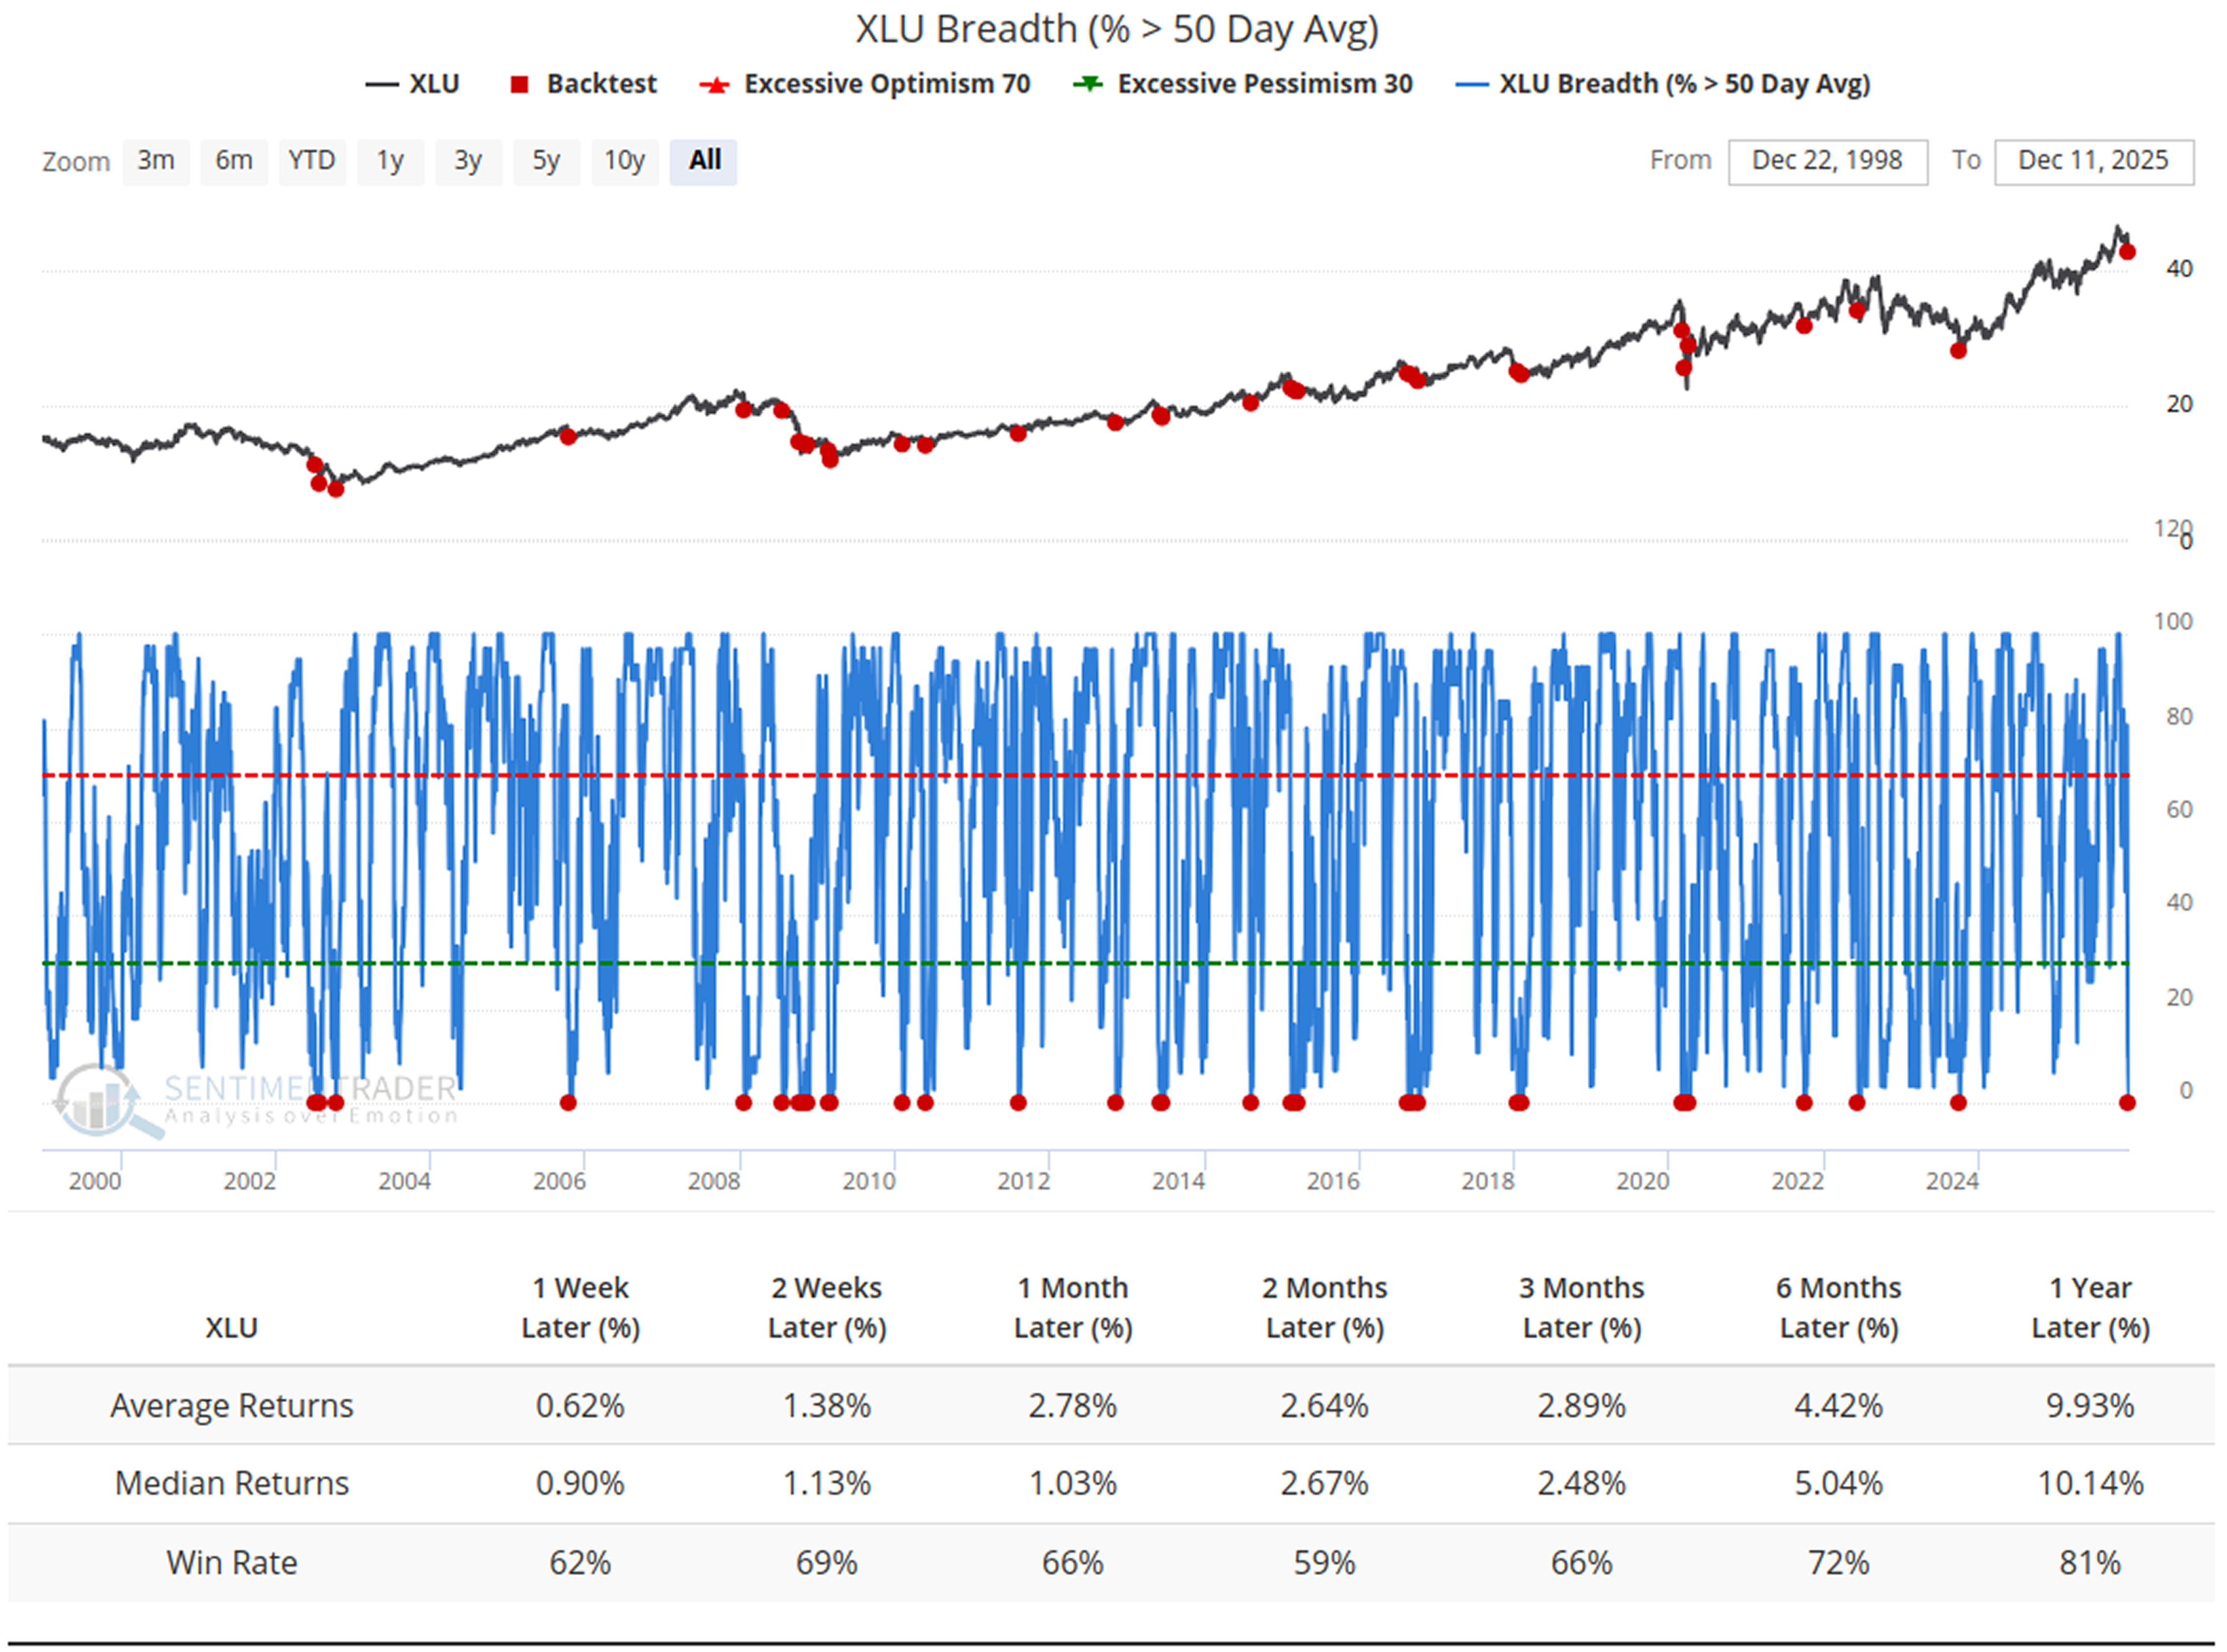
The data shows that one year after the signal triggers, XLU has a win rate of 81%.
What the Research Tells Us...
Data from the Utilities sector has indeed sent warnings in recent weeks. But the data clearly shows that when such a large rift emerges within defensive sectors, capital continues to favor growth sectors over conservative ones.
Despite the dismal performance of Utilities, the S&P 500 still has a 71% probability of rising one year later, indicating that the market remains resilient in this scenario.
It is particularly important to note that the interpretation of signals and market outlook presented in this article for the utilities sector are based on historical data backtesting. The core underlying logic of the market is that "past performance does not guarantee future results." Even though XLU has historically achieved a 90% rebound success rate after breadth indicators reached zero, and the S&P 500 has a long-term probability of rising exceeding 70%, the impact of market pullbacks in extreme scenarios cannot be ruled out.