
The calendar spread strategy for QQQ bulls (and bears)

Key points
- The Nasdaq 100 Index has been the leading U.S. index so far in 2023
- It has recently been creeping higher - some traders expect a continuation, and others expect a sell-off
- Using options can offer traders an inexpensive way to speculate on a continuation rally - or a sharp reversal
The current state of affairs
Ticker QQQ has been trending higher in a narrowing range.
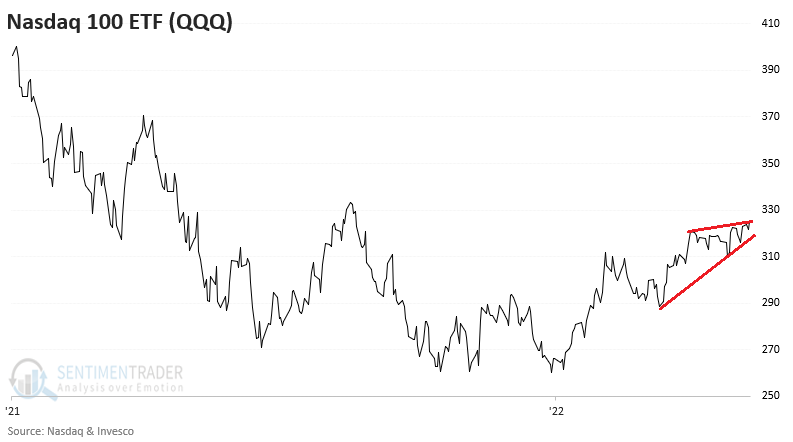
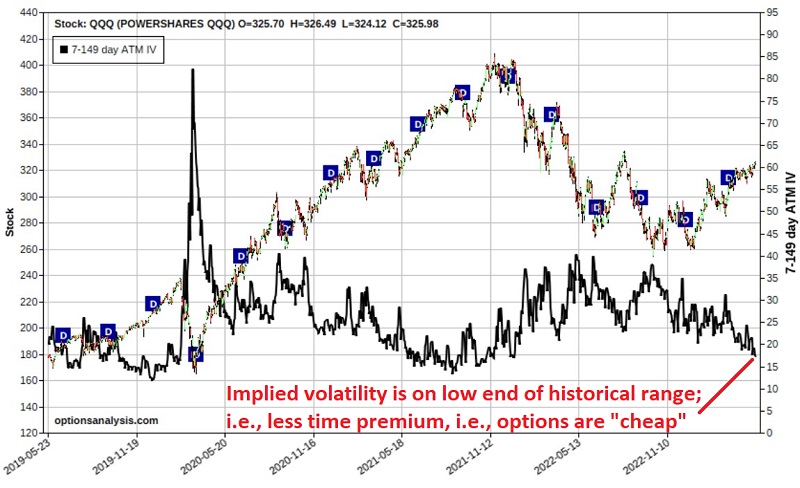
Some traders are looking for a continuation to the upside, while others believe the rally is narrow regarding stock participation and that a sell-off is due. A calendar spread using options on QQQ can allow both camps to express their opinion for a relatively low dollar cost. This strategy can also take advantage of a low-volatility environment. In the chart below (courtesy of Optionsanalysis), option implied volatility (the black line) is towards the low end of the historical range. This tells us that QQQ options are "cheap" (i.e., there is a relatively low amount of time premium built into the price of the options).
The example trades below are not intended as "recommended" trades, only as examples of how to use the strategy based on your outlook for QQQ.
A bullish calendar spread
For our bullish calendar spread example, we will assume the following trade is entered:
- Buy 1 QQQ Sep15 2023 373 call @ $1.78
- Sell 1 QQQ Jul21 2023 373 call @ $0.27
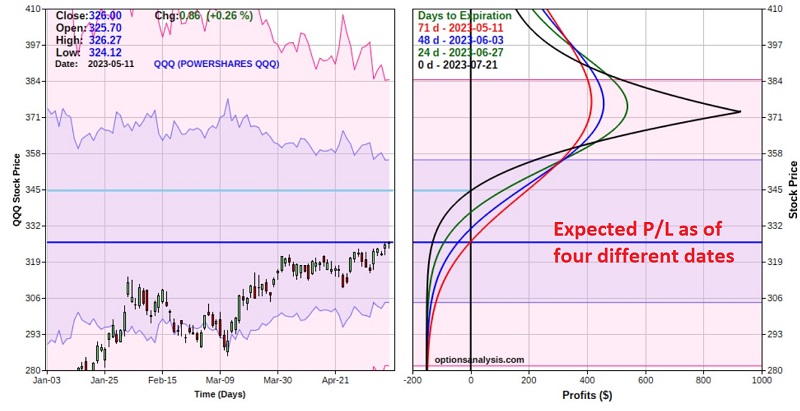
The figure and chart below display the particulars and the risk curves (the expected $ P/L at a given price for QQQ as of four dates leading up to July 21st options expiration), respectively.
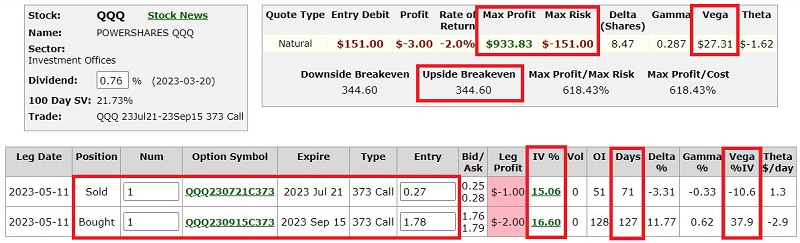
Things to note:
- The cost to enter a 1-lot - and the maximum risk - is $151. A trader with a $25K account willing to risk 2% of capital could trade a 3-lot
- The maximum profit potential is shown as $934. However, note that this would only occur if QQQ closed exactly at $373 a share on July 21st, i.e., highly unlikely
- The lower breakeven price is $345.13 at July 21st expiration. In the meantime, there is immediate profit potential if QQQ rallies sooner than later
- This position has a Greek Vega value of $27.31 - this tells us that for each full percentage point increase in IV, the position will gain $27.31 in value (note that the longer-dated option that we hold will gain $37.91 in value and the shorter-dated option that we sold will lose -$10.60)
- A decline in IV will hurt this position. However, the current IV is already near the low end of the historical range
Managing the trade
The first decision is whether to cut a loss or risk the full $151 (per 1-lot). A trader might decide to exit the trade if the April 25th low of $309.89 is taken out. However, that is just an example. Another trader might use a lower or higher number or no stop.
On the upside, the trader is hoping for a breakout by QQQ. If that happens, this trade can gain value very quickly. A 1-standard deviation move by QQQ to roughly $357 a share would generate an expected open profit of $324 to $240, depending on how soon the move occurs. The trader should consider in advance what market price for QQQ - or what level for a chosen overbought/oversold indicator - might trigger them to take a profit or adjust the trade.
A bearish calendar spread
For our bullish calendar spread, we will assume the following trade is entered:
- Buy 1 QQQ Aug18 2023 285 put @ $3.81
- Sell 1 QQQ Jun30 2023 285 put @ $1.32
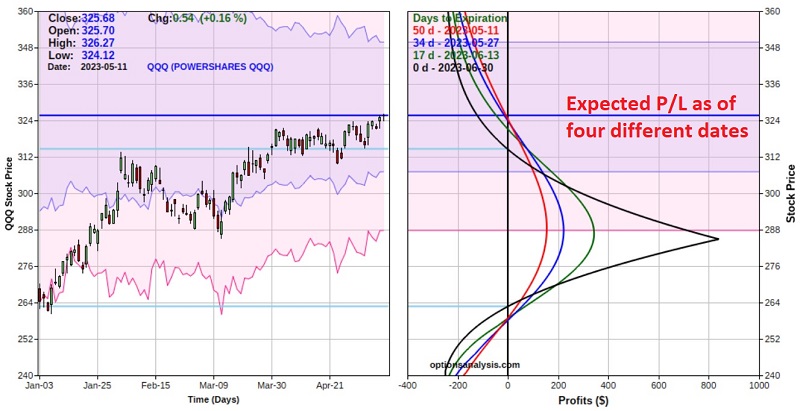
The figure and chart below display the particulars and the risk curves (the expected $ P/L at a given price for QQQ as of four dates leading up to the June 30th options expiration), respectively.
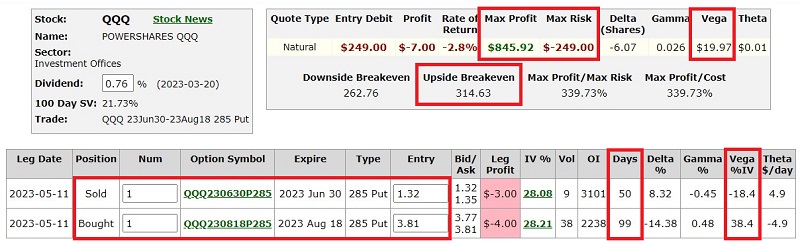
Things to note:
- The cost to enter a 1-lot - and the maximum risk - is $249. A trader with a $25K account willing to risk 2% of capital could trade a 2-lot
- The maximum profit potential is shown as $846. However, note that this would only occur if QQQ closed exactly at $285 a share on June 30th, i.e., highly unlikely
- The upper breakeven price is $314.34 at the June 30th expiration. In the meantime, there is immediate profit potential if QQQ declines sooner than later
- This position has a Greek Vega value of $19.97 - this tells us that for each full percentage point increase in IV, the position will gain $19.97 in value (note that the longer-dated option that we hold will gain $38.37 in value and the shorter-dated option that we sold will lose -$18.40)
- A decline in IV would hurt this position
Managing the trade
The first decision is whether to cut a loss or risk the full $249 (per 1-lot). A trader might decide to exit the trade if QQQ begins to break decisively higher. However, that is just an example. Another trader might use no stop at all.
On the downside, the trader is hoping for a breakdown by QQQ. If that happens, this trade can gain value very quickly. A 1-standard deviation move by QQQ to roughly $308 a share would generate an expected open price of $174 to $104, depending on how soon the move occurs. The trader should consider in advance what market price for QQQ - or what level for a chosen overbought/oversold indicator - might trigger them to take a profit or adjust the trade.
What the research tells us…
In a low-volatility environment, a calendar spread can allow a trader to express a bullish or bearish market opinion - and enjoy significant profit potential - for a relatively low cost. It is beneficial when a trader has a strong opinion about price direction but is hesitant to commit the capital required to buy (or sell short) shares of the underlying stock or ETF.