Products
SentimenTrader Trading Tools
‍
Backtest Engine
My Trading Toolkit
Correlation Analysis
Seasonality
Market Prediction
Indicators & Data API
‍
Proprietary Indicators & Charts
Market Data API
Strategies & Scanner
‍
50+ Trading Strategies
Smart Stock Scanner
Smart Option Scanner
Research Reports
‍
Research Solutions
Reports Library
Free Resources
Simple Backtest Calculator
Simple Seasonality Calculator
The Kelly Criterion Calculator
Sentiment Geo Map
Public Research Reports
Education
Sentiment Indicators
Technical Indicators
Pricing
Company
About
In the News
Testimonials
Client Success Stories
Contact
Log inLoginSign up
< BACK TO ALL REPORTS

The calendar is arguing for a dollar breakout

Jason Goepfert
2021-11-08
As the dollar nears an important juncture, it has a seasonal tailwind.

The U.S. dollar is at a make-or-break juncture. And now is the perfect time for it to decide.

The chart below shows a daily chart for UUP (Invesco DB U.S. Dollar Index Bullish Fund) since June 2021. This ETF - which tracks U.S. Dollar futures - has been in a steady uptrend. 

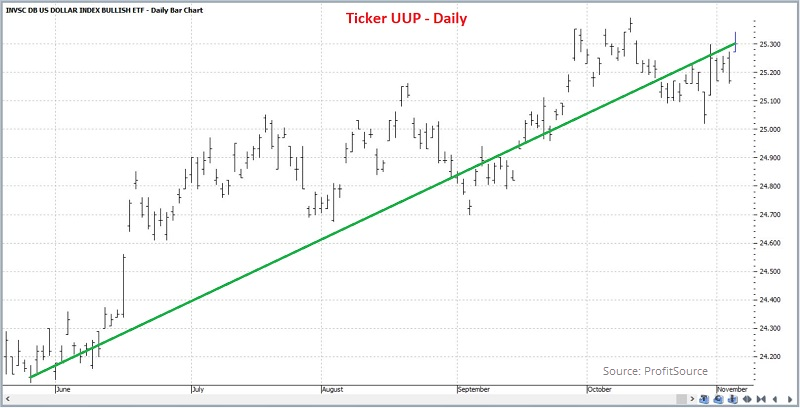
However, if we step back and look at a monthly chart, the recent gain seems far less impressive. One supporting factor for the dollar, though, is seasonality.

The charts below display the Annual Seasonal Trend for a couple of major foreign currencies. My colleague Jay Kaeppel showed in a recent note that they are either in or are soon to enter a period of seasonal weakness.

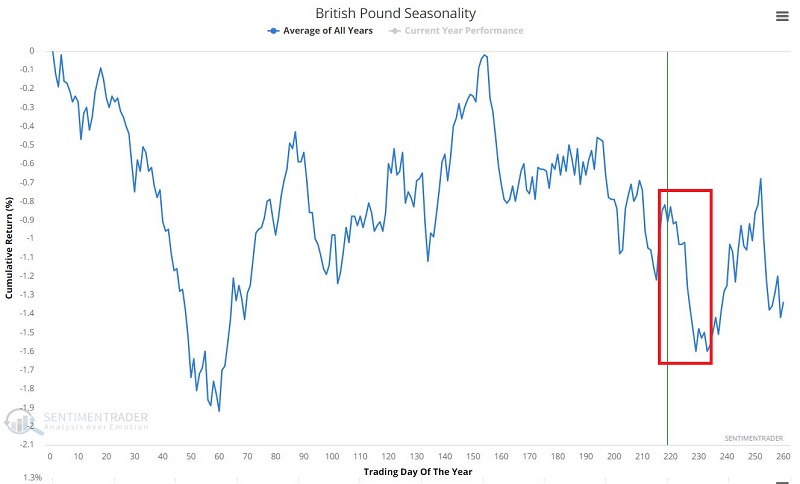
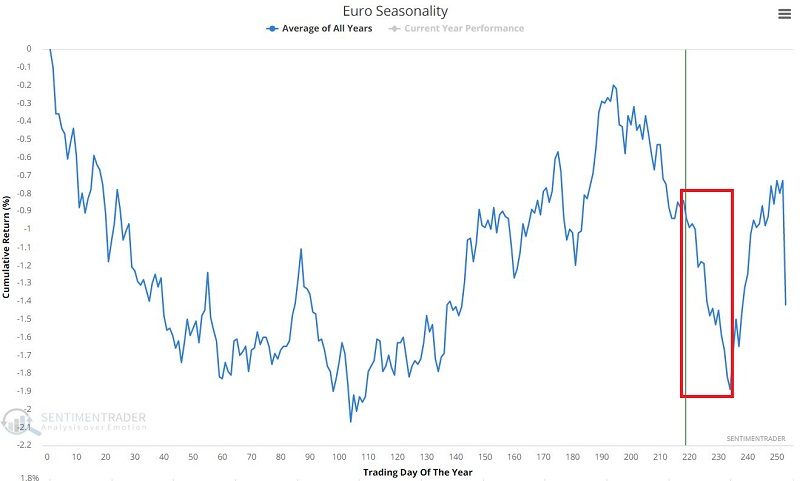
It shouldn't be a surprise that the dollar's seasonal trend is pretty much the opposite of these currencies. So, it has a mostly positive trend and mostly positive seasonality, suggesting the dollar will show strength in the near term.


What else we're looking at

  • A couple of ways to structure options trades to take advantage of the dollar's possible moves
  • "Smart money" traders have a massive bet against stocks

Stat box

As of last Tuesday, commercial hedgers in major equity index futures carried net short exposure worth roughly $79 billion, a record amount dating back 35 years.

Etcetera

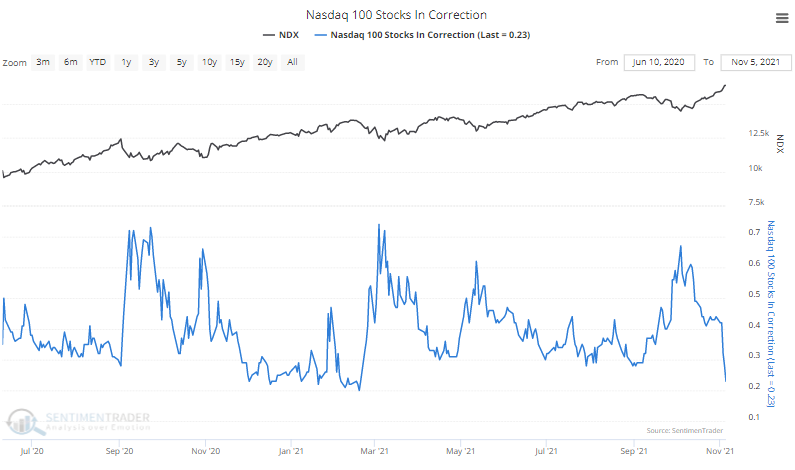
Corrections are correcting. A month ago, nearly 70% of stocks in the Nasdaq 100 were in corrections, down more than 10% from their highs. That figure has plunged recently, and now fewer than 25% of the stocks are correcting, the lowest percentage since February.

Fewer than 25% of Nasdaq 100 stocks are in corrections

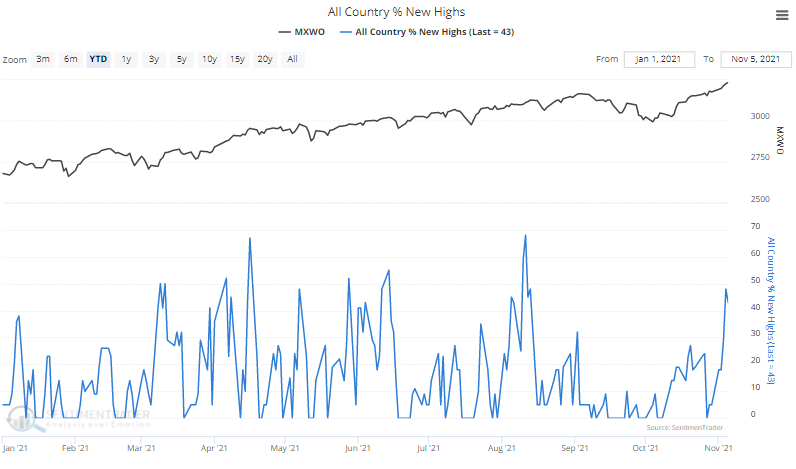
Major indexes are getting high. More than 40% of major global developed market indexes are sitting at 52-week highs, the most since August and among the highest numbers of the year.

More major global equity indexes are hitting new highs

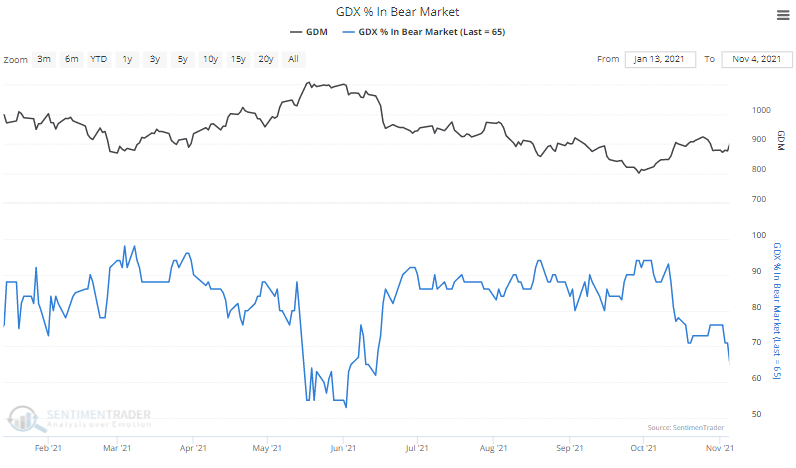
Even gold bugs are happy. Fewer gold mining stocks are mired in downtrends. The percentage of mining stocks in bear markets has dropped from 95% down to 65% in recent days.

Fewer gold mining stocks are in bear markets

PRODUCTS
SentimenTrader
Trading Tools
Indicators & Data API
‍
Strategies & Scanner
‍
Research Reports
FREE
RESOUrCES
Simple Backtest
Calculator
Simple Seasonality
Calculator
The Kelly Criterion
Calculator
Sentiment Geo Map
‍
Public Research Reports
‍
Education
Sentiment Indicators
‍
Technical Indicators
‍
Pricing
Bundle pricing
‍
FAQ
‍
Announcements
‍
COMPANY
‍
About
‍
In the News
‍
Testimonials
‍
Client Success Stories
CONTACT
‍
General Inquiries
‍
Media Inquiries
‍
Financial Professionals Inquiries
‍
© 2026 Sundial Capital Research Inc. All rights reserved.
Setsail Marketing
TermsPrivacyAffiliate Program
Risk Disclosure: The information and tools provided are for research and analytical purposes only and are not intended as investment advice. Market analysis involves uncertainty, and outcomes may differ from expectations. Users should conduct their own due diligence and consider their individual circumstances before making any financial decisions. Past performance is not necessarily indicative of future results.

Hypothetical Performance Disclosure: Hypothetical performance results have many inherent limitations, some of which are described below. No representation is being made that any account will or is likely to achieve profits or losses similar to those shown; in fact, there are frequently sharp differences between hypothetical performance results and the actual results subsequently achieved by any particular trading program. One of the limitations of hypothetical performance results is that they are generally prepared with the benefit of hindsight. In addition, hypothetical trading does not involve financial risk, and no hypothetical trading record can completely account for the impact of financial risk of actual trading. for example, the ability to withstand losses or to adhere to a particular trading program in spite of trading losses are material points which can also adversely affect actual trading results. There are numerous other factors related to the markets in general or to the implementation of any specific trading program which cannot be fully accounted for in the preparation of hypothetical performance results and all which can adversely affect trading results.

Testimonial Disclosure: Testimonials appearing on this website may not be representative of other clients or customers and is not a guarantee of future performance or success.