
The bullish price momentum in Bitcoin could persist

Key points
- Bitcoin has reclaimed the $80,000 level, triggering bullish short-term price analogs that historically boast a perfect win rate over a six-month forward window.
- The Crypto Fear and Greed Index has generated a quantitative reversal buy signal, transitioning from extreme pessimism back into a pro-risk momentum posture.
- Institutional fund flows remain steadily positive, aligning perfectly with Bitcoin entering its most historically bullish seasonal stretch of the trading year.
One of the world's riskiest assets is recovering
Bitcoin has recently staged a rebound, reclaiming the $80,000 level on Tuesday for the first time since January, following a previous drawdown that tested the $60,000 mark.
Using the Correlation Pattern Match tool, let's identify periods in history resembling the price behavior around this pivotal event to see if the current upside momentum will persist.
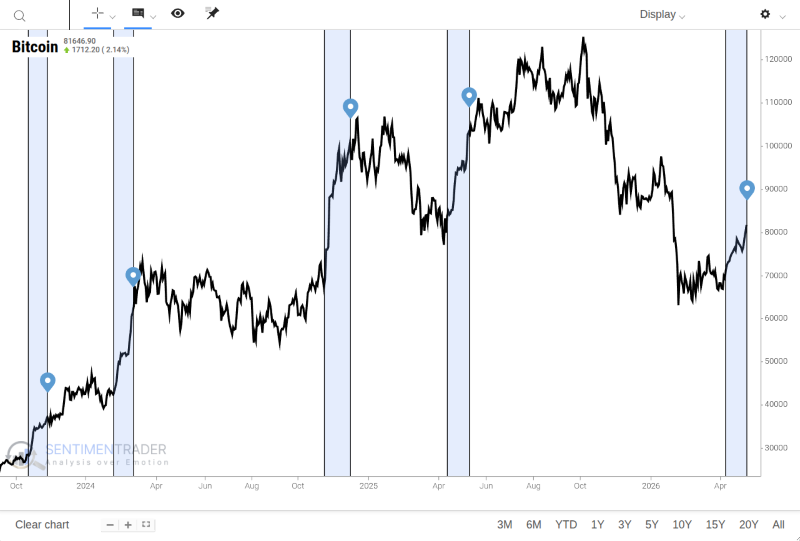
Correlation Parameters
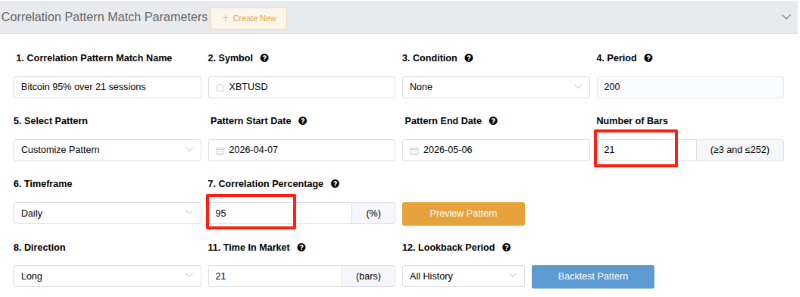
The correlation interface below presents a summary of the parameters we employed to replicate price behavior resembling those of the past 21 sessions. When analyzing short-term time frames, we recommend opting for a high correlation percentage.
Similar price behavior preceded further gains
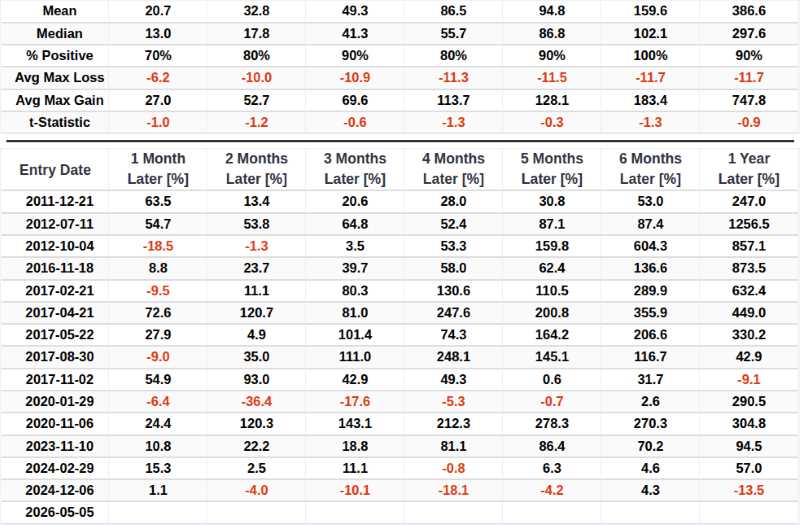
After similar short-term price analogs, like now, Bitcoin displayed excellent returns and win rates across all time horizons. Notably, the six-month forward window has historically boasted a perfect win rate. But there are never any "sure things" in the market. Traders must respect the inherent volatility, as a handful of precedents specifically in 2020 and 2024 required investors to weather substantial drawdowns.
The Crypto Fear and Greed Index
This model, created by Alternative.me, calculates a weighted sentiment measure for bitcoin by aggregating five sources: 1) Volatility, 2) Momentum and volume, 3) Social media, 4) Surveys, and 5) Dominance.
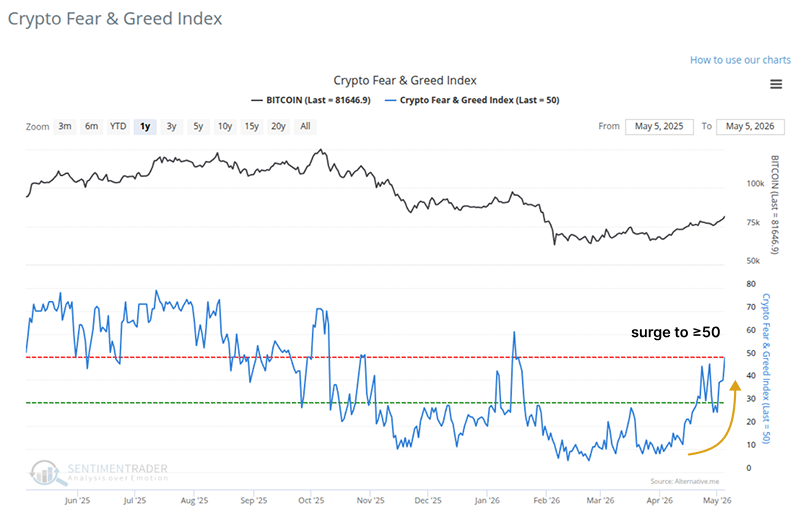
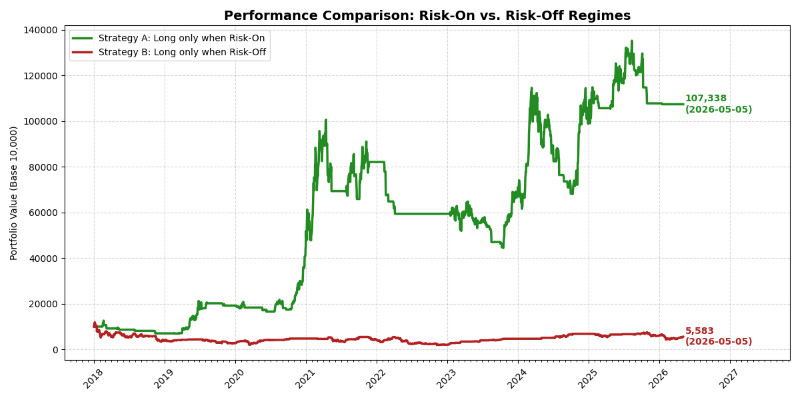
Higher model readings indicate stronger market optimism toward Bitcoin. We define an environment where the index sits at or above 50 as a structural tailwind for the asset. Conversely, readings below 50 reflect a bearish headwind. To quantify this edge: if an investor deployed $10,000 into Bitcoin only when the Crypto Fear and Greed Index was at or above 50, that capital would have compounded to $107,338. In stark contrast, deploying the same capital only when the index was below the 50 threshold would have eroded the investment to a mere $5,583.
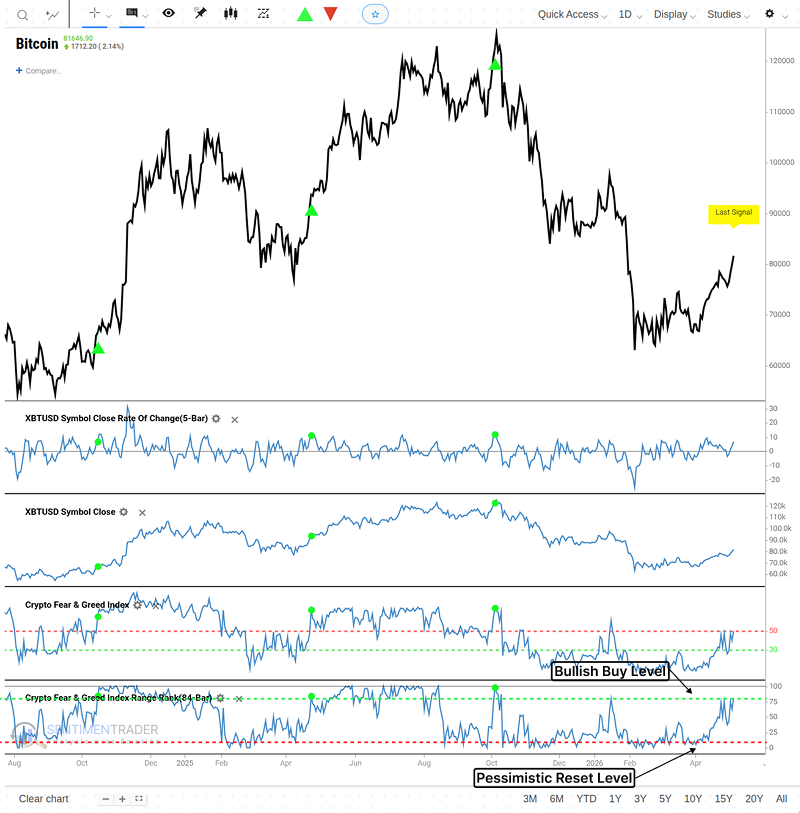
A trading system that identifies a reversal in the Crypto Fear & Greed Index
The trading system ranks the fear and greed index range over the trailing 84-day lookback period. 100 is the highest, and 0 is the lowest. The pessimistic reset condition is confirmed when the range rank indicator crosses below the 15th percentile. A new buy signal triggers when the range rank exceeds the 80th percentile. Furthermore, the 5-day rate of change for Bitcoin must be >= 5%. i.e., market momentum is positive.
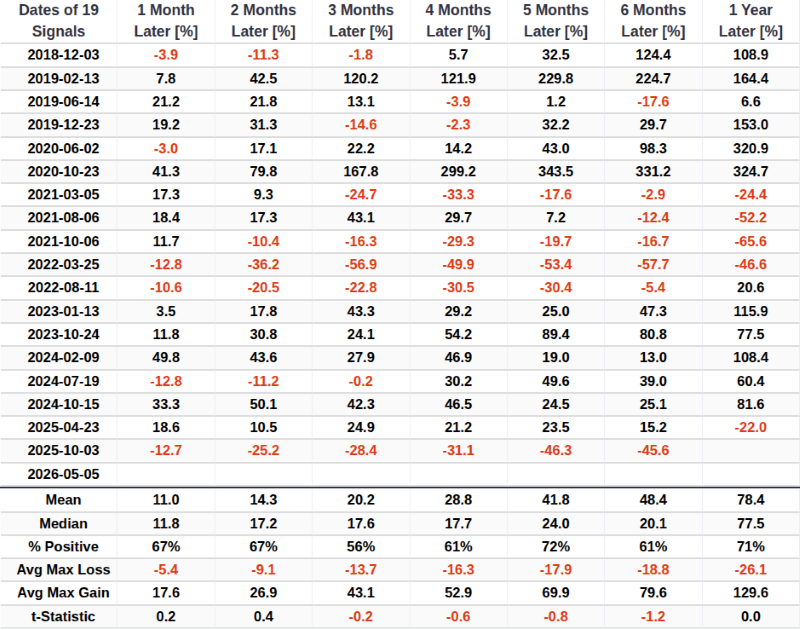
Over the past eight years, this specific signal has triggered 19 times. Following these alerts, Bitcoin's forward returns, win rates, and overall risk/reward profile have been historically robust. However, given the inherently high-beta nature of the cryptocurrency market, risk management remains paramount as evidenced by the severe drawdowns observed during the 2021-2022 and 2025 bear market cycles.
Financial products tracking Bitcoin's volatility have gained significant traction this year. The Chicago Mercantile Exchange (CME), the world's leading derivatives marketplace, recently announced plans to launch Bitcoin volatility futures. These instruments will allow institutional and retail investors alike to hedge against wild price swings or express directional views on implied volatility. For further details on Bitcoin volatility futures, visit here.
Bitcoin's price momentum shifts to a favorable trend
Bitcoin's high volatility makes it an ideal candidate for momentum trading. The digital currency frequently experiences significant price swings that present numerous trading opportunities. With Bitcoin's rapid shifts, traders can leverage momentum strategies to capture upward and downward moves.
The Relative Strength Index (RSI) is particularly well-suited for detecting these momentum shifts, as it measures the speed and degree of price movements. With Bitcoin's RSI currently breaking above the 70 threshold, let's run a quick backtest to evaluate how the asset historically digests these overbought momentum thrusts.
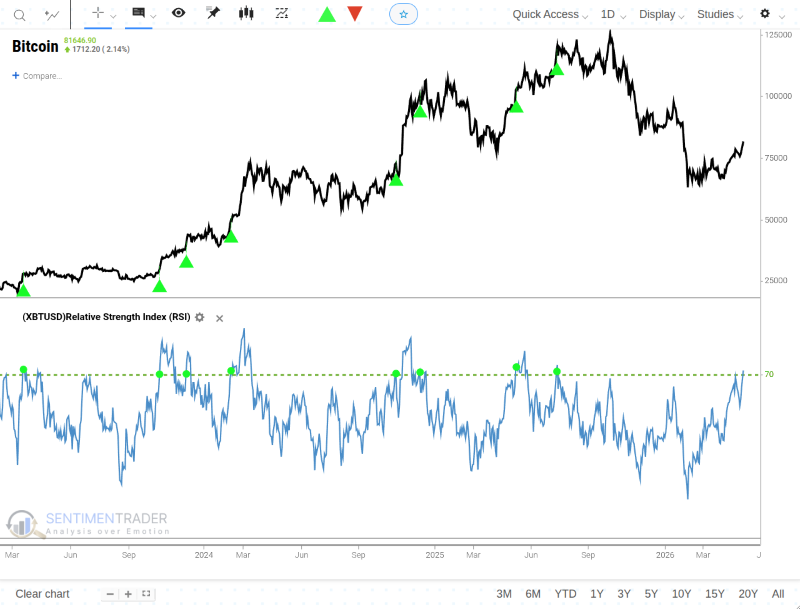
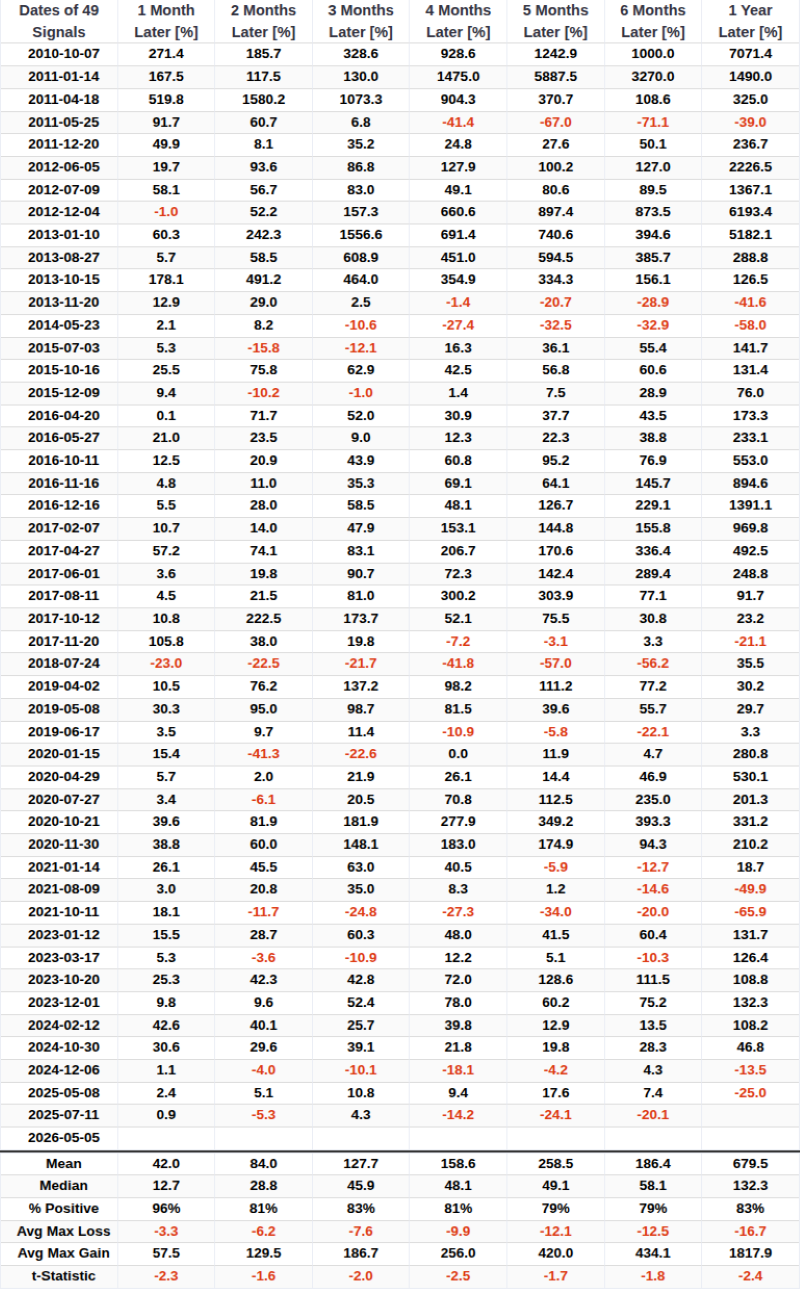
The table below catalogs the entry dates for each signal alongside the forward returns across various timeframes. When Bitcoin's RSI surges past 70, this highly volatile asset historically delivers a staggering 96% win rate over the subsequent one-month window. It is crucial to note, however, that the magnitude of recent returns has compressed significantly compared to Bitcoin's early adoption phase. Traders should calibrate their upside expectations accordingly.
Fund flows
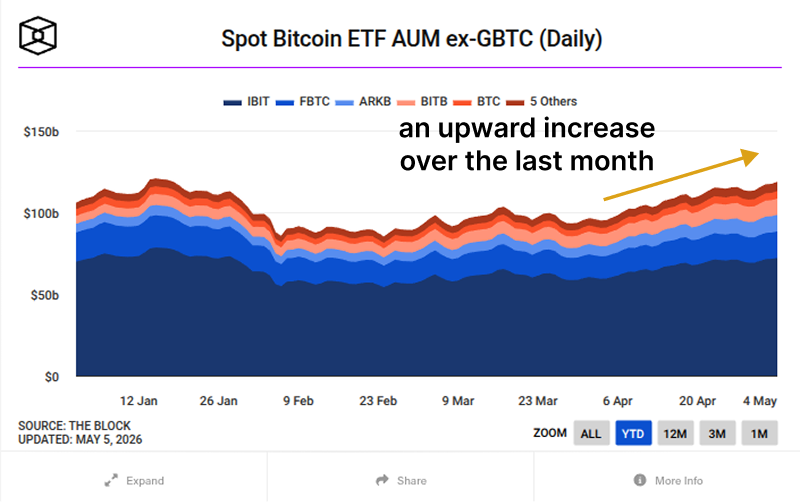
Arguably, fund flows are the most bullish factor for Bitcoin, with the chart below showing a steady upward increase over the last month. If you are interested in other charts like the one below from The Block, click here.
Seasonality
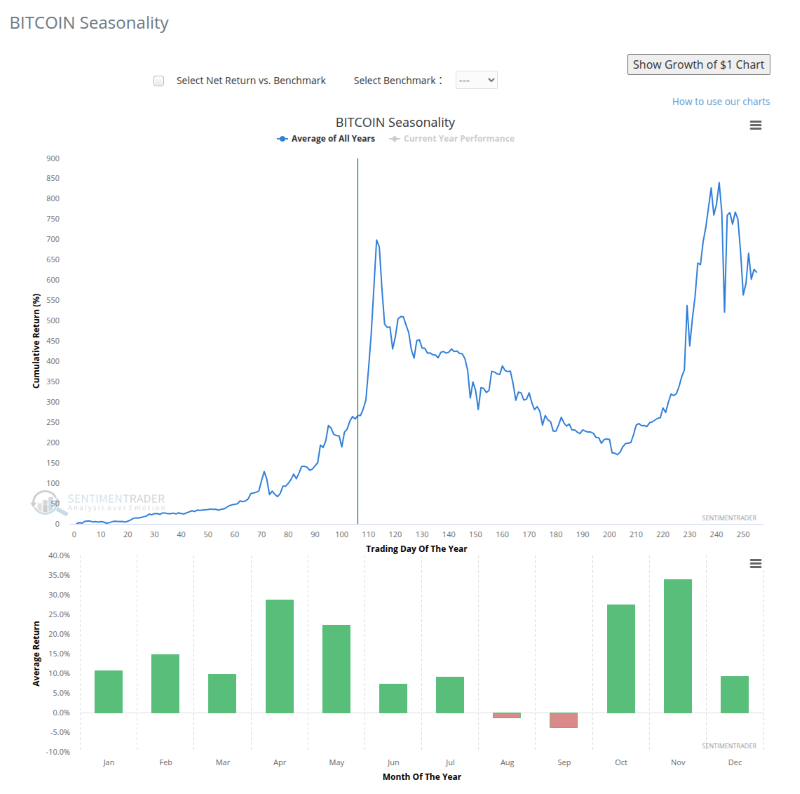
Bitcoin exhibits an extremely bullish seasonal bias in the first 113 trading days of the year. If historical patterns repeat, Bitcoin is currently entering its most structurally favorable trading window of the year.
What the research tells us...
Using the Correlation Pattern Match tool to compare the current price behavior to other similar historical periods suggests Bitcoin can go higher. After similar analogs, Bitcoin was higher over the subsequent six months, 100% of the time. Quantitative metrics suggest that the asset is resuming a durable primary uptrend. While the magnitude of forward returns has naturally compressed, the structural trend and high win rates remain bullish. But there are never any "sure things" in the market. Proper risk management is imperative for successfully navigating the markets. That's especially the case when trading a highly volatile asset like Bitcoin.