
The bull market is long, strong, and showing some early cracks

Key points:
- The major indices have been rallying for years and are hovering near record highs
- Such impressive bull markets are nearing historic levels, especially in the Dow and Nasdaq
- Investors have started to hesitate, with seven straight days of negative breadth
A long, strong bull market
Last week, we saw that the "four horsemen" indices are extended well beyond their all-time exponential trends. Well, except for the small-cap Russell 2000, which is only now scrambling back to its long-term trendline.
Those trends only considered price, not time. So, let's rectify that and see if it clarifies the picture at all. If a trend can persist, instead of just jumping fast and flaming out, then perhaps it's more likely to last.
We're going to round to the nearest round number. The S&P 500 just reached 540 trading days since its last 252-day low. That's among the longer streaks, though it has lasted far longer between new lows.
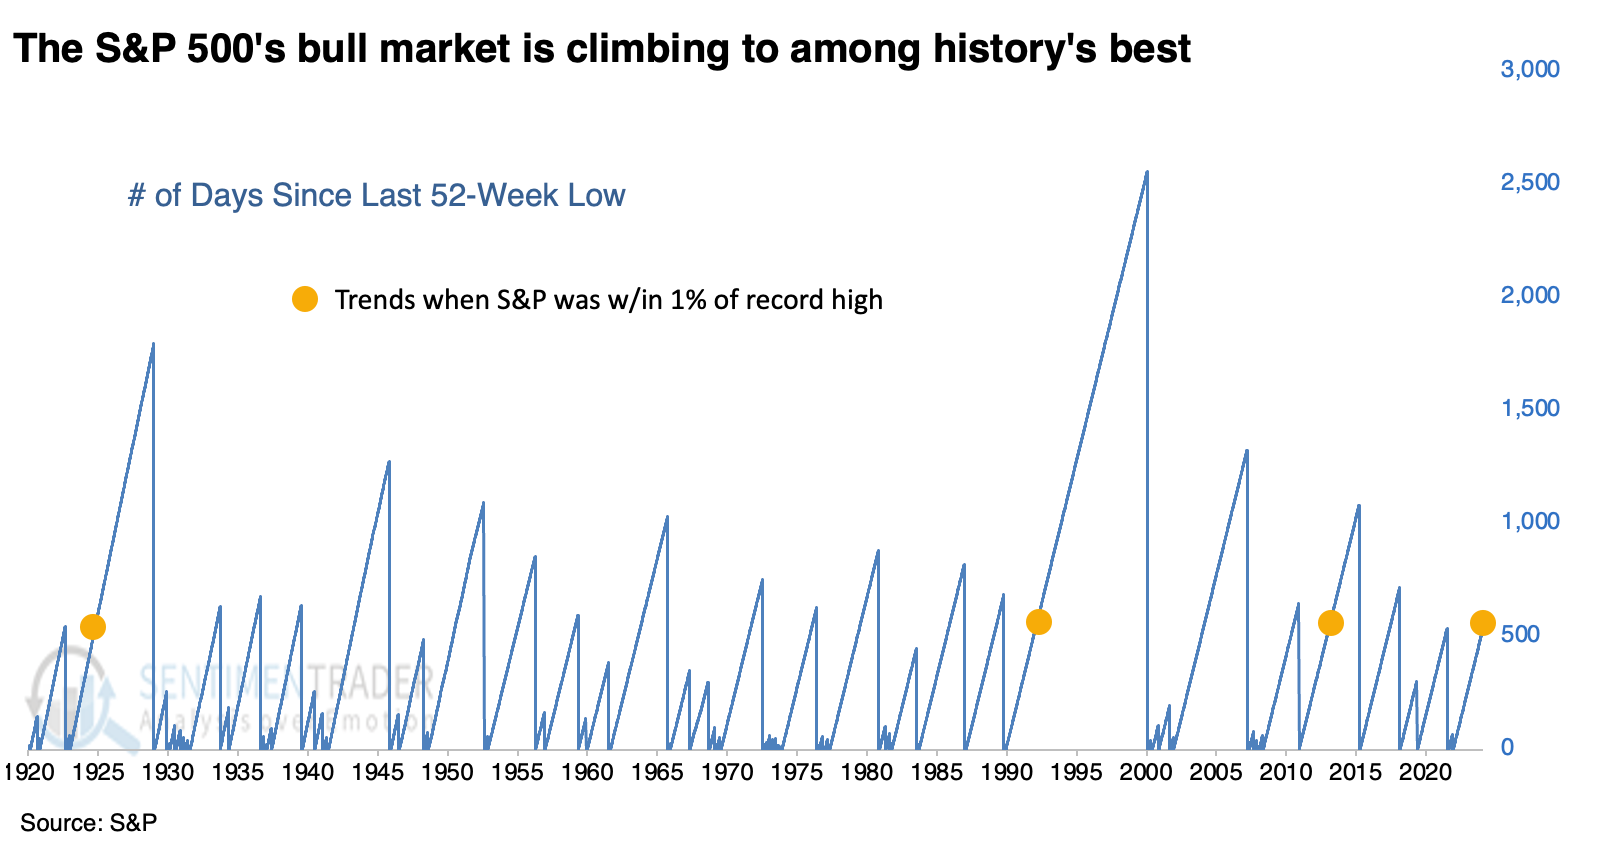
Even more impressive is that the S&P is flirting with record highs at this point of the trend. The only trends when the S&P was within 1% of a record high at 540 days after a low were August 1925, November 1992, and November 2013. It added to its gains after all three.
Long streaks may be a concern, especially for the Nasdaq
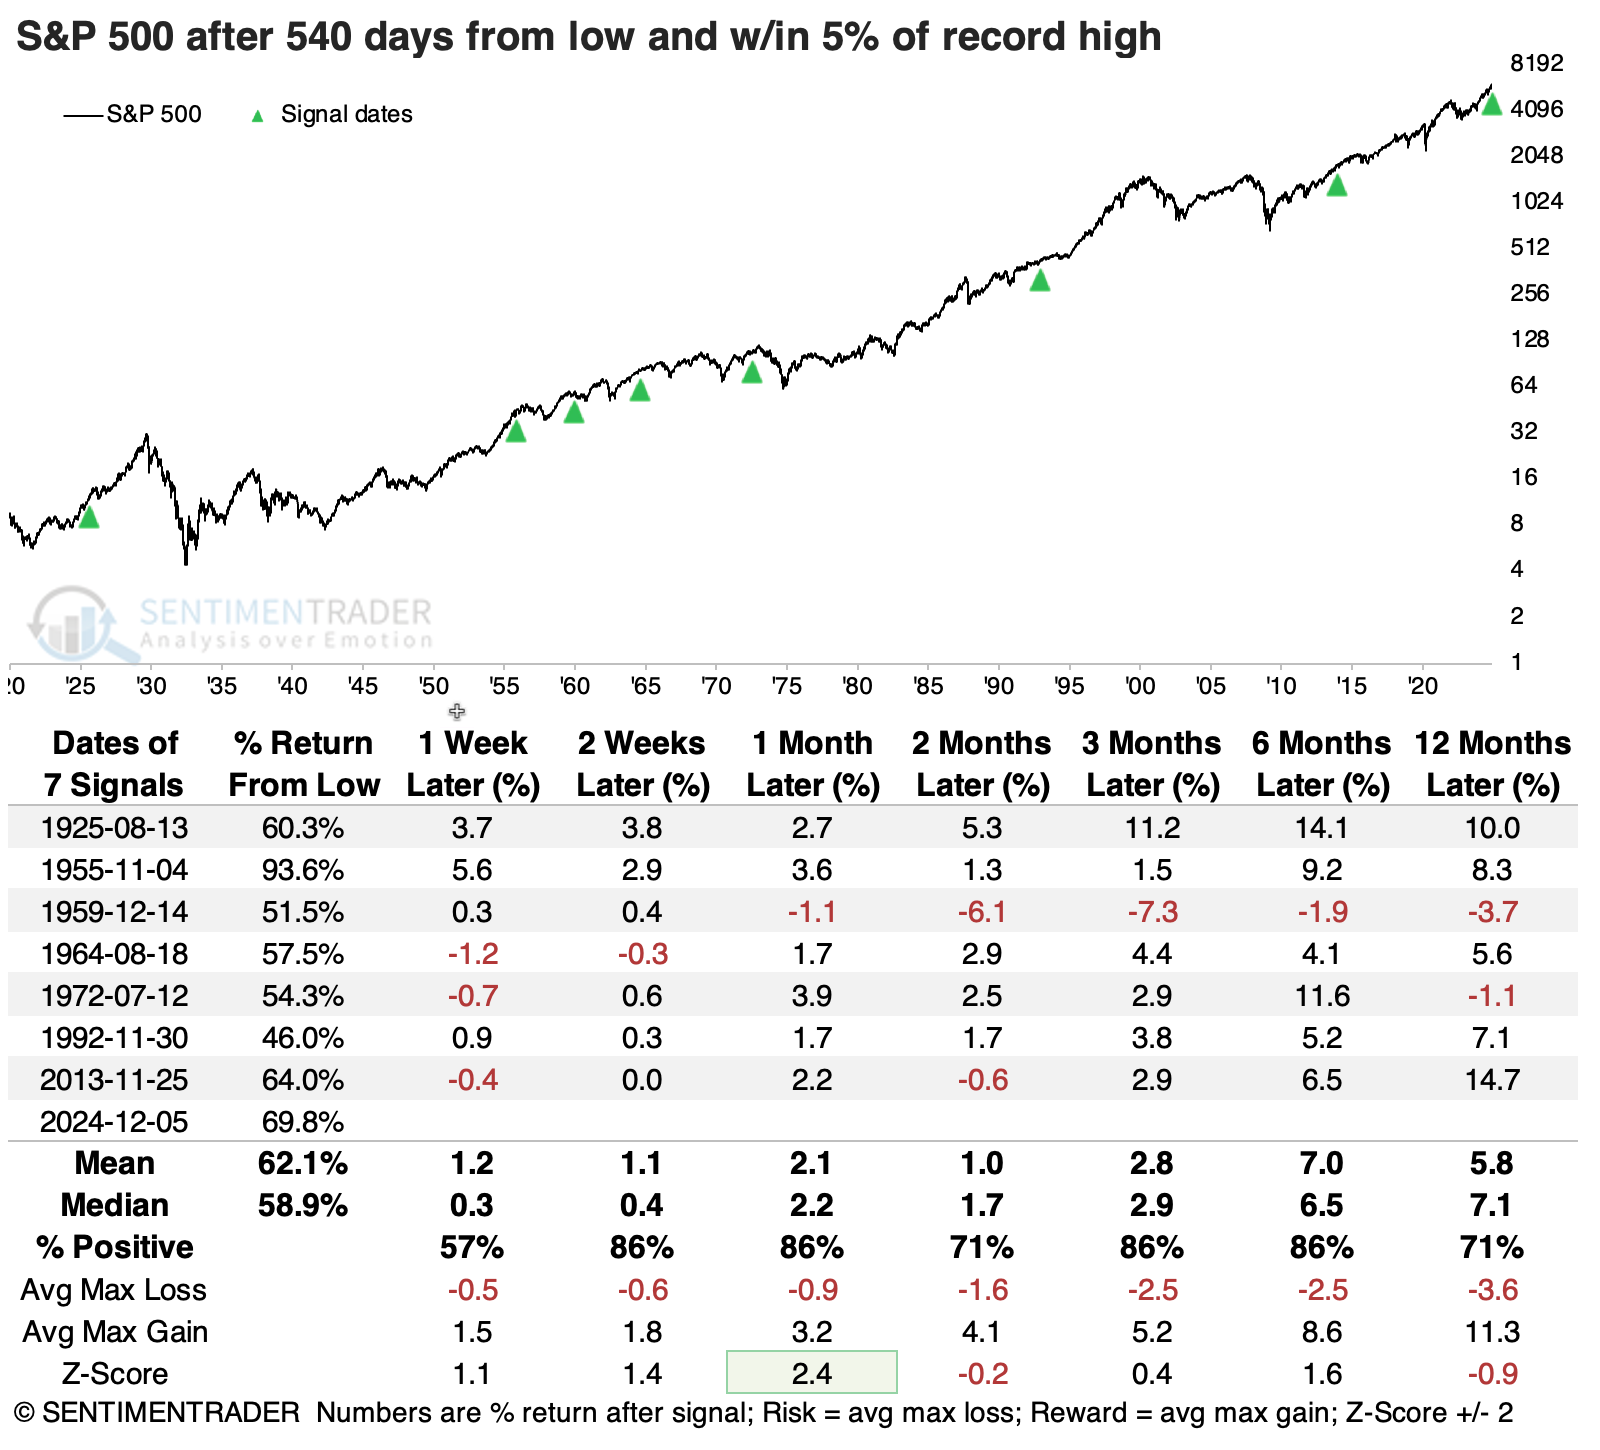
Below, we can see every time the S&P hit 540 days since a low and was within 5% of a record high. Its returns going forward were good, especially over the following month. But in the months following, returns were inconsistent and meandered around random. A few saw strong long-term gains, while the signals of the 1950s-70s did not.
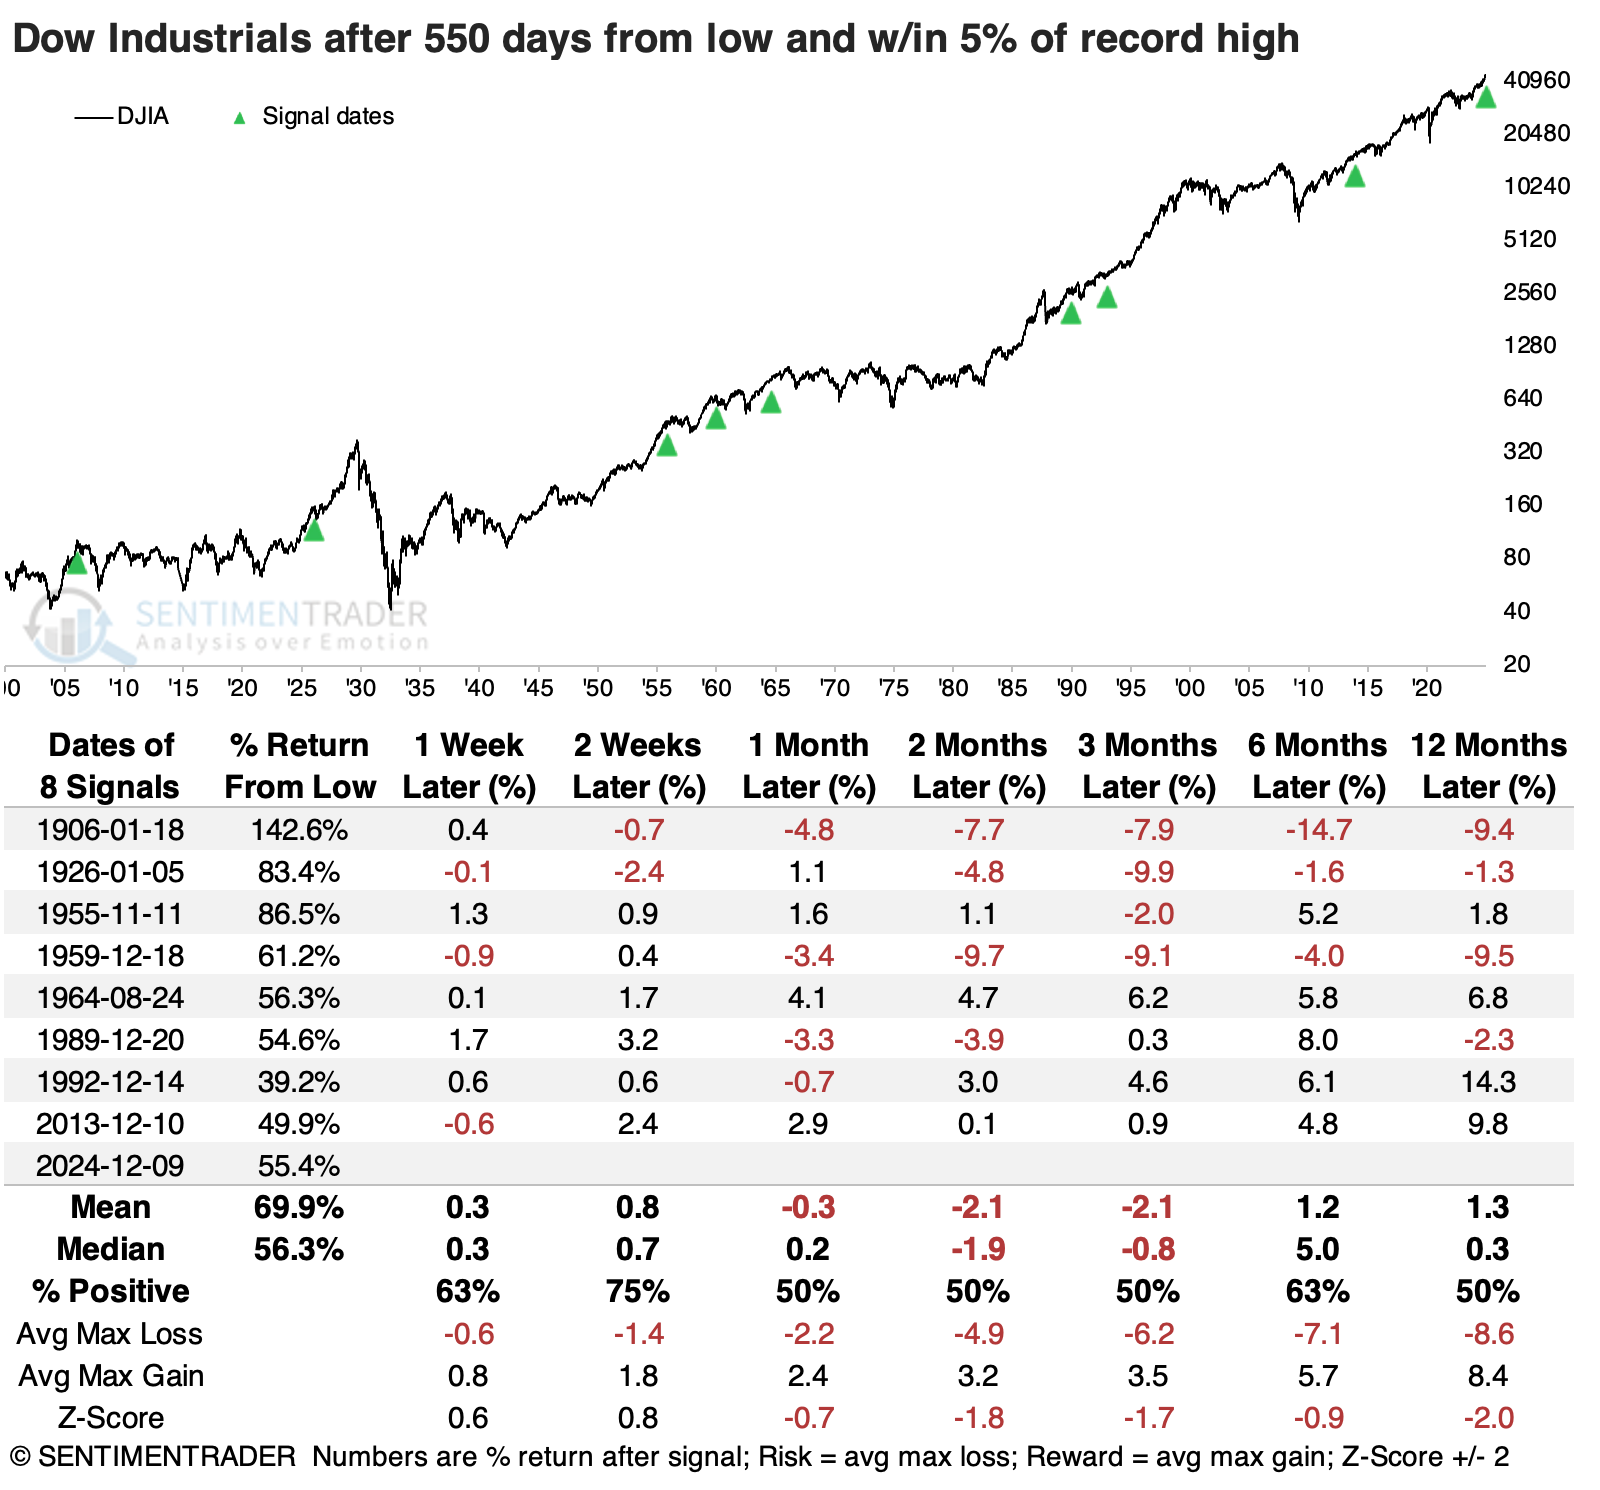
The Dow Industrials was the most stretched relative to its long-term trend. That index has lasted 550 days since its last 252-day low. We can see below that the Dow showed mediocre returns over the medium term following similar strong and persistent trends. All but two signals showed a negative return between one and three months later.
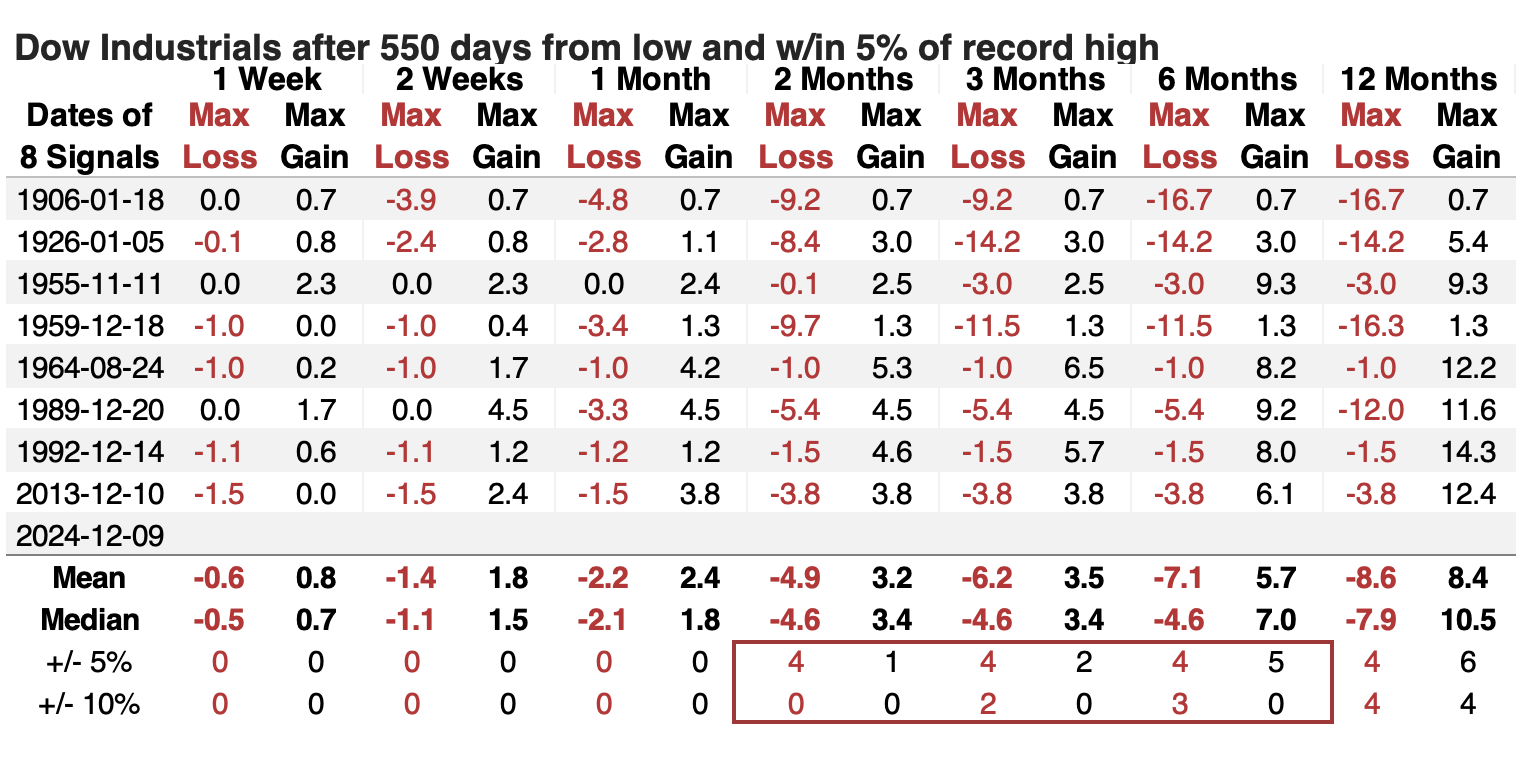
The table of maximum gains and losses across time frames shows that large losses tended to dominate. Within the next two months, four losses were larger than -5% and only one gain was larger than +5%.
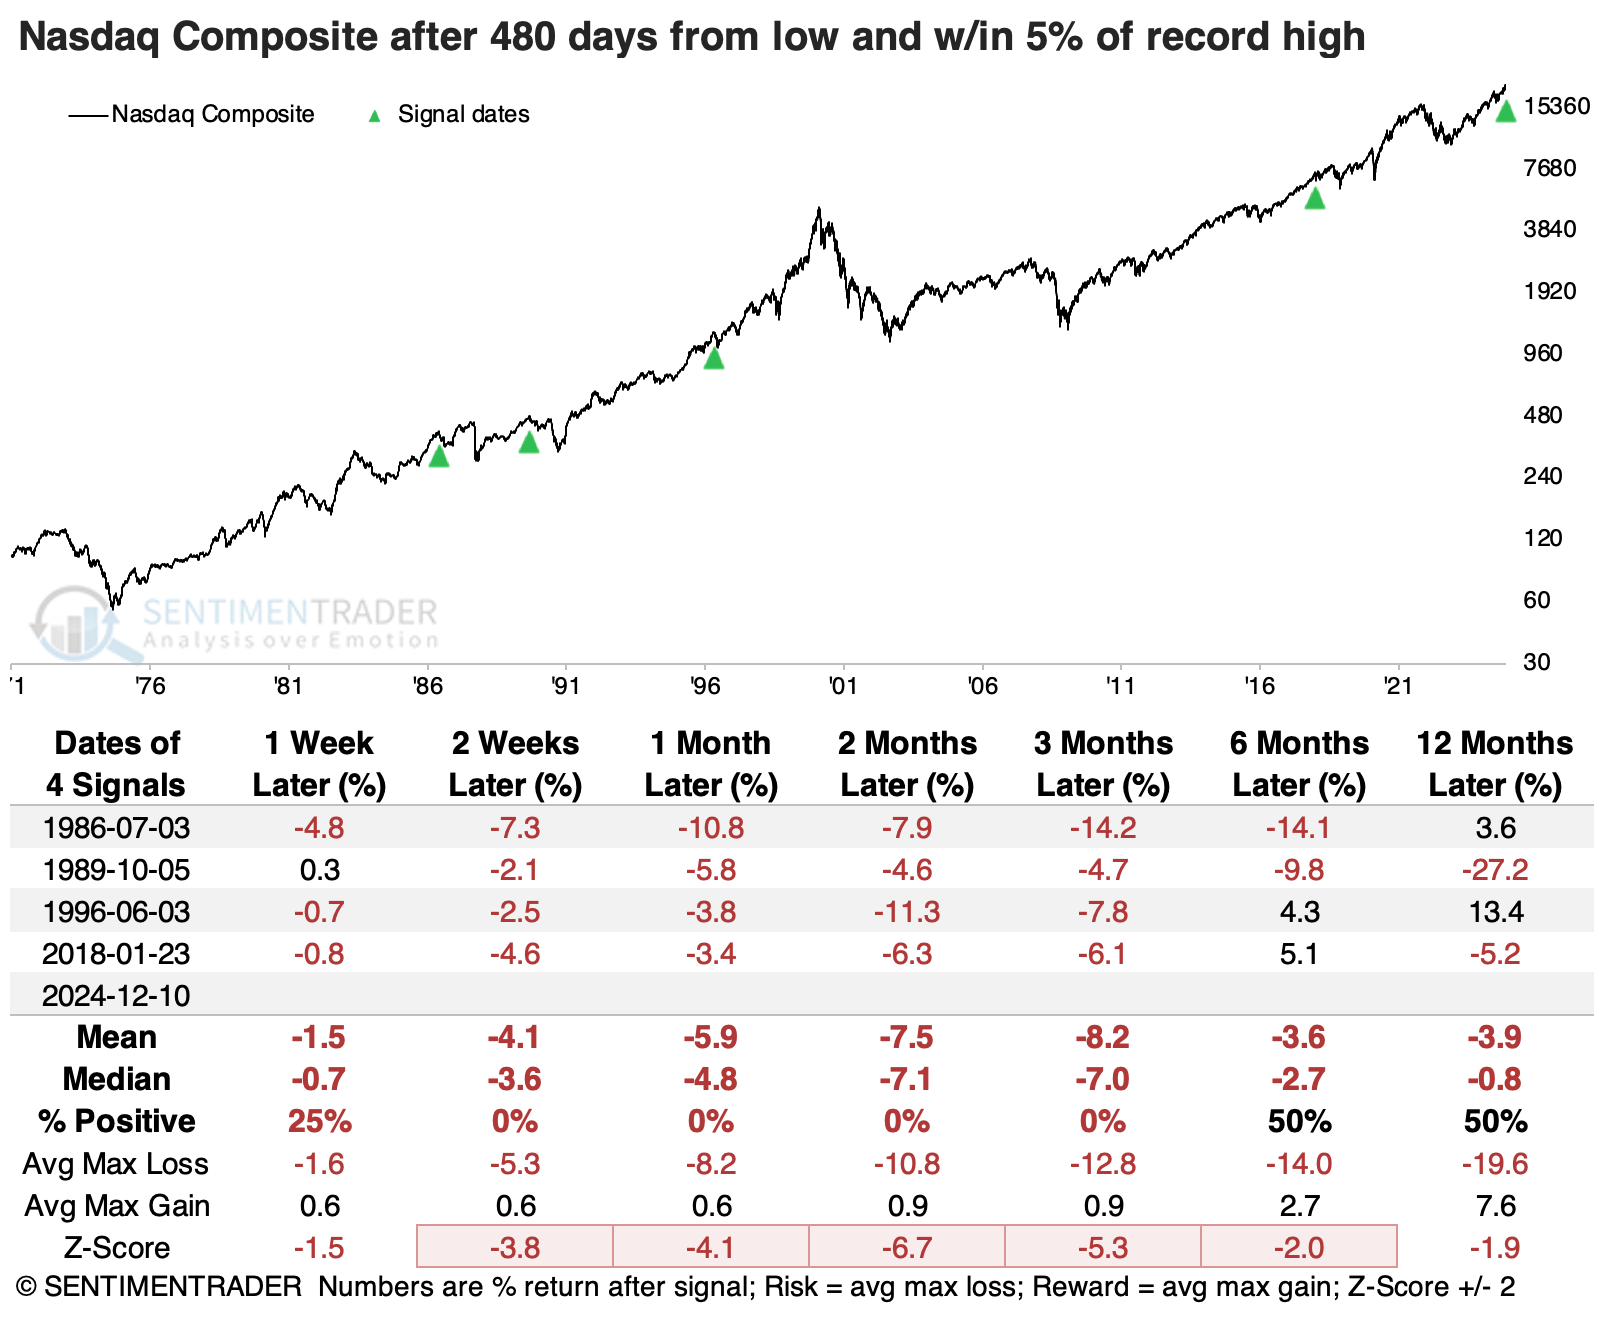
The Nasdaq Composite has gone 480 days since its last low. Since that index is more volatile, it hasn't been able to go as long between new lows, so this is rare. Only four other times did the Composite last this long since a low and was within 5% of a record high. Unfortunately for bulls, every single one witnessed losses in the index over the next few months.
Within the next two months, they all suffered losses larger than -5%, while none enjoyed gains larger than +5%.
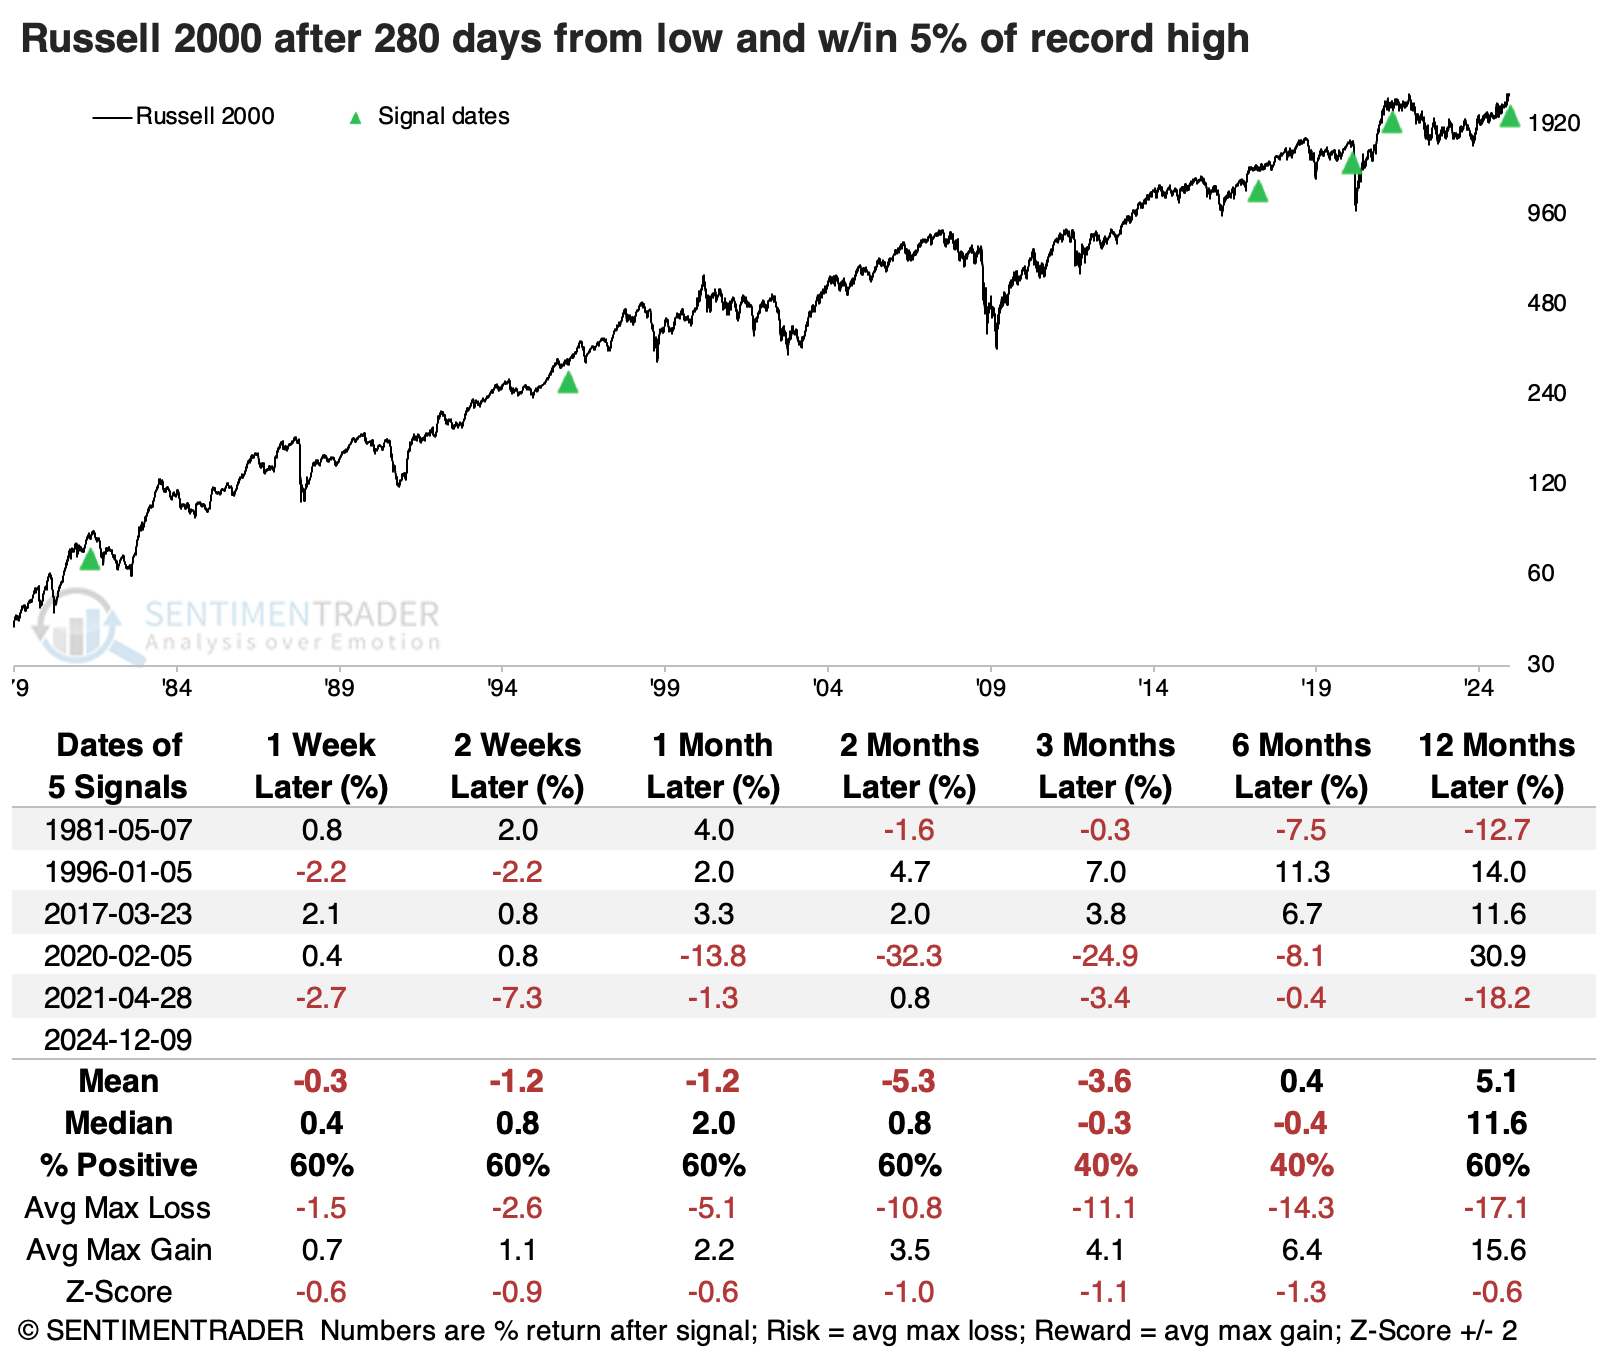
Unlike the other indices, the Russell 2000 fell to new lows in October 2023, so that index is only 280 days since its last low. Even so, the trends petered out three times while strengthening two times.
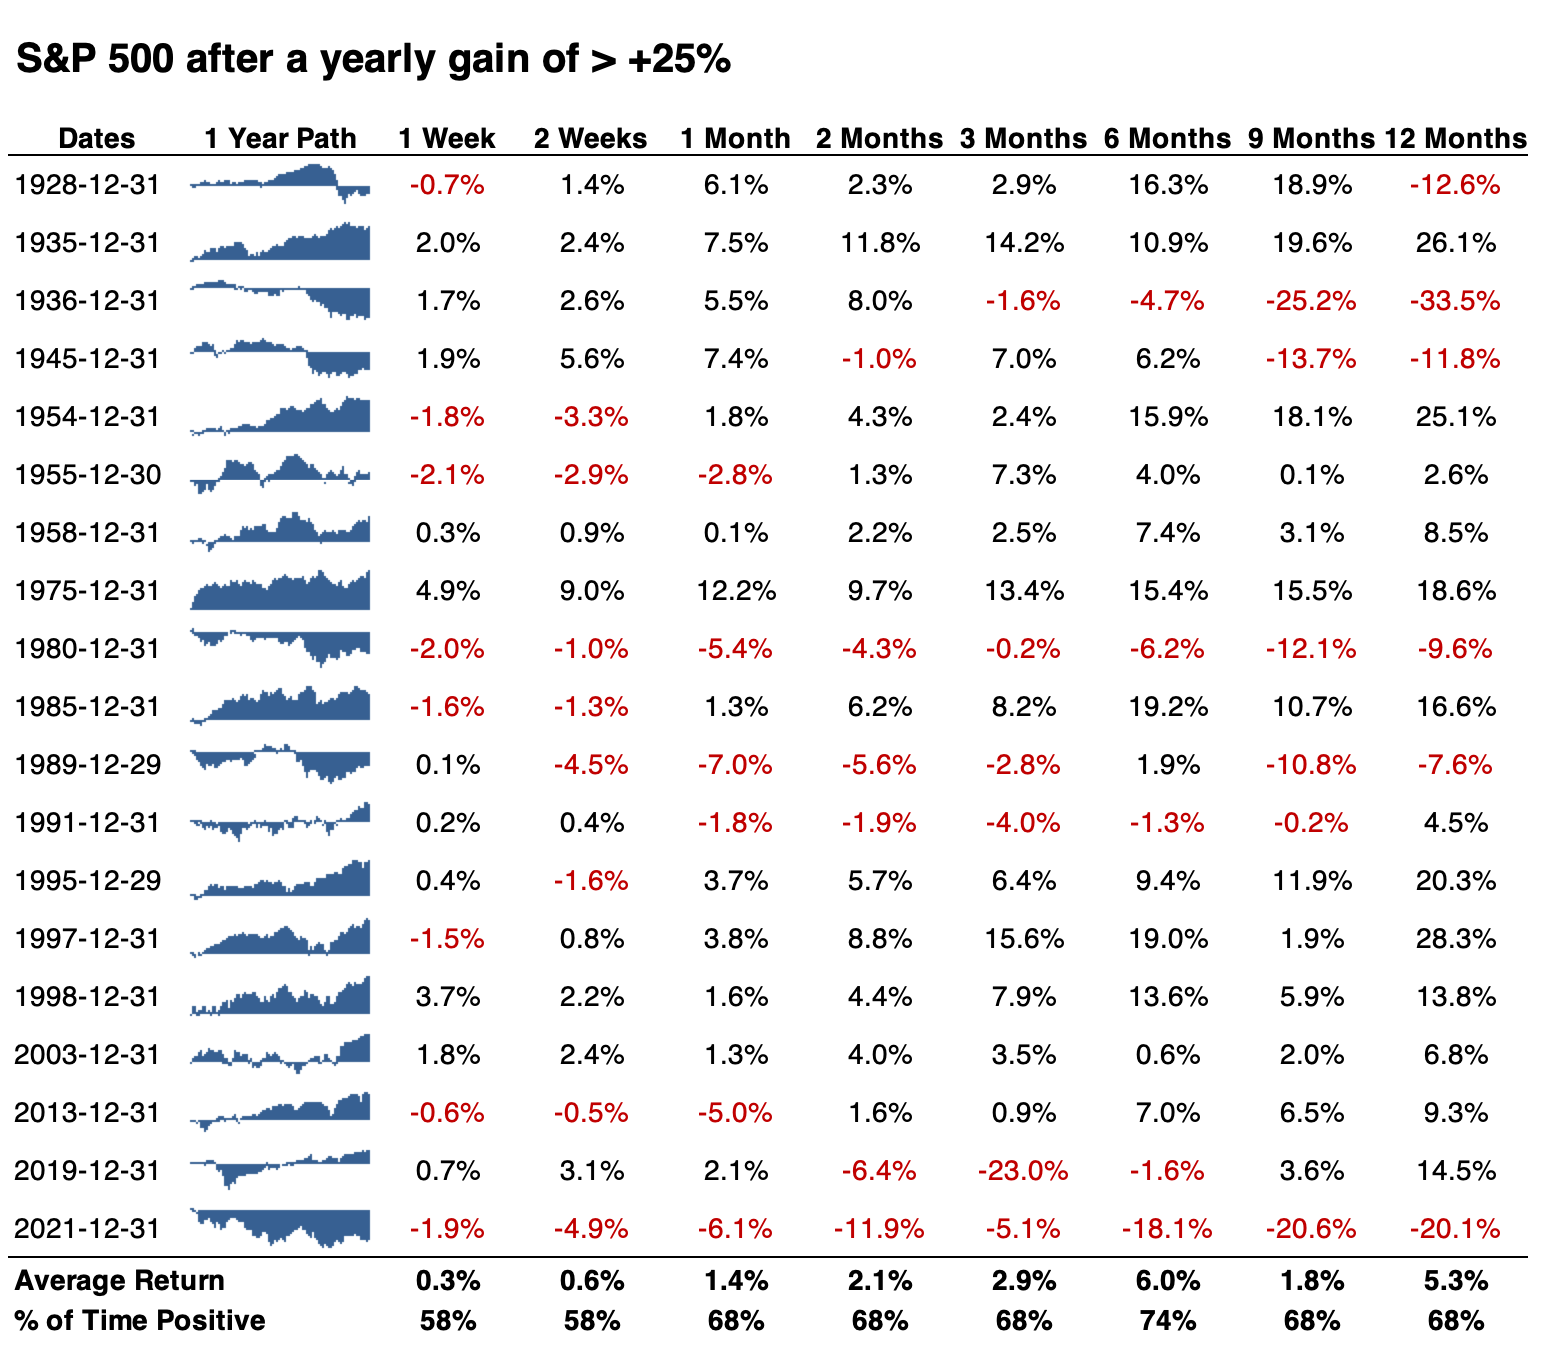
Since the gains have been so substantial, some analysts suggest that investors will wait to sell until the calendar turns to delay paying capital gains taxes. That's a compelling theory, but little evidence supports it. Historically, the S&P 500 still showed relatively positive returns in the first weeks of a new year following a significant yearly gain.
But breadth has been weak
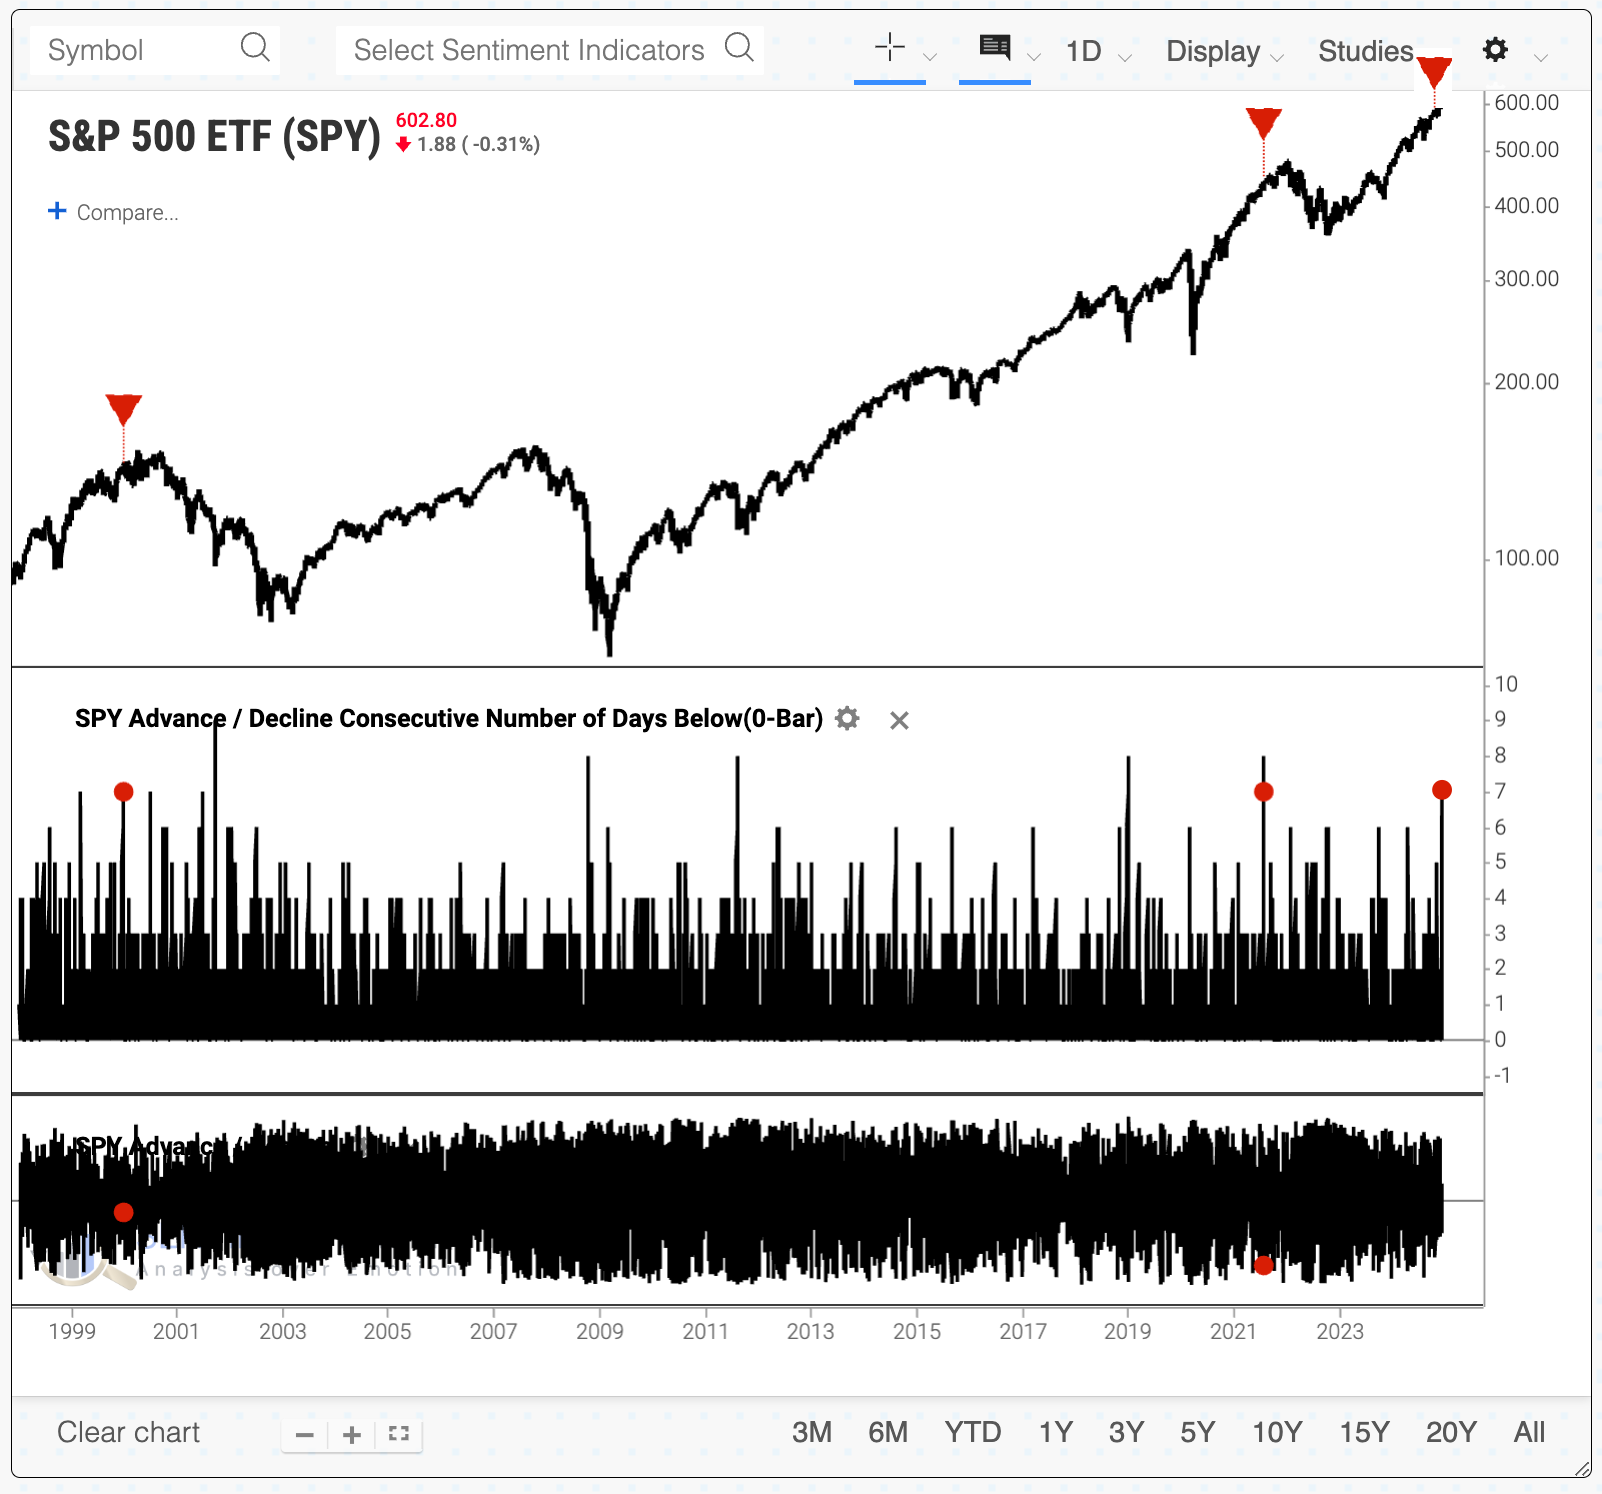
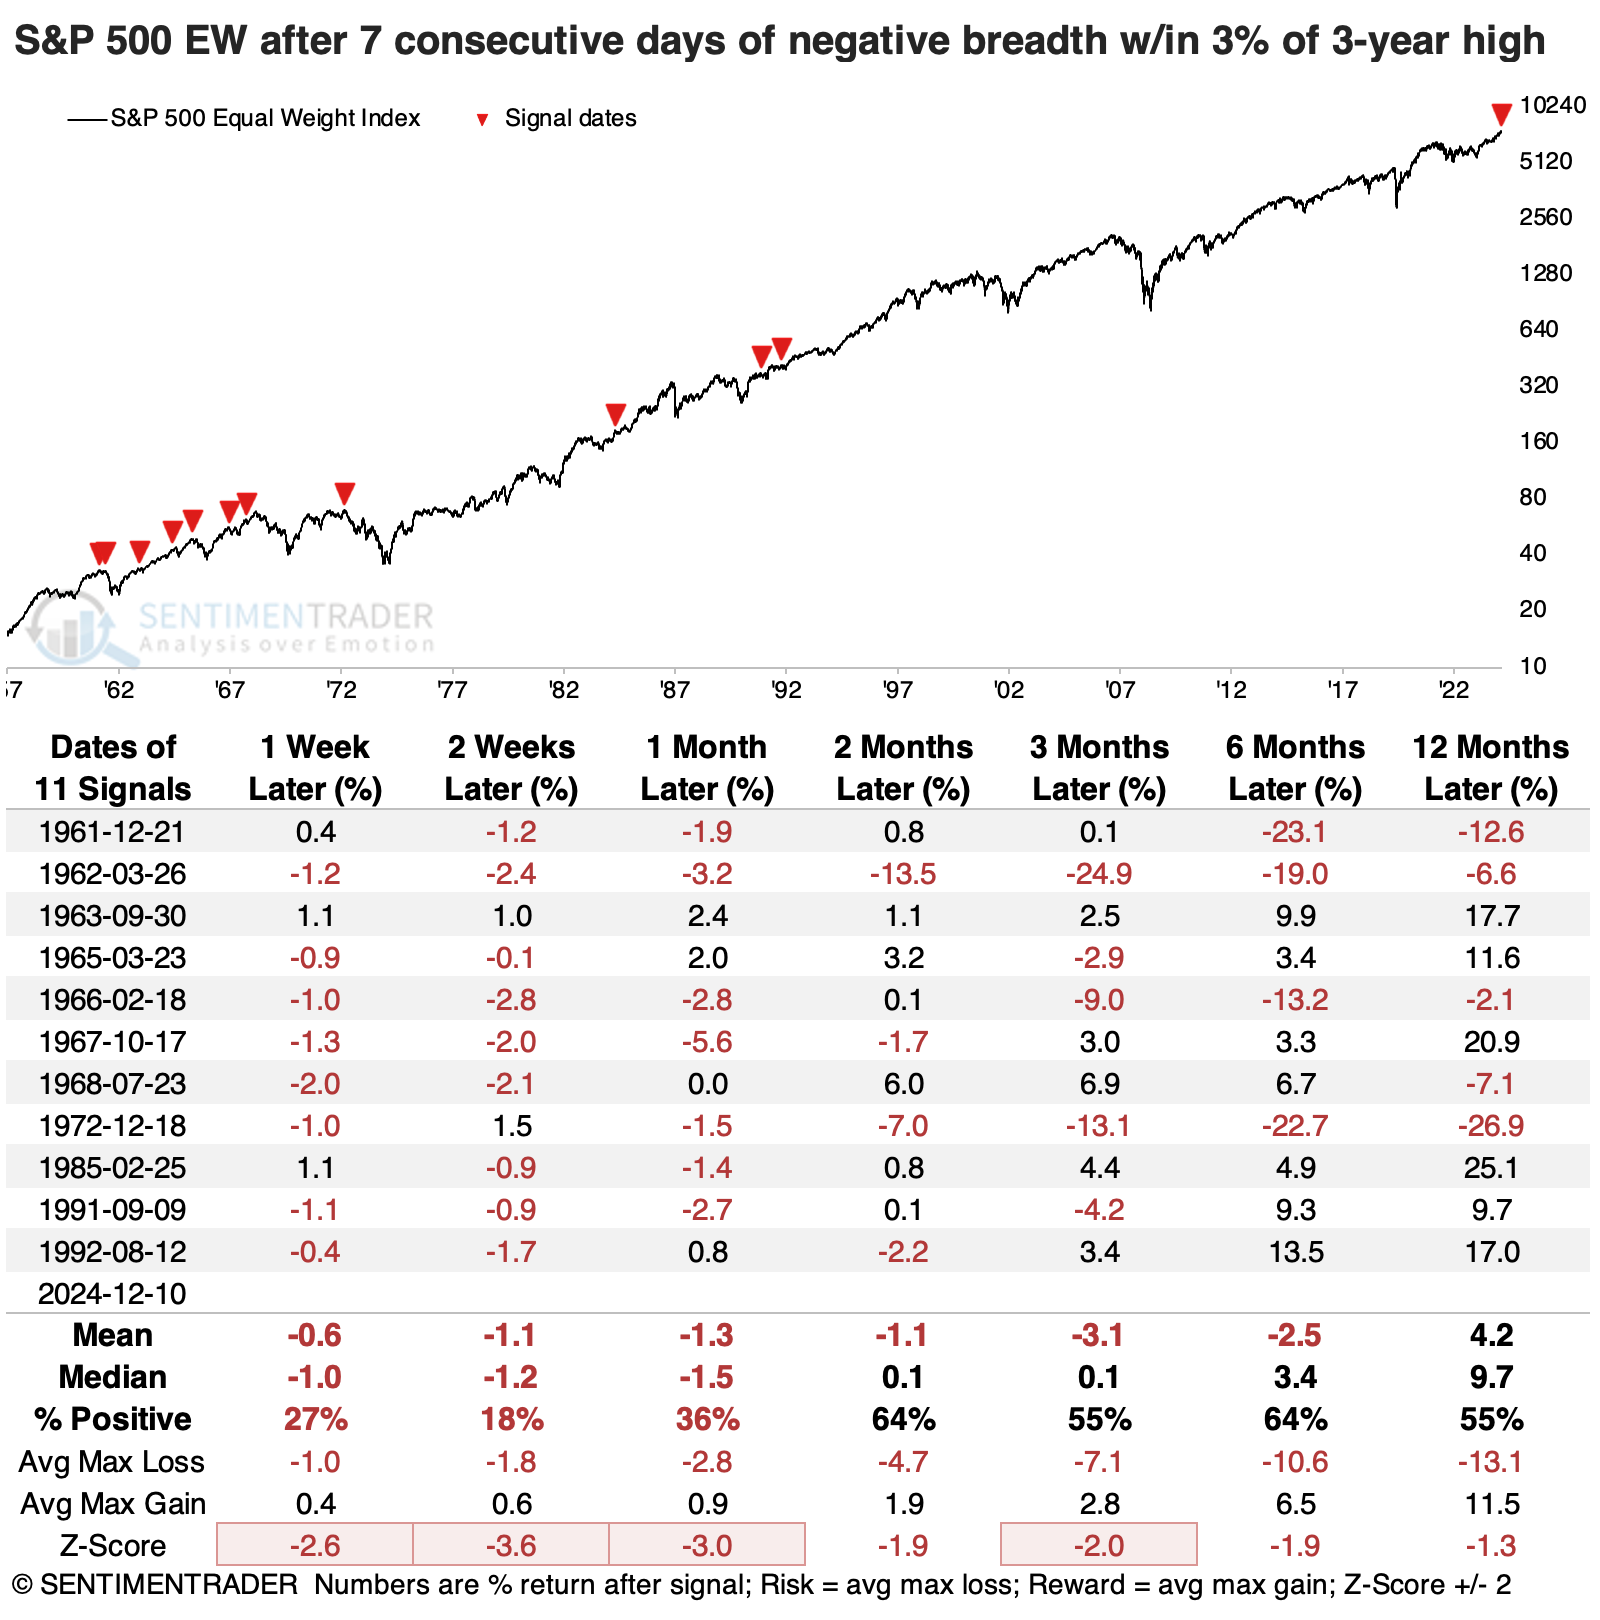
Oddly, despite the indices holding up well over the past week, breadth has been negative for the past seven days. Within the S&P 500, the past seven sessions all saw more declining stocks than advancing ones. In the past 25 years, this has only happened twice before when SPY was within 3% of a multi-year high. And those precedents were...ick.
This is also an unusual setup when the equal-weight version of the S&P 500 is hovering within 3% of a multi-year high. While we might assume that stocks would enjoy some mean-reversion, with buyers spotting a buying opportunity after a rest, it wasn't really the case. Over the next 1-2 weeks, the equal-weight S&P rallied only 18% of the time. The last few signals showed good long-term returns.
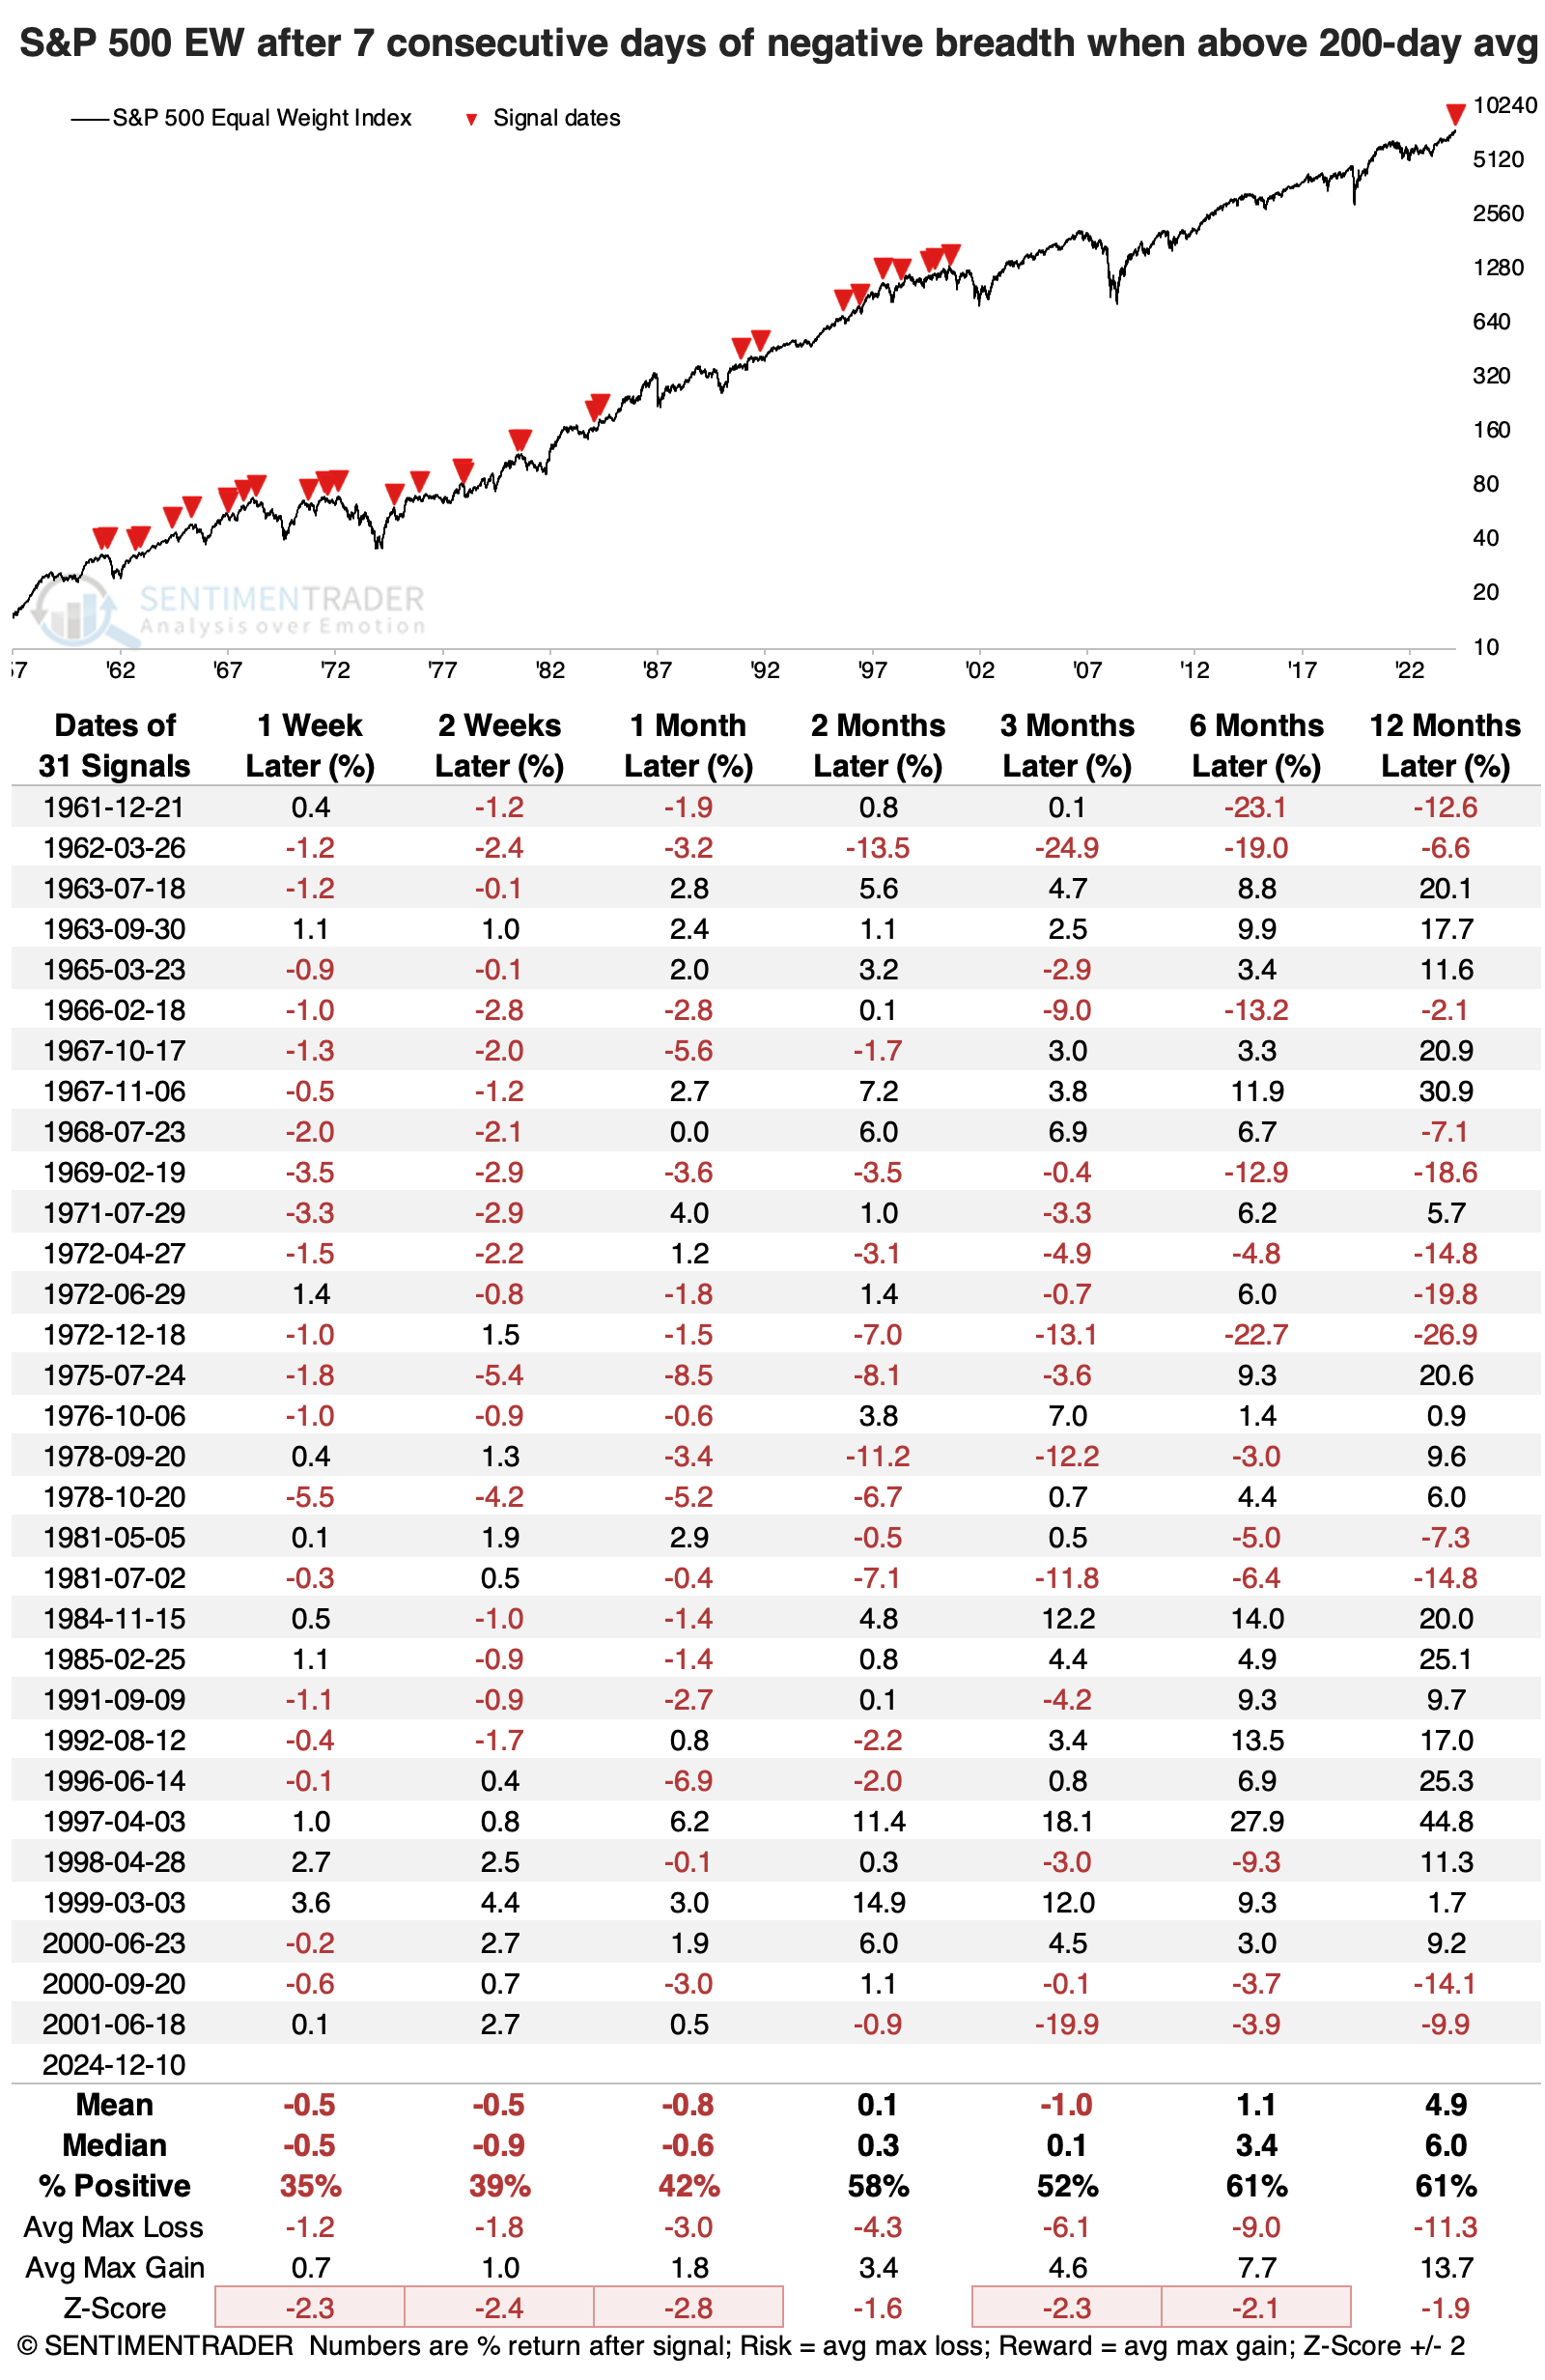
If we expand the sample to look for any 7-day negative breadth streak while the equal-weight S&P was trading above its 200-day moving average, we get a large number of precedents. However, with 31 signals, only 39% witnessed a rally over the next few weeks.
What the research tells us...
Market watchers tend to give seasonal influences more weight than they deserve, at least in the stock market. But the stock market is such an unruly beast that it does not often comply with simple theories for rising or falling, like the assumption of capital gains avoidance into a new year.
It has consistently shown poorer short-term returns after streaks of bad breadth during strong uptrends. This is also a bit of a warning that the rally has gone on as long as it has and for as much as it has, particularly in the Dow and Nasdaq. Investors have had an excellent environment for around two years, and it's not always a good idea to simply assume those good times will continue unabated.